
Abstract
Dynamic focusing cochlear implant strategies aim to emulate normal cochlear excitation patterns by varying the degree of current focusing as a function of input level. Results on the speech perception benefits of these strategies have been mixed. In previous studies, channel interaction coefficients (K), which mediate the relationship between current level and degree of focusing, were fixed across channels and participants. Fixing K without accounting for channel interaction and the current required to accurately stimulate target neurons may elicit suboptimal loudness growth and speech perception. This study tested whether individualizing K improved speech perception relative to fixed-K and monopolar strategies. Fourteen ears of implanted adults were programmed with 14-channel strategies matched on pulse duration, pulse rate, filtering, and loudness. Sentence recognition and vowel identification was measured at 60 dB SPL equivalent in quiet and four-talker babble. On the group level, speech recognition in quiet and noise was similar between strategies. On the individual level, there were participants who benefitted with dynamic focusing strategies for speech perception in noise. Patterns of benefit were generally unclear, beyond associations between focused thresholds, duration of hearing loss, and individual-K benefit. Participants rated dynamic focusing like monopolar in clarity and ease of listening. Almost all participants expressed their willingness to use the strategies in a take-home trial. These results suggest that while individualizing K does not benefit all, there are individuals who benefit, for which the electrode–neuron interface may play a role. Future studies will evaluate acclimatization of dynamic focusing strategies using take-home trials.
Introduction
Speech recognition in noise is often poor for cochlear implant (CI) listeners, even for those who perceive speech well in quiet (Firszt et al., 2004; Friesen et al., 2001; Won et al., 2007). Nearly all CIs use a monopolar electrode configuration in which stimulation is applied between an intracochlear electrode and an extracochlear ground electrode. This creates a broad electrical field in which current is spread within the cochlea, resulting in a wide spread of excitation (Carlyon et al., 2007; Bierer, 2010; Hughes & Stille, 2010; Shannon, 1983). This spread for each channel results in unwanted channel interaction that limits spectral resolution (Bierer, 2010; Jones et al., 2013), which is critical for listening in noise (Nie et al., 2006; Shannon et al., 2004).
To reduce this broad spread of electrical current and improve spectral resolution, focused stimulation methods, such as tripolar and phased array have been explored (Long et al., 2014; Srinivasan et al., 2013). With the tripolar stimulation method, the center active electrode delivers the current waveform, and two flanking ground electrodes deliver the opposite polarity of current to close the circuit loop. Although spectral ripple discrimination benefits have been demonstrated with focused stimulation, results on speech perception benefits have been mixed (Berenstein et al., 2008; Bierer & Litvak, 2016; Smith et al., 2013; Srinivasan et al., 2013). Several factors limit the clinical application of focused stimulation, including increased power consumption (Bierer & Litvak, 2016), insufficient loudness growth (Bierer & Nye, 2014; Chatterjee, 1999; Chua et al., 2011), and potential side-lobe activation (Bonham & Litvak, 2008; Litvak et al., 2007).
Dynamic focusing is one method that has been developed to try to overcome these limitations, reducing power consumption and removing the potential activation of side lobes. Dynamic focusing aims to approximate cochlear excitation patterns in the healthy cochlea by varying the degree of focusing as a function of input level (Arenberg et al., 2018; Bierer, 2010; de Jong et al., 2019a). This results in more focused stimulation and narrower excitation patterns for low intensity sounds, and less-focused stimulation and broader excitation patterns for high-intensity sounds (Arenberg et al., 2018; Litvak et al., 2007). This has been implemented in two different ways. In Arenberg et al. (2018) the focusing coefficient, σ, determining the fraction of return current directed to flanking electrodes, was fixed at 0.8 for threshold and 0.5 for most comfortable levels, whereas De Jong et al. (2019a, 2019b) and van Groesen et al. (2022) used the highest σ possible for threshold and then fixed the current level, changing focusing to change loudness. The second method leads to σ that are <0.5, resulting in current spread similar to that produced with monopolar stimulation (Bierer & Middlebrooks, 2002; Bonham & Litvak, 2008; Landsberger et al., 2012). The speech perception benefits of dynamic focusing, compared to the standard monopolar configuration, are uncertain from the little available evidence. In a pilot study, de Jong et al. (2019a) reported that dynamic focusing improved spectral temporally modulated ripple ability, but was similar to monopolar strategies for speech perception. Arenberg et al. (2018) reported similar performance for vowel identification in quiet and spondees in noise between monopolar, fixed partial tripolar and dynamic focusing strategies, but a small benefit for vowel identification in noise with the dynamic focusing strategy.
In these studies, it was posited that one factor that may have affected the results was a lack of adaptation and familiarization with the novel strategies, and that clearer benefits would be observed through experience outside the laboratory. In a take-home trial complicated by learning effects, de Jong et al. (2019b) reported poorer speech recognition in noise at 65 dB SPL with dynamic focusing strategies compared to clinical control strategies. Sound quality with dynamic focusing strategies was also judged to be poorer in the same study, compared to monopolar strategies. In both Arenberg et al. (2018) and de Jong et al. (2019b) studies there were individual differences in benefit which could not be clearly explained.
A second factor that may also account for some of the variability observed is the approach to setting the channel interaction coefficient, K. K is a constant which affects the relationship between σ and the current necessary to achieve threshold level activity for the center electrode, Ithr, as expressed in equation (1) (Litvak et al., 2007), where Ithr(0) is the current necessary to achieve threshold activity in monopolar (σ = 0):

Consider a group of three electrodes, with one center current source and two adjacent flanking electrodes. As the distance between the stimulating electrodes and target neurons increases, the current produced by each electrode at a given location in the medium decreases. This leads to weaker generated current and less accurate stimulation of target neurons. As a result, neighboring electrodes may contribute to the activation of the same neural population, the weaker electric field leading to greater current spread. This, in turn, increases channel interaction, decreasing stimulation accuracy. Setting K appropriately high compensates for this effect, resulting in large increases in Ithr for small increases in σ. Conversely, when electrodes are closer to target neurons and channel interaction is low, setting K lower results in smaller increases in Ithr for small increases in σ. The schematics in Figure 1 illustrates this. Modeling shows that K consequently affects loudness growth, as estimated by the number of active neurons; the greater current increases associated with higher K values leads to steeper loudness growth (Litvak et al., 2007; L Litvak, personal communication, May 2021).
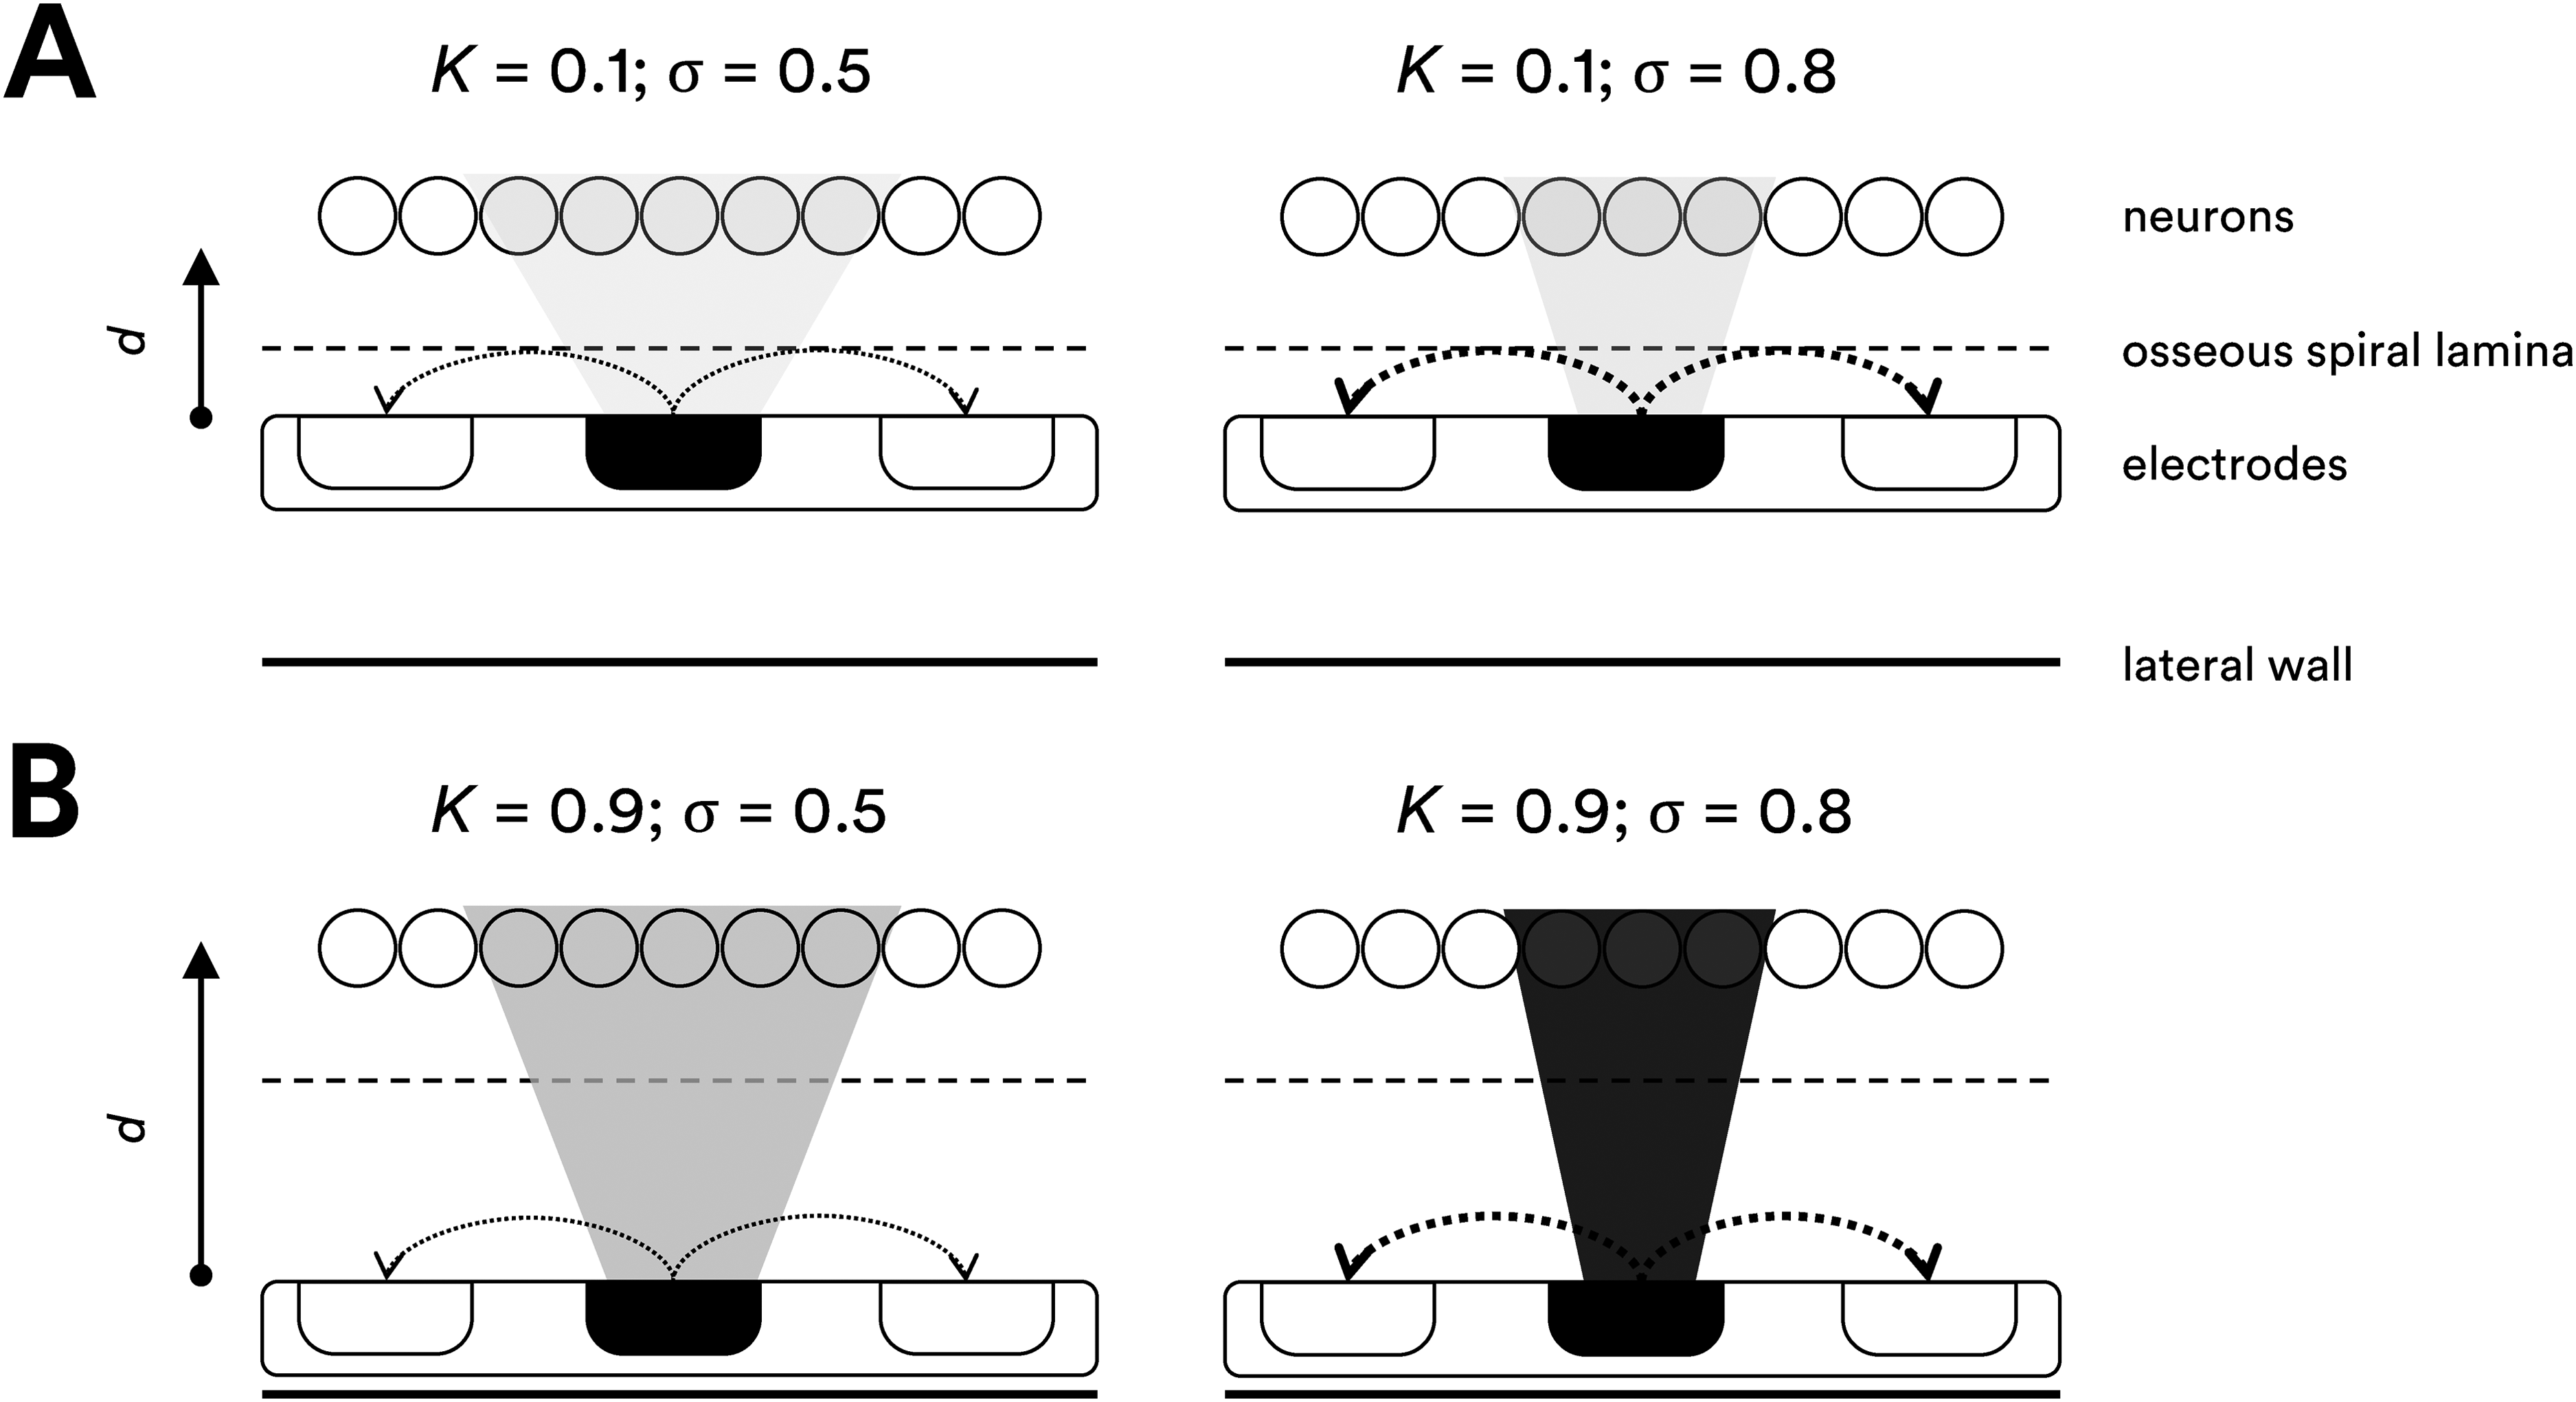
The effect of channel interaction (K) and focusing (σ) coefficients on current levels required for neural stimulation. Electrodes are shown as rounded rectangles, and neurons as circles. The edge of the osseous spiral lamina is indicated by the dashed line, and the lateral wall by the solid line. The spatial extent of current required to activate neurons are indicated by the shaded areas. Active electrodes and excited neurons are filled. The active electrodes are shown with dotted arrows indicating the direction of current flow toward the ground electrodes. Schematic A (top panel) shows a short electrode-to-neuron distance (d) where K = 0.1. The current level is relatively constant and increases only very slightly with an increase in focusing, as indicated by the similar, light shading for stimulation at σ = 0.5 (left) and σ = 0.8 (right). Schematic B (bottom panel) shows a large electrode-to-neuron distance where K = 0.9. Here, the current levels are greater than for K = 0.1, represented by the darker shading. The current level is highly dependent on changes in focusing, and increases a large amount with an increase in focusing, as indicated by the much darker shading for σ = 0.8 (right) compared to σ = 0.5 (left).
In studies by Arenberg et al. (2018) and de Jong et al. (2019a, 2019b), K was fixed across channels and participants to 0.9 and 1.0, respectively. If a greater K is used than would be optimal based on measures of the electrode–neuron interface, then loudness growth on those electrodes may differ from the expected acoustic level to electric charge mapping; a fixed-K may result in suboptimal loudness growth for some channels, negatively affecting the perception of key speech features, such as formant frequencies and transitions. Arenberg et al. (2018) reported that individuals whose K estimates were most similar to the fixed-K of 0.9 used, were the participants who benefitted the most from dynamic focusing. A recent study compared dynamic focusing with K individualized for each channel to monopolar with nine participants and 3 weeks listening experience (van Groesen et al., 2022). There was weak evidence of a benefit for dynamic focusing on a spectral resolution task, and no evidence of benefit in a matrix sentence test with stationary speech-shaped noise. While five participants performed better with dynamic focusing at 65 dB SPL in the sentence recognition task, it was unclear whether these improvements were meaningful for any individual.
The primary aim of the current study was to test the hypothesis that speech perception will be improved when K is individualized for each channel. Speech perception was measured with sentence recognition and vowel identification tasks; the latter of which is particularly dependent on spectral acuity. These tasks were conducted in quiet and in ecologically valid, temporally fluctuating four-talker babble. A second goal was to test the hypothesis that speech perception will be improved with dynamic focusing relative to the monopolar configuration.
The measurement of single-channel detection thresholds in response to focused electrical fields, referred to onwards as focused thresholds, was conducted as part of the process for creating the dynamic focusing strategies. Focused thresholds have been shown to be a sensitive psychophysical measure of electrode–neuron interface quality, indicating electrode-to-neuron distance (DeVries & Arenberg, 2018; Jahn & Arenberg, 2019; Long et al., 2014) and intracochlear resistance (Jahn & Arenberg, 2019). In addition to sentences in noise, a vowel identification task, which relies heavily on the transmission of spectral information, was conducted in the current study to evaluate the strategies. Previous work has demonstrated a link between focused thresholds and vowel identification measured with monopolar strategies, in that participants with higher focused thresholds were associated with poorer vowel identification (Arjmandi et al., 2022). Previous work has also shown an association between channel-to-channel variability in focused thresholds and speech recognition (Bierer, 2007; Long et al., 2014; Pfingst et al., 2004). Focused thresholds, therefore, may be a useful tool in programming to benefit the transmission of spectral cues important for speech perception. A tertiary aim of this study was to see whether the previously observed relationship between the focused thresholds and vowel identification held in the current study, and whether this relationship extended to vowel identification with dynamic focusing strategies.
Methods
Participants
Eleven adults (seven females) implanted with Advanced Bionics CIs participated, and 14 ears were tested (six right ears). Four participants were bilateral CI recipients, seven were unilateral CI recipients. Eight of the 11 participants were new to partaking in cochlear implant research. Participant demographics are reported in Table 1. All participants were native speakers of American English. Participants attended two 3 h sessions on different days at Massachusetts Eye and Ear in Boston. The first session consisted of programming, while the second session consisted of evaluation. All participants provided written, informed consent, and the study was approved by the Institutional Review Board of the Partners Human Research Committee, Boston, Massachusetts.
Participant Characteristics.

CI = cochlear implant; HL = hearing loss; SD = standard deviation; SNHL = sensorineural hearing loss; SNR = signal-to-noise ratio.
Electrode Configurations
Two electrode configurations, monopolar (σ = 0) and dynamic focusing (σ = 0.8 at threshold input levels and σ = 0.5 at most comfortable levels [MCLs]; Litvak et al., 2007) were used to create three 14-channel strategies: one monopolar strategy, and two dynamic focusing strategies, one with K fixed across channels to 0.9 (fixed-K), and another with K individualized on a channel-by-channel basis (individual-K). The monopolar and fixed-K strategies were created in the same manner as that in Arenberg et al. (2018).
Biphasic, cathodic-leading pulse trains (97 μs/phase, 0 μs interphase gap, 200.4 ms duration, 997.9 pps) were presented using steered quadrupolar stimulation to measure detection thresholds and MCLs to guide programming. Stimuli were presented directly to the internal device via a custom MATLAB software interfacing with BEDCS (bionic ear data collection system) software provided by the Advanced Bionics Corporation (version 1.18; Valencia, CA).
With steered quadrupolar stimulation, each channel consists of four intracochlear electrodes: two active middle electrodes and two return outer electrodes. The current focusing coefficient, σ, adjusts the degree of focusing, determining the fraction of return current, with the remaining current flowing through an extracochlear ground. σ ranges from 0 to 1: σ = 0 represents monopolar stimulation, with all of the return current flowing through the extracochlear ground; σ = 1 represents maximum current focusing, with all of the return current flowing through the intracochlear return electrodes (i.e., 50% of the return current flows through each of the two return electrodes).
Dynamic Range
Detection thresholds were measured for both monopolar (σ = 0) and steered quadrupolar electrode (σ = 0.8) configurations. These thresholds were used as a starting level for finding the focused σ = 0.8 thresholds, given that thresholds are correlated between the two configurations (Bierer et al., 2015). MCLs were measured for monopolar (σ = 0) and steered quadrupolar electrode configurations at σ = 0.5 and 0.8.
Detection thresholds were measured using a sweep procedure (Bierer et al., 2015), where pulse trains were presented at regular time intervals between the two active electrodes while varying the steering coefficient, alpha (α) from 0 to 1 in steps of 0.1. When α = 0, all current is steered to the more apical electrode of the two, and when α = 1, all current is steered through the more basal electrode of the two. This presentation was repeated continually for the subsequent more basal electrodes until all pairs were tested (electrodes 2–15), completing a single forward sweep. For electrodes 3–15, the channel number is the number of the active basal electrode when α = 1, and α of 0 centers current on electrode 2. For each sweep, participants were instructed to hold down the spacebar when the stimulus was audible, and to release the spacebar when it was inaudible. The current between pulse trains decreased when the participant held down the spacebar and increased when the spacebar was released. Participants completed one forward (apical to basal) and backward (basal to apical) sweep, and the thresholds were averaged. The mean across-site monopolar threshold was 32.6 dB re 1 μA (standard deviation [SD] = 3.5 dB), while the mean across-site steered quadrupolar (focused) threshold (σ = 0.8) was 40.8 dB re 1 μA (SD = 4.1 dB). Participant's mean monopolar and focused thresholds were positively correlated (r = 0.64; p = .0129). Figure 2 shows line plots of the thresholds and MCLs measured across participants.

Line plots of the electrical dynamic range display the mean detection thresholds and most-comfortable loudness levels for two electrode configurations: monopolar (left panel) and steered quadrupolar with σ = 0.8 (right panel). The mean detection thresholds are represented by upward pointing triangles on thick black lines, while the most-comfortable loudness levels are represented by downward pointing triangles on thick black lines. Error bars are ± 1 standard deviation. Individual data are shown as thin gray lines.
MCLs, for the upper limit of stimulation for each threshold sweep procedure, were measured behaviorally prior to threshold sweeps. Current level was increased manually from a subthreshold level of 50 μA until participants reported a loudness rating of “6,” “most comfortable” on the Advanced Bionics Clinical Loudness Scale. Current level was increased in steps of 2 dB until a loudness rating of “4,” “comfortable but too soft,” and then increased in steps of 0.5 and 0.1 dB. The mean monopolar MCL was 45.8 dB (SD = 1.9 dB), while the mean steered quadrupolar MCLs for σ = 0.5 and 0.8 were 50.3 dB (SD = 2.6 dB) and 54.3 dB (SD = 3.3 dB), respectively. Participant's mean monopolar and steered quadrupolar MCLs for σ = 0.8 were positively correlated (r = 0.76; p = .002).
Arenberg et al. (2018) used MCLs to estimate K for individual electrodes across the array, and supported Litvak et al.'s (2007) prediction that K increases with larger distances between stimulating electrodes and target neurons. Therefore, K was estimated for individual electrodes for individual participants using MCLs as an indicator of the degree of channel interaction. The equation for calculating K is expressed in equation (2), where MCLs for steered quadrupolar electrode configurations at σ = 0.5 and 0.8 are denoted MCL0.5 and MCL0.8, respectively: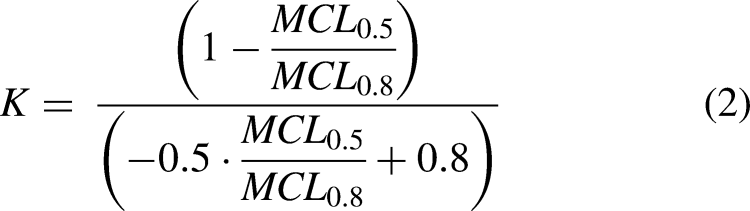
Stimulation Strategies
The monopolar, fixed-K and individual-K strategies were created using Advanced Bionics’ BEPS+ (Bionic Ear Programming System) research processor fitting software using research Harmony sound processors as in Arenberg et al. (2018). More information on the Advanced Bionics’ research software can be read in Litovsky et al. (2017). All three strategies were matched on pulse duration, filter settings and loudness on a channel-by-channel basis. A 14-channel, dynamic focusing strategy was first created, upon which the individual-K and monopolar strategies were based. Electrodes 1 and 16 were deactivated as they cannot be active electrodes for dynamic focused strategies. Frequency was reallocated following the clinical default settings for 14 channels. The input dynamic range was set to 60 dB, and no other gains were applied. The dynamic focusing pulse width was automatically set during programming, and this pulse width was used for the remaining strategies. Detection thresholds and MCLs previously measured were converted from dB re 1μA into charge units and used for creating the stimulation strategies. These levels were verified using tone stimulation and the live voice of the researcher using the Advanced Bionics Clinical Loudness Scale. For the individual-K strategy, the estimated K values were manually input into the BEPS+ program files under “ChannelInteractionIndex” for each channel using Notepad++. Threshold levels and MCLs were loudness balanced between strategies on a channel-by-channel basis. As in de Jong et al. (2019b), four participants reported a continuous low-level background noise when activating the dynamic focusing strategies, which disappeared with adaptation or upon lowering the current at threshold level. Strategies were then written to the research processor using the “Aux Only” setting for testing through direct audio input.
Speech Recognition and Sound Quality Measures
Programming levels were verified and loudness balanced between strategies on a channel-by-channel basis, and on a program level using live speech through the microphone at the start of the second session. Then, speech recognition testing was conducted using the ListPlayer software with BEPS+ (v1.18.26, Advanced Bionics) running in parallel and using the direct audio input cable. Participants were seated in an audiometric booth facing a large window in which they had a computer monitor and mouse for closed-set testing. Speech recognition was tested with the three strategies (monopolar, fixed-K and individual-K). While the first strategy tested was always monopolar, the test order of the second and third strategies was counterbalanced across participants. The participants were blind to which strategy they were using (the strategies were labeled A, B, and C on sound quality ratings), however, the researchers were not, as they were conducting the data collection.
Participants first had 15 min of self-paced listening to AzBio sentences (Spahr et al., 2012) with each strategy, with the sentences being displayed on the monitor. Sentences were presented at 60 dB SPL equivalent in quiet. The signal was calibrated through direct connect using the ListPlayer software such that a signal presented at a level equivalent to 60 dB SPL in the sound field: the signal was digitally calibrated to match the microphone output with the equivalent SPL.
Open-set sentence recognition and closed-set vowel identification was measured at 60 dB SPL equivalent in quiet and Auditec four-talker babble noise, which was delivered through the same line-in input. Sentence recognition, scored on keywords, was first tested using Institute of Electrical and Electronical Engineers sentences (IEEE, 1969) which contain five keywords each. Each list consisted of 10 sentences spoken by a male-talker. Participants completed one practice list with feedback, two lists in quiet, and then four lists in noise. The signal-to-noise ratio (SNR) was adjusted for each participant, so that performance was between 40% and 60% correct with the monopolar strategy. Testing with focused strategies was then conducted at the SNR established with the monopolar strategy.
Closed-set vowel identification was then tested in quiet and four-talker babble noise using Nationwide Speech Project New England words in the /hVd/context (Clopper & Pisoni, 2006), spoken by a male-talker. The SNR was adjusted for each participant, so that performance was between 60% and 80% correct with the monopolar strategy. Testing with focused strategies was then conducted at the equivalent SNR. A single closed-set list consisted of identifying 10 possible words, and one run consisted of three repetitions of each word (three lists and 30 words tested per run)
For vowel identification, participants completed one practice run with feedback, two runs in quiet, and then two runs in noise. Thus, keyword recognition was tested for each strategy with 20 sentences in quiet and 40 sentences in noise, while vowel identification was tested for each strategy with 60 words in quiet and 60 words in noise. These scores were averaged and converted to rationalized arcsine units for analyses (RAU; Studebaker, 1985).
Participants completed sound quality ratings on clarity and ease of listening in both quiet and noise following speech recognition testing. Comparisons were made relative to their everyday strategy on a seven-point scale (from −3, much worse, to +3, much better; 0 was the same). Note, the monopolar strategies tested in the study were different to everyday strategies in pulse duration and having two fewer electrodes. Participants were also asked if they would be willing to wear each program every day in a 1-month trial. Data analyses were conducted in MATLAB 2018a (The Mathworks, Natick, MA), apart from where noted.
Results
Speech Recognition
Table 2 shows the mean speech recognition scores and 95% confidence intervals. Figures 3 and 4 show bar plots of speech recognition scores in quiet and noise, respectively. One-way repeated measures ANOVAs were conducted in R Studio (version 2021.9.1.372; RStudio Team, 2020) to test the mean differences in speech recognition scores (RAU) between the three strategies. Keyword recognition in quiet was similar between the three strategies [F(2, 26) = 0.069; p = .934; partial ƞ2 = 5.26 × 10⁻³], as was vowel identification in quiet [F(2, 26) = 0.179; p = .839; partial ƞ2 = 0.01]. Keyword recognition in noise [F(2, 26) = 0.342; p = .713; partial ƞ2 = 0.03] and vowel identification in noise [F(2, 26) = 2.266; p = .124; partial ƞ2 = 0.15] were again alike on the group level between the three strategies. One participant (1L) did particularly poorly at keyword recognition in noise with the fixed-K strategy. Removing this outlier reduced the value of p (increasing F), but it still exceeded a threshold of 0.05 [F(2, 24) = 1.510; p = .241; partial ƞ2 = 0.03].
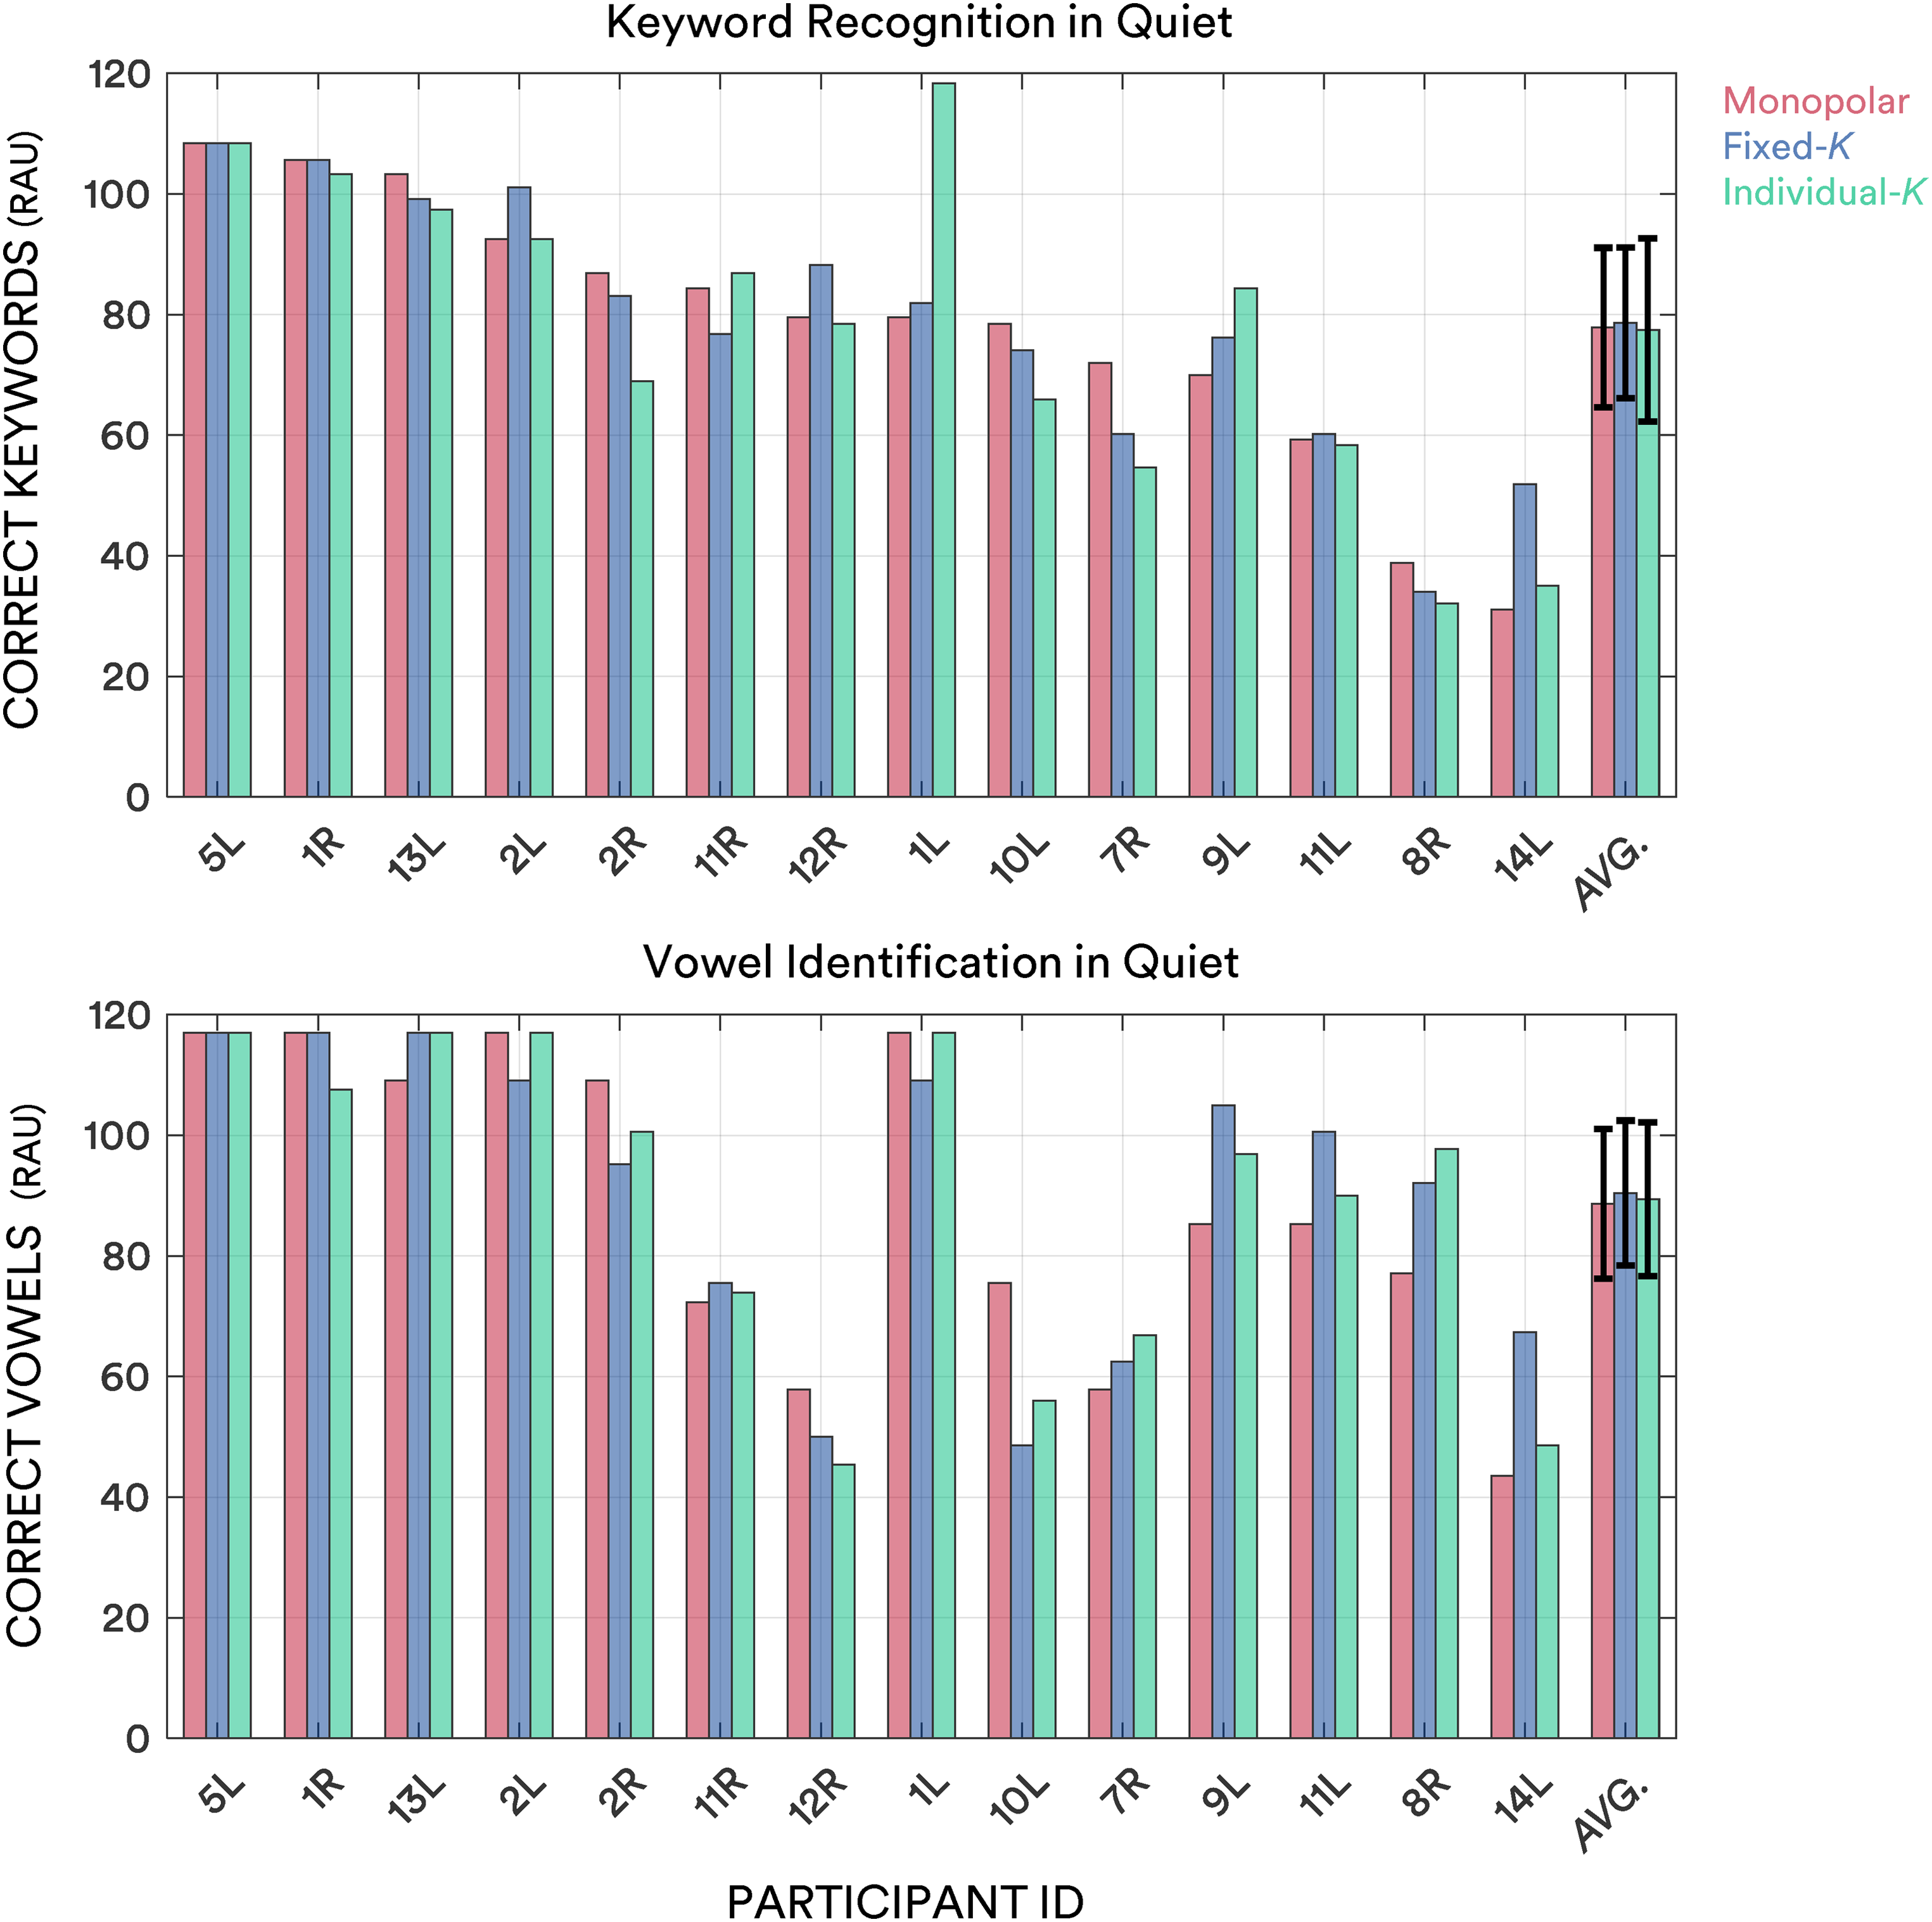
Bar plots showing speech recognition in quiet (RAU) with the monopolar (red), fixed-K (blue) and individual-K (green) strategies. Bars are ordered according to keyword recognition in quiet performance with the monopolar strategy. Error bars on the average (end; “AVG”) bars denote 95% confidence intervals of the means. RAU=rationalized arcsine unit.
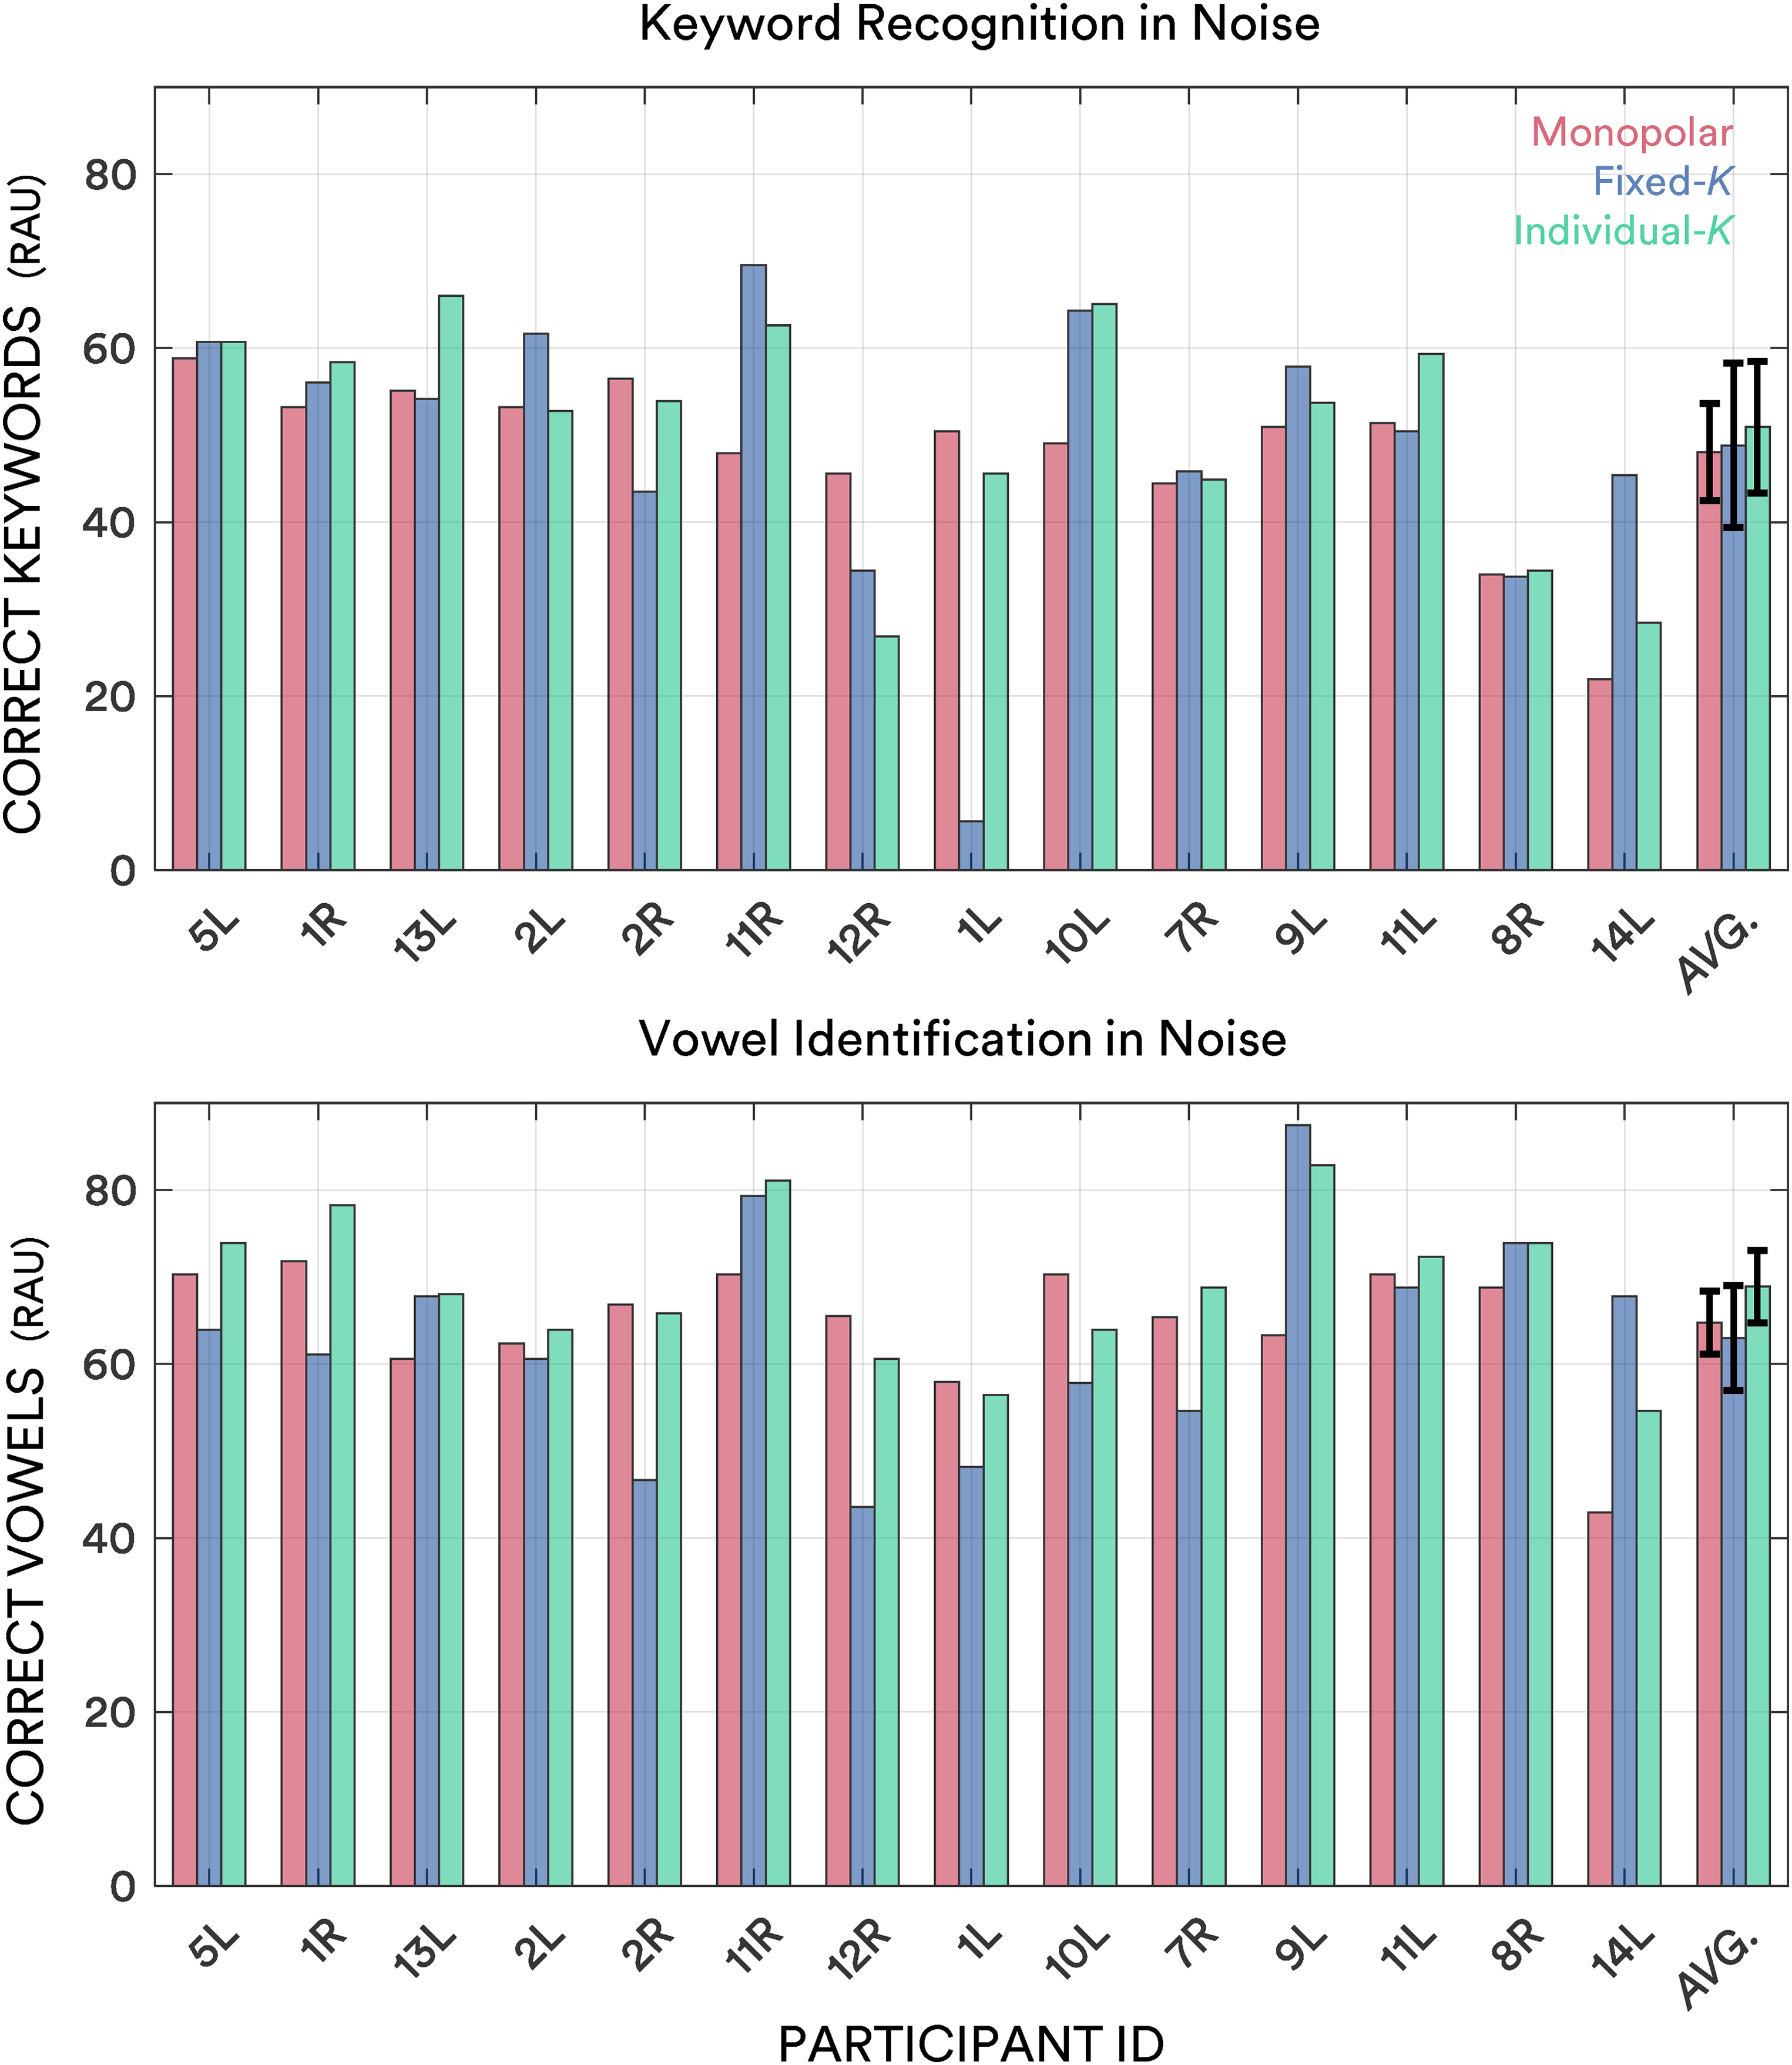
Bar plots showing speech recognition in noise (RAU) with the monopolar (red), fixed-K (blue) and individual-K (green) strategies. Bars are ordered according to keyword recognition in quiet performance with the monopolar strategy. Error bars on the average (end; “AVG”) bars denote 95% confidence intervals of the means. RAU=rationalized arcsine unit.
Mean Speech Recognition Performance Across Participants with 95% Confidence Intervals of the Means in Brackets.

RAU=rationalized arcsine unit.
Speech recognition in noise benefits were analyzed on the level of the individual using critical difference (CD) scores (e.g., Cox et al., 1988; Vandali et al., 2019). To determine the CDs in keyword recognition and vowel identification in noise, the average variation in test scores for each participant was calculated across strategies. These values were then averaged across participants to calculate mean within-participant test variabilities of 8.2 RAU and 5.0 RAU for keyword recognition and vowel identification, respectively. These values were then multiplied by 1.96 and divided by the square root of the number of lists to obtain CDs of 8.0 RAU and 4.0 RAU for keyword recognition and vowel identification in noise, respectively. Improvements of a CD relative to the second-best strategy were examined for each participant. For keyword recognition in noise, one participant (12R) benefitted more than a CD with monopolar, two participants (2L and 14L) benefitted more than a CD with fixed-K, and two participants (11L and 13L) benefitted more than a CD with individual-K. Participant 10L benefitted more than a CD with both dynamic focusing strategies than monopolar. For vowel identification in noise, two participants (10L and 12R) benefitted more than a CD with monopolar over dynamic focusing, two participants (9L and 14L) benefitted more than a CD with fixed-K and one participant (1R) benefitted more than a CD with individual-K. Participant 8R improved more than a CD over monopolar with both dynamic focusing strategies. Figure 5 shows scatterplots comparing the performance of the strategies in noisy conditions. CD improvements are indicated by color fill for each of the three pairwise comparisons (rather than the improvement relative to the second-best strategy).

Scatterplots comparing monopolar, fixed-K and individual-K performance for keyword recognition in noise (circle markers) and vowel identification in noise (diamond markers). Filled markers denote performance greater than a critical difference for that particular comparison of strategies. Markers filled red denote better performance with monopolar, markers filled blue denote better performance with fixed-K, while markers filled green denote better performance with individual-K.
Patterns of dynamic focusing benefit (relative to monopolar) for keyword recognition and vowel identification in noise were explored using linear mixed-effects models (fit for benefit with each strategy using the fitlme function in MATLAB). Fixed effects were duration of hearing loss, age at implantation, duration of implant experience, electrode array type, and mean and SD in focused thresholds. Participant ID was the random effect. There was little evidence that any of the factors were associated with benefit for either dynamic focusing strategy or test type (p > .05 for all), apart from duration of hearing loss (β = 0.47; SE = 0.16; CI = 0.09–0.85; p = .02) and mean focused threshold (β = 1.50; SE = 0.16; CI = 1.15–1.83; p = 1.71 × 10⁻⁵) which were associated with individual-K benefit for vowel identification in noise.
Sound Quality Ratings
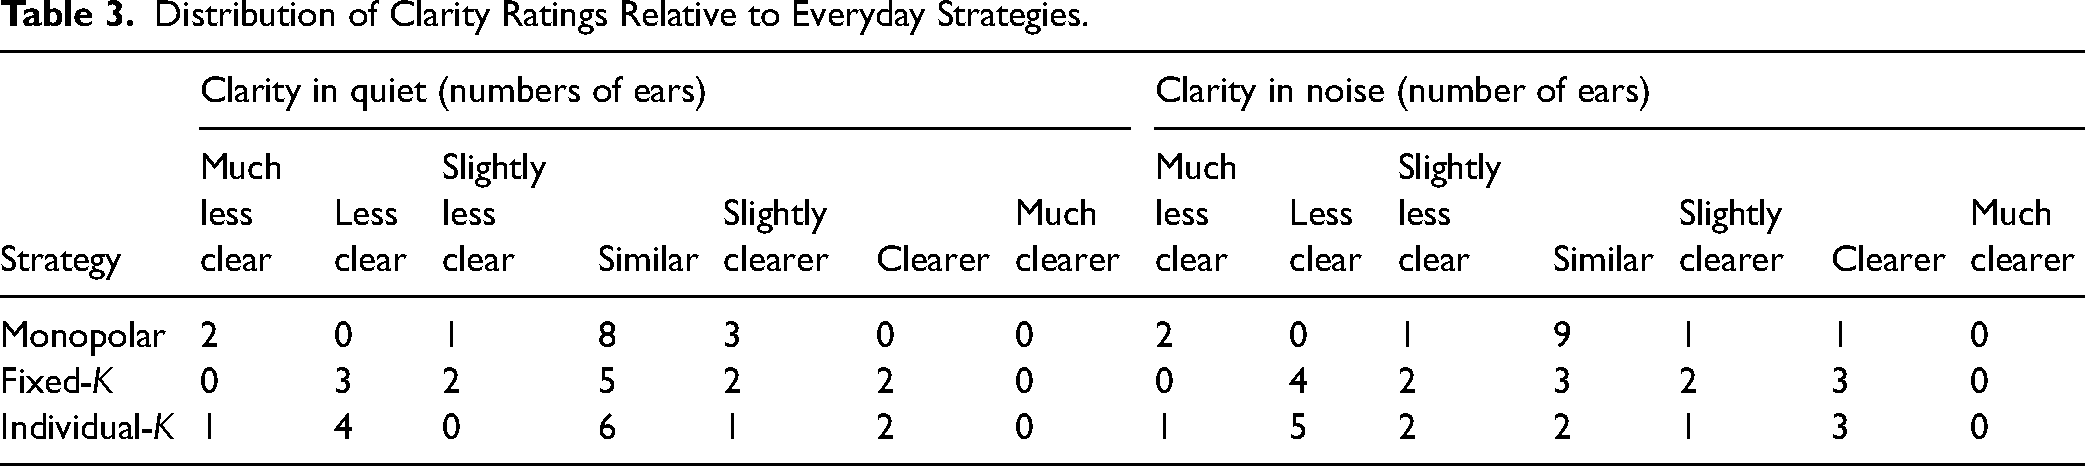
Participants rated each strategy on clarity and ease of listening in comparison to their everyday strategies. Figure 6 and Tables 3 and 4 shows the distribution of ratings. The overall distribution of ratings for the two dynamic focusing strategies were relatively similar, while the monopolar strategy was generally judged to be more like everyday strategies; for example, for clarity in noise, nine participants judged monopolar to be similar to their everyday strategy, in contrast to only three and two participants who judged the fixed-K and individual-K strategies to be similar, respectively. Note, that while there was a greater amount of “less clear” and “less easy” ratings for the dynamic focusing strategies compared to monopolar, there were also a greater amount of “clearer” and “easier” ratings for dynamic focusing compared to monopolar. Clarity and ease of listening was judged to be more like everyday strategies in quiet than in noise for dynamic focusing, where ratings were more divergent. No participant found any of the three strategies to provide much greater clarity or ease of listening compared to everyday strategies. Chi-squared tests suggested that the overall distribution of ratings shown in Figure 6 were similar between the strategies (p > .23 for all comparisons for clarity in quiet; p > .26 for all comparisons for clarity in noise; p > .30 for all comparisons for ease in quiet; p > .18 for all comparisons for ease in quiet). There was no clear evidence of an association between average sound quality ratings and average speech recognition (relative to monopolar) for either the fixed-K (r = 0.09 for quiet and r = 0.28 for noise; p > .33) or individual-K (r = 0.08 for quiet and r = 0.06 for noise; p > .77) strategies. All but one participant said they would be willing to wear the monopolar and fixed-K strategies every day in a 1-month trial, while all but three said they would do so for the individual-K strategy.

The distribution of sound quality ratings for the monopolar (red), fixed-K (blue) and individual-K (green) strategies on clarity and ease of listening in quiet and noise, compared to everyday strategies. Ratings of “much less” to “slightly less” clear or easy are grouped as “less clear” or "less easy", while “slightly” to “much” clearer or easier ratings are grouped as “clearer” or "easier".
Distribution of Clarity Ratings Relative to Everyday Strategies.
Distribution of Ease of Listening Ratings Relative to Everyday Strategies.

Associations Between Focused Thresholds and Vowel Identification
Linear mixed-effects models (fit for each strategy using the fitlme function in MATLAB) were used to examine whether focused thresholds were related to vowel identification in quiet, as in Arjmandi et al. (2022). Vowel identification in quiet scores were response variables, mean focused thresholds and 1 standard deviation in focused thresholds were fixed effects, and participant ID was the random effect. The Holm-Bonferonni method (Holm, 1979) was used to correct for multiple comparisons. For the monopolar strategy, a 1 dB increase in mean focused threshold was associated with a −2.29 RAU decrease in vowel identification (SE = 0.60; CI = −3.62 – − 0.96; p = .003). While negative coefficients were estimated between vowel identification and both mean (β = −2.33; SE = 1.84; CI = −6.38–1.71; p = .23) and standard deviation in focused threshold (β = −4.25; SE = 3.74; CI = −12.49–3.99; p = .28) for fixed-K, the p-values and confidence intervals were not supportive of a relationship. With individual-K, a 1 dB increase in mean and standard deviation in focused threshold was associated with a − 4.26 RAU (SE = 0.10; CI = −4.48 – − 4.03; p = 1.88 × 10⁻¹³) and − 2.73 RAU (SE = 0.19; CI = −3.15 – − 2.30; p = 2.11 × 10⁻⁸) decrease in vowel identification score, respectively. The relationship between focused thresholds and vowel identification in noise was not examined, as SNRs varied between participants, unlike in Arjmandi et al. (2022) where the SNR was constant.
Discussion
This laboratory study tested whether individualizing channel interaction coefficients, K, in dynamic focusing strategies benefitted speech perception, compared to fixing K. There was no clear benefit to individualizing K on the group level for keyword recognition and vowel identification in quiet. Furthermore, while keyword recognition and vowel identification in noise with dynamic focusing strategies was at least as good as with monopolar strategies, there was no clear benefit to either dynamic focusing strategies on the group level. The similar performance on speech recognition between strategies is in line with prior studies evaluating dynamic focusing (Arenberg et al., 2018; de Jong et al., 2019a, 2019b; van Groesen et al., 2022) and other focusing techniques (Berenstein et al., 2008; Bierer & Litvak, 2016). Further investigation into individual performance in noise was conducted, which showed that while there was no clear difference between dynamic focusing strategies, some participants did benefit from dynamic focusing compared to monopolar. Five participants scored more than a critical difference with dynamic focusing strategies over monopolar for keyword recognition in noise, while four participants scored more than a critical difference with dynamic focusing strategies over monopolar for vowel identification in noise.
There were considerable interindividual differences in demographic profiles and audiological history within the sample, and patterns of benefit could not be clearly explained by such factors, nor electrode array type, as in previous explorations (Arenberg et al., 2018; de Jong et al., 2019b; van Groesen et al., 2022). There was some evidence that duration of hearing loss and focused thresholds were associated with individual-K benefit, suggesting that benefit of compensating for channel interaction by individualizing K may be mediated by the electrode–neuron interface (Long et al., 2014). Other methods to assess the electrode–neuron interface beyond focused thresholds such as the electrically evoked compound action potential (DeVries et al., 2016; Jahn & Arenberg, 2020) and psychophysical tuning curves (DeVries and Arenberg, 2018) were not measured in the current study, but may reveal clearer patterns of benefit based on inferences of neural health and electrode position.
Sound quality ratings were in line with previous studies (Arenberg et al., 2018; de Jong et al., 2019a, 2019b; van Groesen et al., 2022). There was evidence of a mismatch between objective and subjective speech perception; while participant 7R generally reported the dynamic focusing strategies to be worse than their everyday and monopolar strategies (much worse in noise), their speech recognition performance was not that different between strategies and was sometimes better with dynamic focusing. Participants only had 15 min to adapt to each strategy in this study. Some listeners may need daily listening experience to adapt to novel stimulation strategies, and studies have shown that this acclimatization can lead to listeners attaining greater benefits from novel stimulation strategies (Fu et al., 2002; Fu & Galvin, 2007). This is particularly pertinent given that several participants in the current study and in de Jong et al. (2019b) required time to adapt to a continuous low-level noise when activating the dynamic focusing strategies.
This study also examined whether the relationship between focused thresholds (measured with σ = 0.9) and vowel identification in quiet reported by Arjmandi et al. (2022) held and extended to vowel identification with novel dynamic focusing strategies. The association between mean focused thresholds (measured here with slightly less focusing, σ = 0.8) and vowel identification with the monopolar strategy held in the current study, the strength of the association (β = −2.29) similar to that reported by Arjmandi et al. (β = −2.92). A relationship was also apparent for the individual-K strategies; participants with greater focused thresholds had poorer vowel identification (β = −4.26). However, while negative coefficients were estimated between focused thresholds and vowel identification for the fixed-K strategy, in line with the other strategies, an association was less clear (β = −2.33; p = .23). Overall, these findings support a link between focused thresholds and speech perception measures, that greater (poorer) focused thresholds are associated with poorer speech perception (Bierer, 2007; Long et al., 2014; Pfingst et al., 2004).
The current and previous findings that dynamic focusing strategies are at least as good as monopolar strategies, warrants take-home studies with these stimulation methods. The vast majority of participants in this study indicated they would be willing to wear each program every day in a take-home trial. The speech recognition testing in this laboratory study occurred over a period of approximately 3 h. While participants were given breaks, this speech recognition testing would have been mentally demanding, particularly considering that speech recognition was tested at challenging SNRs with novel stimulation methods (monopolar was always tested first for a speech recognition task, followed by counterbalanced dynamic focusing testing). This demand would increase noise within the test session and exacerbate variability in performance. Future studies will use take-home trial field methods which facilitate listener adaptation to the novel strategies and will include more sophisticated self-assessments of intelligibility. To more directly assess loudness perception, future studies could also measure loudness growth using various K coefficients.
Footnotes
Acknowledgements
The authors would like to thank the research participants for their time and dedication. The authors would also like to thank Dr. Charlotte Morse-Fortier for her assistance in data collection and Dr. Leonid M. Litvak for technical support. Finally, the authors would like to thank Dr. Meisam K. Arjmandi and Dr. Barbara S. Herrmann for helpful discussions on this study. This work was supported by the NIH National Institute on Deafness and Other Communication Disorders Grant RO1 DC012142 (JGA).
Declaration of Conflicting Interests
The author(s) declared no potential conflicts of interest with respect to the research, authorship, and/or publication of this article.
Funding
The author(s) received no financial support for the research, authorship, and/or publication of this article.