
Abstract
The main pre-implant factors that relate to speech perception outcomes in adults with cochlear implants (CIs) are well known. However, it is not clear if these same factors are related to music perception and enjoyment. This study explored the relationship between self-reported pre-implant hearing and music experiences, and post-implant chord discrimination and music enjoyment. An online platform was used to deliver the Munich Music Questionnaire (MUMU), run a chord-discrimination task, and obtain demographic information. The chord-discrimination task involved detection of an upward change of one, two or three semitones in the third note, or a downward change of one, two, or three semitones in the middle note of a three-note major chord, using synthesized harmonic tones. Twenty-five CI users participated, aged 29–86 years. Exploratory factor analysis revealed three hearing-related variables (duration of hearing difficulty, age characteristics, and years of hearing with a CI), and three music-related variables (music quality from the CI, extent of music engagement, and music-listening habits). Chord-discrimination scores increased with increasing frequency change of the varying note. It was likely that some CI users used beats between tones as a discrimination cue. Chord discrimination was also better for individuals listening via loudspeakers and headphones than for those listening via Bluetooth streaming, perhaps because of artifacts produced by the latter. Chord-discrimination was better for older participants with longer experience of hearing with an implant. Those with longer duration of hearing difficulty who liked the sound quality of their CIs had higher music enjoyment scores.
Introduction
Music is an essential part of human culture, integrating and unifying societies (Nettl, 2001). It is often used as a way of communication, to share information, ideas, and feelings, and is a vital part of everyday life for many people. It is also known to evoke a wide range of emotions and can have therapeutic benefits (Blood et al., 1999). Listening to music regularly is believed to enhance the quality of life and bring pleasure (Zatorre & Salimpoor, 2013). Unsatisfactory music-listening experiences potentially reduce the enjoyment of life and may also diminish the beneficial effects of music.
Individuals with sensori-neural hearing loss (SNHL) usually have a poorer-than-normal ability to discriminate the fundamental frequency (F0) of complex sounds (Bernstein and Oxenham, 2006). F0 corresponds to the repetition rate of a periodic waveform, and it is the physical correlate of pitch. Differences in F0 are important for the perceptual segregation of simultaneous notes, as occur in music (Darwin and Hukin, 2004; Moore, 2012). Hence, reduced F0 discrimination leads to problems in hearing out individual instruments in a mixture, which is a common complaint of hearing-impaired people (Madsen & Moore, 2014).
Cochlear implants (CI) are neural prostheses designed to improve hearing for individuals with severe or profound SNHL, who get little or no benefit from hearing aids. In a CI, sound picked up by one or more microphones is subjected to pre-processing, such as noise reduction and dynamic-range compression, before being filtered into 12–22 frequency channels (Moore, 2022). In most CIs, the envelope of the signal in each channel signal is extracted and subjected to instantaneous compression. The compressed envelope magnitude is used to determine the momentary magnitude of the electric current (pulse width or pulse amplitude) delivered to the electrode corresponding to that channel. Hence, CIs mainly convey information about the temporal envelopes of sounds in different frequency regions. Information about the temporal fine structure (TFS) of sounds is usually not transmitted, except for the channels with the lowest center frequencies, but any TFS cues conveyed are poorly perceived via electrical stimulation (Moore & Carlyon, 2005).
The electrode-neuron interface (ENI) refers to the connection between the CI electrodes and the spiral ganglion neurons, whose axons combine to form the auditory nerve (DiNino et al., 2019; Paxinos, 2012). In most CIs, the electrodes are stimulated in a monopolar mode using an extracochlear return electrode (Srinivasan et al., 2013). This results in a large current spread in the cochlea, effectively reducing spectral resolution (Snel-Bongers et al., 2012; Swaddiwudhipong et al., 2021). This poor spectral resolution, combined with the lack of TFS information, leads to poor F0 discrimination and makes it hard for people with CIs to identify and discriminate melodies (Limb, 2006; Galvin et al., 2009; Limb & Roy, 2014). It is probably even harder for CI users to “hear out” the individual notes in a musical chord (Mehta and Oxenham, 2007). The problems may be exacerbated if there is substantial neural degeneration (a dead region) over a certain region of the cochlea, since stimulation of electrodes in that region may lead to neural activity at the “wrong” place in the cochlea (Moore, 2001; Shannon et al., 2002).
Adults with CIs vary in the aetiology of hearing loss, the duration and onset of hearing loss prior to receiving the CI, and pre-implant hearing experiences, all of which can affect the status of the ENI and functioning at different levels of the auditory pathway, in turn affecting speech and music perception. Speech perception with CIs worsens with increasing duration of severe-to-profound hearing loss prior to implantation (Blamey et al., 2013; Gomaa et al., 2003). This may happen because of neurodegeneration and brain atrophy (Moore and Shannon, 2009), maladaptive neural plasticity (Blamey et al., 2013), and structural changes in the brain (Vanderauwera et al., 2020).
The age at implantation is also an important factor (Dawes et al., 2015). For congenitally deaf children and pre-lingually deaf individuals, it has been hypothesized that implanting at an earlier age could reduce maladaptive cross-modal plasticity and therefore improve communication and speech recognition (Nicholas and Geers, 2007; Sharma et al., 2007). If the onset of deafness is before language acquisition, implanting at an older age could lead to detrimental effects. Younger adult CI users typically have better speech recognition than older CI users (Blamey et al., 2013; Chatelin et al., 2004), and implantation after the age of 70 years has been associated with significantly poorer outcomes (Blamey et al., 2013; Sladen & Zappler, 2015). However, as older adults are becoming healthier compared to previous generations, better outcomes are being observed for older adults and age effects may shift to older ages (Baskent et al., 2016).
Previous use of hearing aids is associated with better outcomes for CI users, perhaps because the auditory stimulation reduces the amount of peripheral and central neuronal degeneration that would otherwise occur due to insufficient auditory input (Johnson et al., 2010). However, it may also be the case the previous users of hearing aids have better neural survival in the first place than those whose hearing loss is so severe that hearing aids are of no benefit.
Better pre-implant residual hearing is associated with better speech perception abilities post-implantation (Nicholas and Geers, 2007). This may happen because good residual hearing may be associated with good survival of neurons in the auditory nerve. In addition, the preservation of low-frequency acoustic hearing in CI users is beneficial for the perception of music (Gfeller et al., 2006). For example, CI users who have residual hearing in either the non-implanted ear or the implanted ear perform better in music perception tests (Gfeller et al., 2006; Shirvani et al., 2016), react more quickly in music perception tests (Polonenko et al., 2017) and report greater music enjoyment (Looi et al., 2012; Gfeller et al., 2008).
The ability to interpret and process music may also be affected by pre-implant music experience (Moore & Shannon, 2009). CI users with longer periods of music listening or who have received musical training may develop more refined complex pattern-recognition mechanisms, allowing more effective use of “top-down” processing of the limited information provided by CIs. Greater musical experience prior to receiving a CI is associated with better perception of rhythmic and basic meter patterns (Gfeller et al., 2000) and improved melody recognition and music enjoyment (Yüksel et al., 2020). Prior musical training also affects how well CI users adapt to music listening post-implantation. Some adult CI users with prior musical training have been able to return to their careers as performing musicians after receiving a CI (Driscoll, 2012).
While there has been considerable research on how hearing-related factors and experiences prior to implantation affect speech perception with a CI, there is far less research on if or how such factors are related to music perception and music enjoyment after implantation. This study explored how self-reported pre-implant hearing-related factors, such as duration of hearing difficulty, age characteristics, and years of hearing with an implant, and music-related experiences, such as music quality of the implant, music engagement and music listening habits, are related to post-implant music discrimination and enjoyment. It was hypothesized that these hearing- and music-related variables would influence chord discrimination abilities and music enjoyment. To better profile the hearing- and music-related variables, exploratory factor analysis was conducted to combine factors into descriptive latent variables. Understanding the importance and predictive features of such factors for music perception and enjoyment might lead to ways of improving the effectiveness of CIs for music listening and to more effective rehabilitative strategies.
Methods
Three types of data were obtained: demographic data, responses to the Munich Music questionnaire (MUMU), together with some extra questions, and performance in discriminating changes in synthesised tonal harmonic complex chord (based on piano characteristics). Due to the COVID-19 pandemic, the questionnaires and chord-discrimination task were delivered using the secure online Gorilla platform. Ethical approval was given by the University of Cambridge Ethics Committee (Cambridge, UK) prior to data collection (code:19.093). All participants gave consent.
Participants
All participants were adult CI users, recruited via email circulation to The National Cochlear Implant Users’ Association, Cochlear Corporation, Advanced Bionics, Oticon Medical, Hear Today, Cochlear Implanted Children's Society, EuroCIA, Hearing Together, and by word of mouth. Twenty-five participants completed the MUMU questionnaire (12 males and 13 females), aged between 29 and 86 years (mean age 61 years, standard deviation, SD = 16 years). The family language of all participants was English. Twenty-three out of the 25 participants also completed the chord-discrimination task (11 males and 12 females; mean age 62 years, SD = 15 years). The participants were free to listen to the stimuli using their normal music-listening method. Six participants used CI Bluetooth streaming, five used headphones, and 12 used loudspeakers built into their computers.
Demographics
Munich Music Questionnaire
The Munich Music Questionnaire (MUMU), available for download at www.medel.com, was used to measure the role of music in the participants’ lives. Questions are related to everyday music-listening habits, music-quality ratings, enjoyment of different types of music (e.g., solo or orchestra) and different genres (e.g., classical or pop) of music, sound quality when listening to music (e.g., natural/unnatural, distinct/indistinct, pleasant/unpleasant), experience with playing music and singing, and music education. The responses to the questions were recorded using a 10-point scale (28 questions), and closed- and open-set questions. Minor adaptations were made to the MUMU questions following an expert review of the clarity of the text (two experts reviewed the questionnaire with the goals of ensuring the questions were relevant, up-to-date, and unambiguous). The following changes were made: For question 4 (How does music generally sound with your cochlear implant?), the response option “reverberant” was changed to “echoey” for easier interpretation.
For question 14 (Where have you listened to or do you currently listen to music?), the response option “LP/CD/MC/MP3” was removed.
For questions 12 (Which instruments can you detect well?), 13 (Which instruments do you like listening to?), 15 (Which musical genre do you listen to?) and 18 (Which instrument(s) have you ever played or are you playing now?), an additional possible response “Others (please specify)” was included, so that participants could mention instruments that were not listed.
Two questions that the review panel thought should be added were: “Do tunes that you were familiar with before your CI sound different?” and “Do you enjoy the music you used to enjoy?”.
Chord-Discrimination Task
The chord-discrimination task used a subset of the synthesised piano stimuli developed by Griffin (2017). A three-interval, two-alternative forced-choice paradigm was used. Participants were presented with three chords: two were the same C major chords, and one chord was different in that the F0 of a single note was changed. Participants were asked to select the chord that sounded different from the other two. Responses were recorded as correct or incorrect. Participants were not given any specific instructions about how rapidly they should respond. However, it was thought that more rapid responses might occur when the task was easier. Hence, reactions times were also recorded. They were measured as the time between the start of the stimulus and the participant's response. Details of the chords are given below. Note that the task could be performed based on any perceived difference between the odd-one-out and the two C major chords. Participants did not necessarily have to “hear out” the note that was changed. Indeed, the task may have been performed without hearing the pitches of any of the notes in the chords. For example, the task may have been performed using changes in the pattern of beats (amplitude fluctuations) produced by interaction of the frequency components of the notes in the chords. Nevertheless, it was thought that performance on the task would reflect the ability to discriminate the types of complex changes that occur when listening to music.
Stimuli
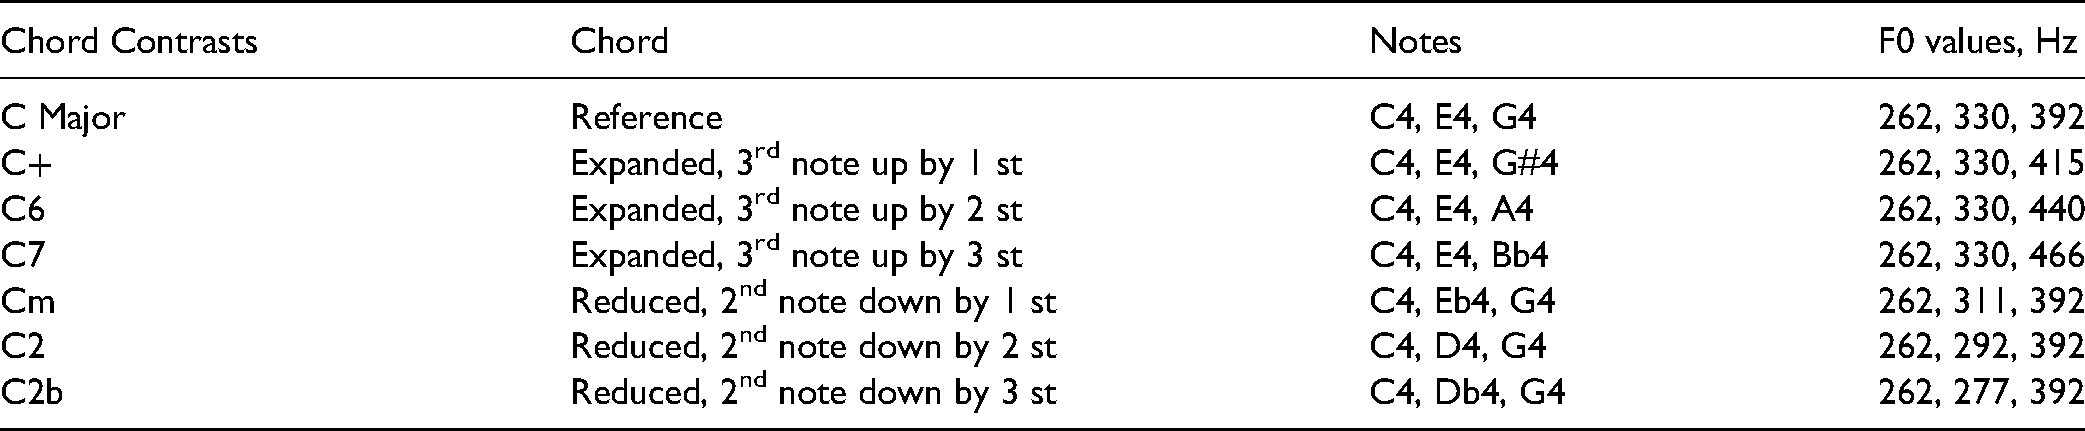
The chords were synthesised by combining three synchronous 0.5-s harmonic complex tones, each with the same overall sound pressure level. Each tone was composed of 20 harmonics, whose levels decreased with increasing frequency by about 15 dB/octave. Each tone had an abrupt onset, resembling a real piano tone, and the level decayed by about 3 dB over the first 0.4s. Over the last 0.1s of each tone, the envelope was tapered off with a raised-cosine function. Three chords were played in each trial, separated by silent intervals of 0.5s. Two were the same C major reference chord created by combining the notes C4 (262 Hz), E4 (330 Hz), and G4 (392 Hz). This reference chord was presented in the first interval of each trial and randomly in either the second or the third interval. The other chord either had the F0 of the top note increased by one, two or three semitones (called an “expanded” chord”) or had the F0 of the middle note decreased by one, two or three semitones (called a “reduced” chord). This gave six different chords to be discriminated from C major, three expanded chords (C + , C6 and C7 chords), and three reduced chords (Cm, C2, C2b), each of which was presented in ten trials in random order, giving 60 trials in total. The F0 s of the notes in each chord are shown in Table 2.
Demographic Details of Participants: Gender, Age, Age at Onset of Deafness, Age at Implantation, Years of Hearing Experience with Implant(s), Years of Experience with Hearing-Aid(s), Whether or not they had Music Education Outside of School, and if they are Currently using a Hearing-Aid

Notes and F0 s of the Different Chords. st = Semitones
Data Analysis
First, an exploratory factor analysis (EFA) was carried out based on the demographic data and MUMU questionnaire data to identify questions for which the responses clustered together to represent different hearing- and music-related latent variables (LV). These are independent variables that are not directly observed and measured but are inferred from other variables (MacCallum and Austin, 2000). Analysis was carried out using the Psych Package version 2.1.6 on RStudio version 1.4.1717 (2020). The EFA analyses were conducted according to the guidelines of Preacher and MacCallum (2003). Demographic data included in the analyses were participants’ age, age at implantation, years of using hearing aids pre-implant, years of hearing with a CI, years of severe-to-profound hearing loss before CI, age at onset of hearing loss, “how long ago was listening to a phone difficult?”, and “how long was hearing loss like it was before the implantation?”. The resulting LVs were used in the analysis of the outcomes for the chord-discrimination task and for the music enjoyment scores.
One objective of the analyses was to determine hearing- and music-related variables that were related to chord-discrimination performance. A generalized linear mixed model (GLMM) was fitted using the glmer function from the lme4 R package version 1.1–27.1. A GLMM was selected due to the binary outcome of the task: correct or incorrect for each trial. In this and subsequent analyses, participants were treated as a random effect to control for non-independence. The following variables were included as fixed effects: chord type (expanded or reduced), semitone difference (1, 2 or 3 semitones), listening modality (Bluetooth, headphones, or loudspeakers), and the LVs identified from the EFA. For this analysis and the analyses described below, variables were added to the model one-by-one and the resulting model was compared with the previous best model using χ2 tests. If a model was significantly better than the previous one, that model was selected for the next iteration. If models were not significantly different, the simplest model was selected. Odds ratios were calculated with the sjPlot package in R (Lüdecke, 2021).
Additionally, to determine how hearing- and music-related variables were related to reaction time in the chord-discrimination task, a linear mixed-effects model (LMM) was fitted to the reaction times (Magezi, 2015), using the same independent variables as for the GLMM. The linear mixed-effects model was conducted with the lmer function from the lme4 R package version 1.1–27.1. The following variables were included as fixed effects: chord type, semitone difference, listening modality, and scores for variables identified from the EFA.
Finally, it was assessed how the LVs and the differences in music enjoyment before and after receiving a CI were related to music enjoyment. This was done by fitting another GLLM. The following variables were included as fixed effects in the GLMM: time-point (pre versus post implantation) and the LVs identified using EFA.
Results
Deriving Hearing- and Music-Related Latent Variables
The aim of the first analysis was to explore the responses from the demographic and MUMU questionnaires to assess whether the responses to different questions grouped together in logical ways relating to hearing and music experiences.
To ensure that the sample size was appropriate, the Kaiser-Meyer Olkin test was conducted. This showed that the mean sampling adequacy of this study was low (KMO = 0.5), indicating a lower than ideal sample size. On the other hand, Bartlett's test of sphericity revealed that correlations between scores for the different items were significant and sufficient for factor analysis (χ2(28) = 591, p < 0.001). Therefore, we proceeded with the analysis. Both the Kaiser criterion and scree plots of eigenvalues revealed that the demographic information could be categorized into three main factor groupings. After constructing the simple structure, using “oblimin” rotation (which is applicable when some of the variables contributing to each LV are correlated), factor loadings for each of the eight items listed above were calculated and are shown for the first two LVs in Table 3.
Factor Loadings of the Demographic Variables Based on Exploratory Factor Analysis. Loadings with an Absolute Value of 0.4 or more are Highlighted in Bold Font. The Uniqueness Values give the Proportion of the Common Variance of the Variables that is not Associated with the Variables. The Variable “Years of Hearing with a CI” did not Load on Either of the First Two Variables and Hence was Considered to be a Unique Item, Denoted a Direct Variable
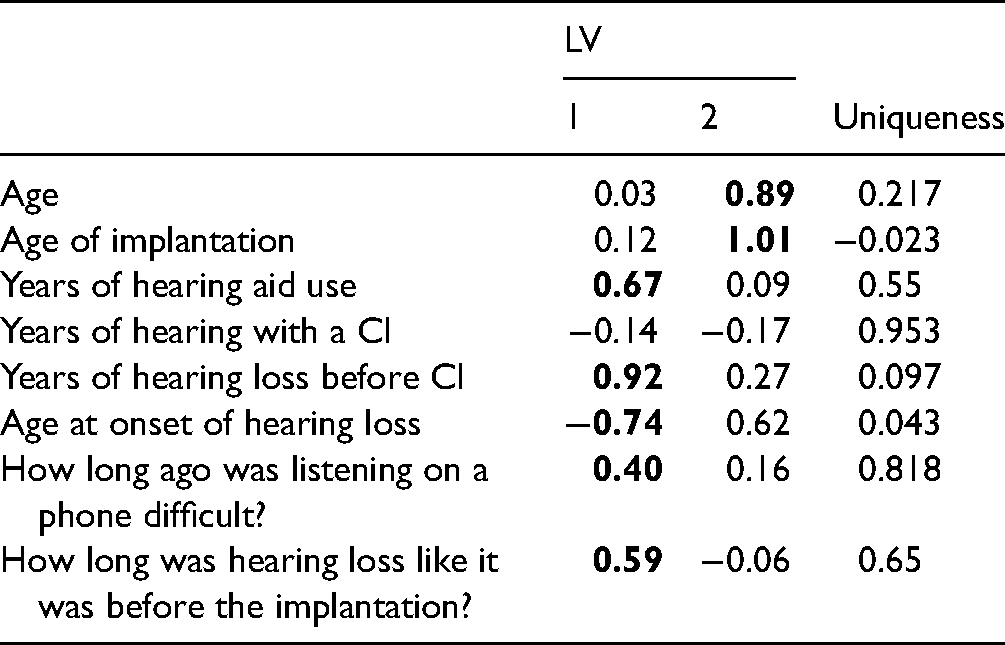
Three hearing-related LVs were identified from the EFA (Figure 1). Duration of hearing difficulty (DHD: LV1 in Table 3) was related to the duration of hearing difficulties and included “Years of hearing loss before CI,” “How long had hearing been at pre-implant level before implantation?”, “How long ago was listening to a phone difficult?”, “Years of hearing aid use,” and “Age at onset of hearing loss.” Age characteristics (AgChar: LV2 in Table 3) included “Age of implantation” and “Current age.” The third variable was a direct variable (YrsCI), years of hearing with a CI.
While the questions that clustered to form DHD were mainly about the duration of hearing difficulty, the questions that clustered to form AgChar were related to age. Individual scores for each LV were calculated and were used in correlation analyses. The mean score for DHD was 27.5 (SD = 13, N = 25) and the mean score for AgChar was 42 (SD = 15, N = 25). The mean score for YrsCI was 12.5 (SD = 8, N = 25).
EFA was also conducted on the closed set responses (1–10 scales) in the MUMU questionnaire to identify questions on music listening experience whose responses clustered together. Twenty-eight questions from the MUMU with response scales from 1 to 10 were used for the EFA. The mean sampling adequacy was the same as for the EFA on the demographic questionnaire (KMO = 0.5), and Bartlett's test of sphericity again showed that correlations between the items were significant (χ2(378) = 1633, p < 0.001), suggesting that EFA was appropriate.
Parallel analysis suggested three music-related LVs. Hence, the EFA was continued with a three-variable model. Items with a loading of 0.3 or more on two or more LVs were considered as undetermined and were removed from the analysis. Factor loadings are shown in Table 4.
Factor Loadings for the MUMU 28-Items Based on EFA. Factor Loadings of 0.3 or above are Indicated in Bold Font. Items that had Factor Loadings Above 0.3 for Two LVs were Considered as Undetermined and were Removed from the Analysis. The Uniqueness Values give the Proportion of the Common Variance of the Variables that is not Associated with the Variables. The Questions can be Found in the Supplementary Material
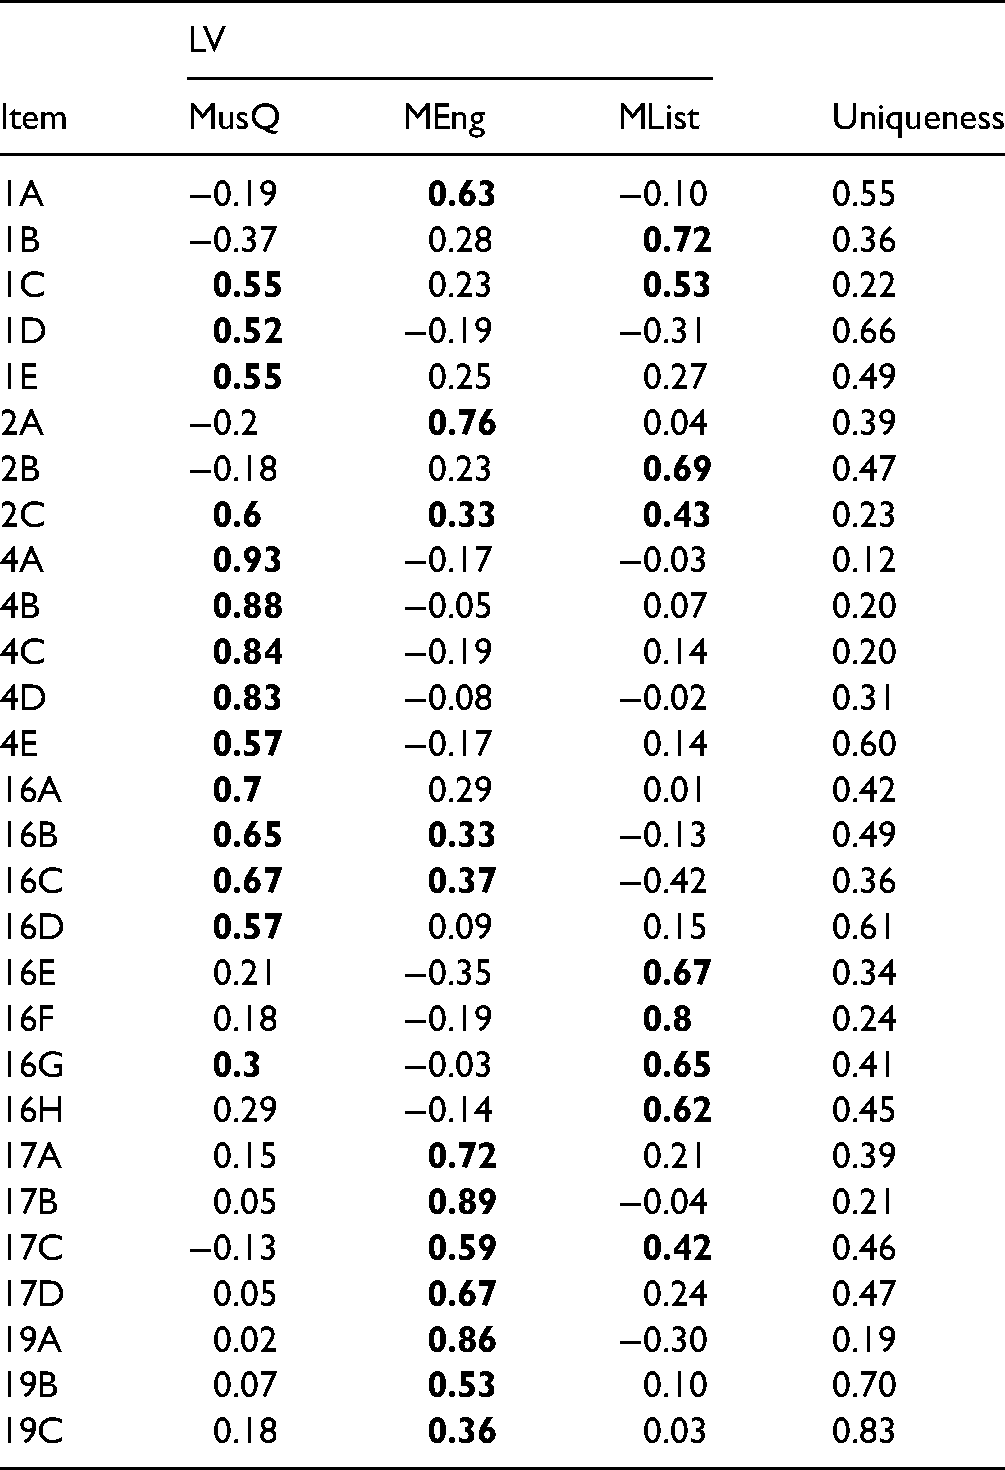
The first LV, denoted MusQ (interpreted as music quality of the implant; Mean = 5.9, SD = 2.5), included nine items, as shown in Table 5.
Nine Items Whose Scores Clustered to form the LV “Music Quality of the Implant” (MusQ)

The second LV, denoted MEng (interpreted as extent of music engagement; Mean = 4.5, SD = 2.5), included the questions shown in Table 6.
Eight items Whose Scores Clustered to form the LV “Music Engagement” (MEng)

The third LV, MList (interpreted as music listening habits; Mean = 5.3, SD = 2.6), included the questions shown in Table 7.
Five Items Whose Scores Clustered to form the LV “Music Listening Habits” (MList)

In summary, the EFA revealed three hearing-related variables (two latent and one direct), labeled DHD, AgChar, and YrsCI, and three music-listening-related LVs, labeled MusQ, MEng, and MList. The scores for these variables were used in further analysis.
Relationship of Hearing and Music-Related Variables to Performance in the Chord-Discrimination Task
Accuracy in the Chord-Discrimination Task
Accuracy was scored out of 10 for each type of chord contrast. As illustrated in Figure 2, participants tended to score higher for chords with 2- and 3-semitone differences than for chords with a 1-semitone difference. Figure 3 shows that the range of scores across participants was larger for reduced chords than for expanded chords and that median accuracy was greater for reduced chords than for expanded chords. Figure 4 shows that median scores were highest when listening via a loudspeaker and lowest when listening with Bluetooth streaming, perhaps reflecting the fact that Bluetooth streaming can introduce artifacts.
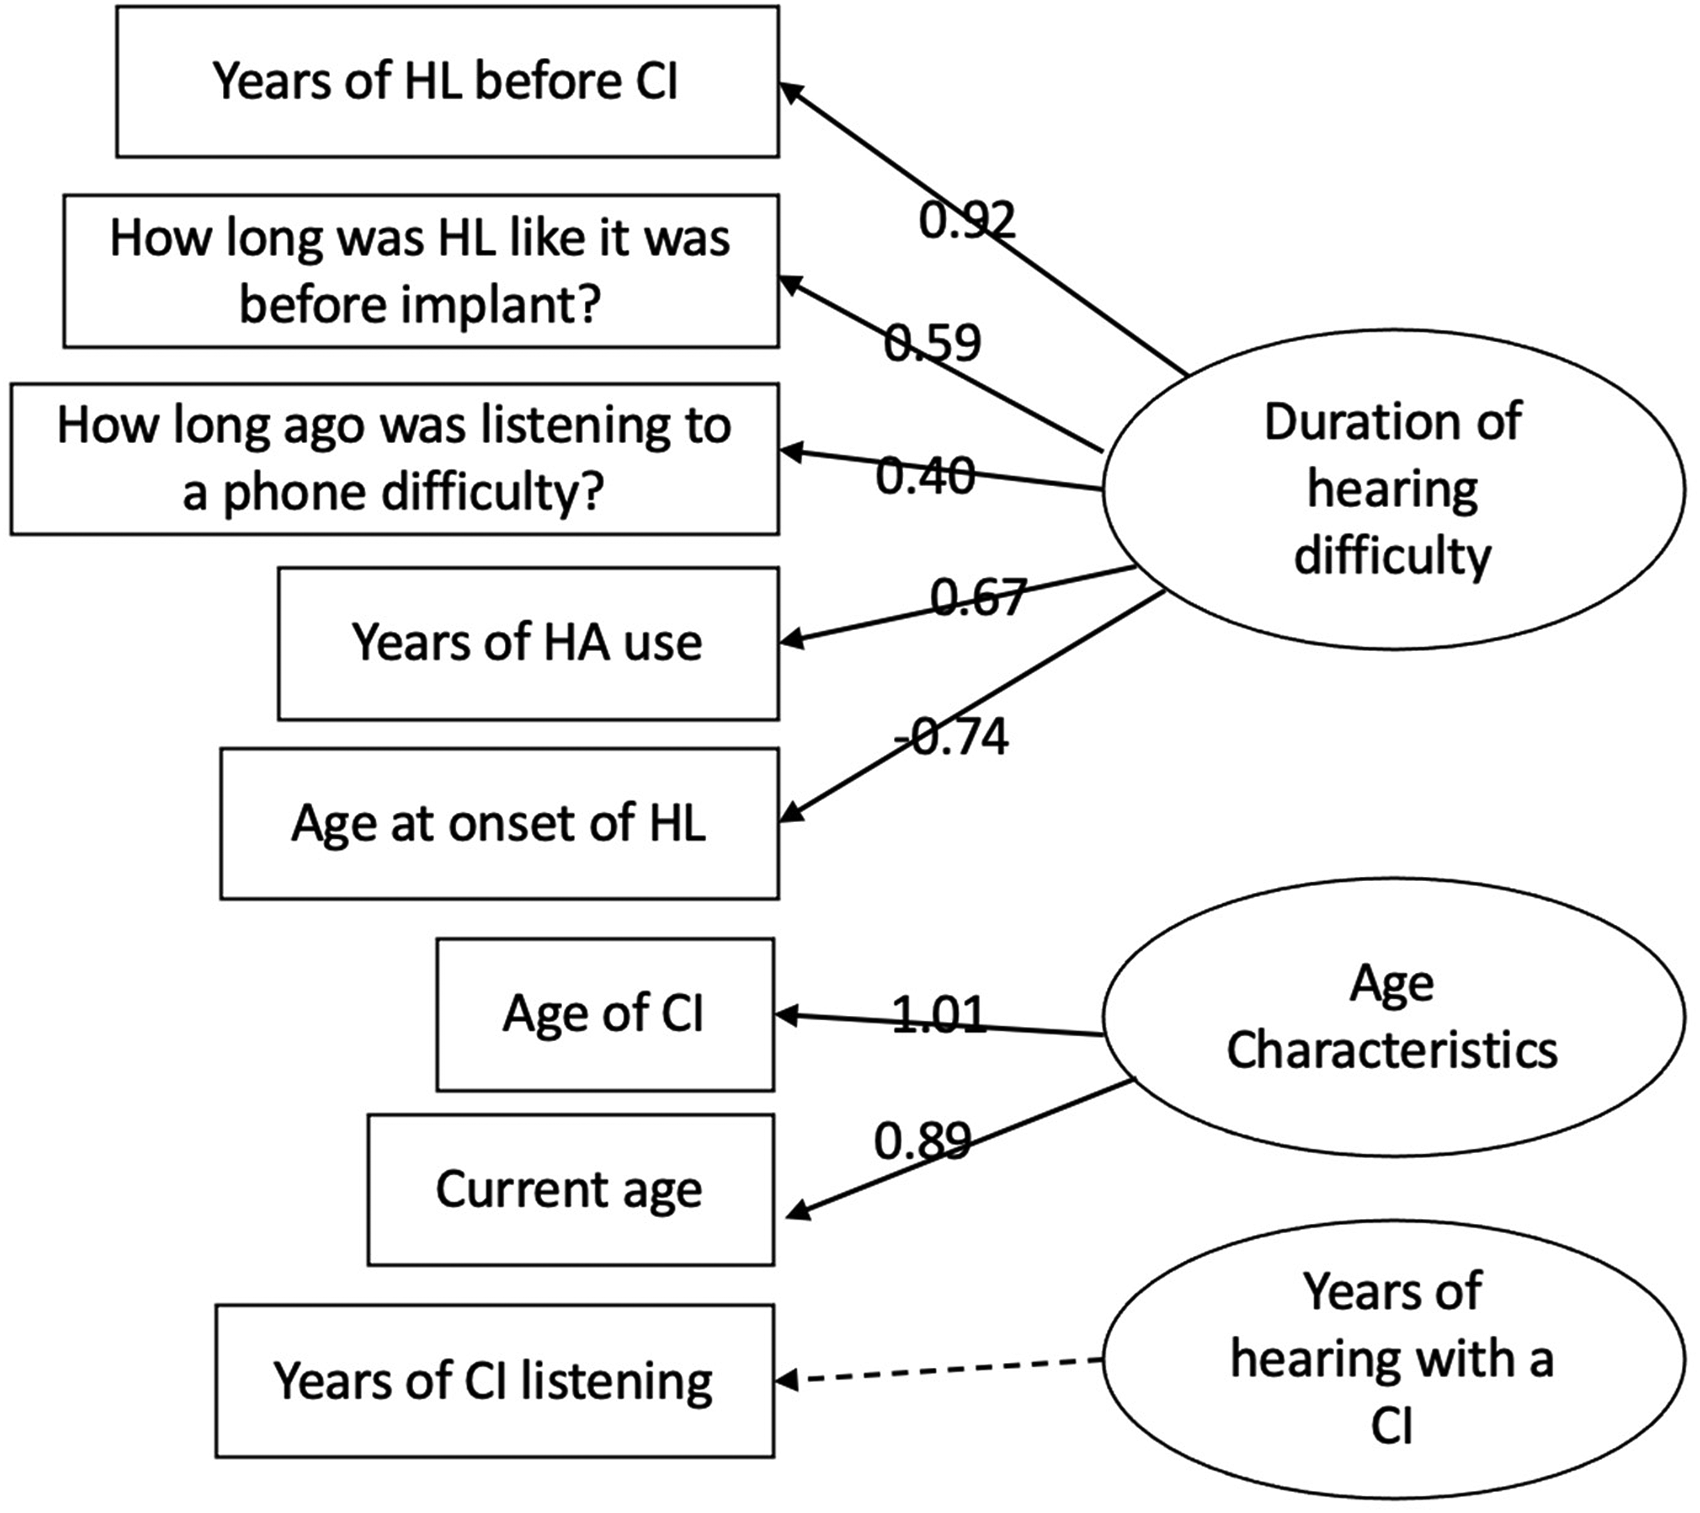
Factor loadings for hearing-related variables. HL = hearing loss, CI = cochlear implant, HA = hearing aid.

Boxplots of scores for each chord contrast. The horizontal lines represent the median, and the boxes represent the range between the 25th and 75th quartiles. The whiskers show the minimum and maximum scores, excluding outliers, which are represented by dots. st = semitones.

Scores averaged for each chord type (expanded versus reduced). Box description as for Figure 2.

Results for listening modality. Box description as for figure 2.
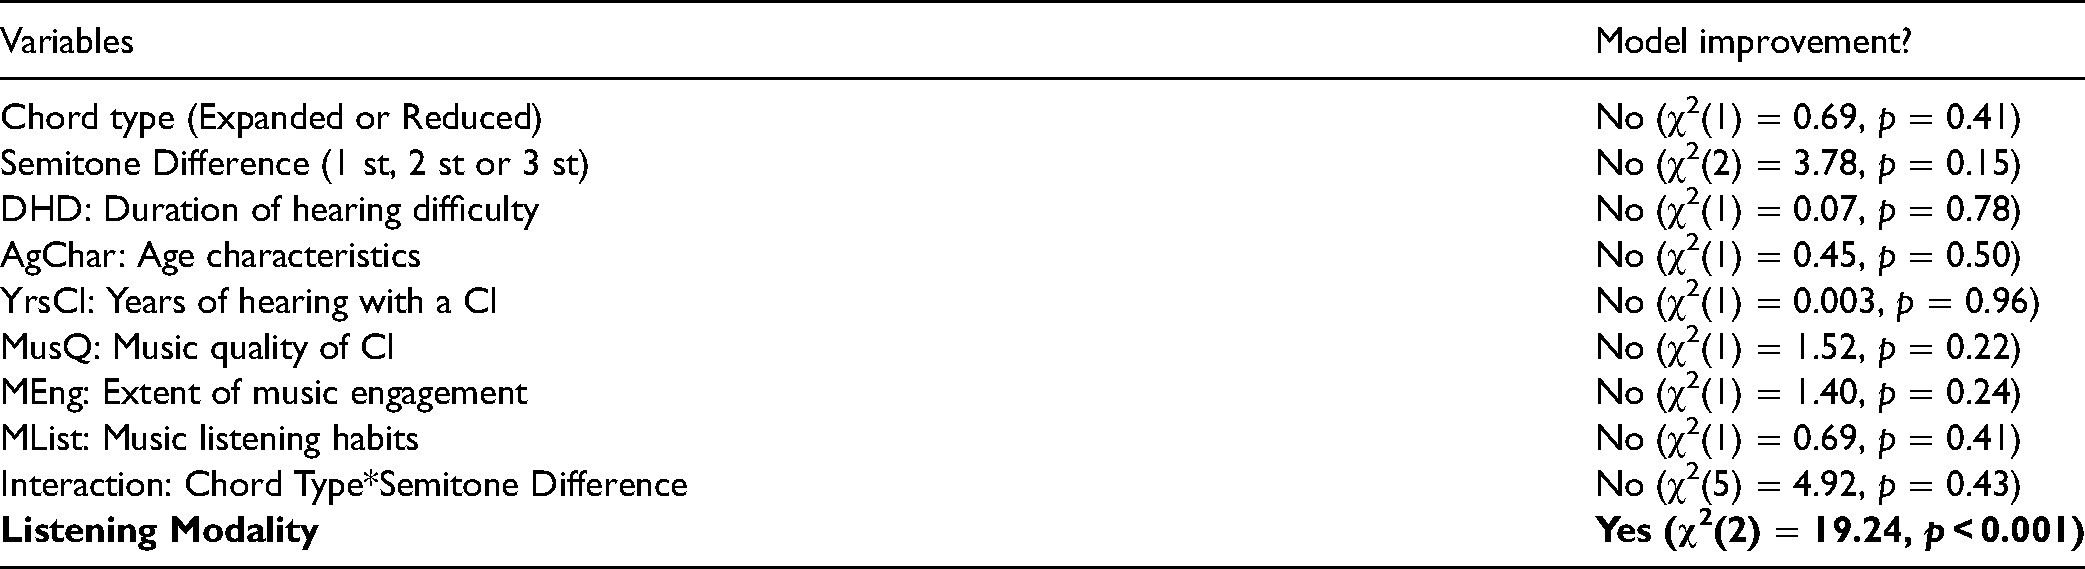
The scores were analysed by fitting a GLMM. The fixed effects were semitone difference (one, two, or three), chord type (reduced vs expanded), hearing-related variables (DHD, AgChar, YrsCI), music-related variables (MusQ, MEng and MList), and listening modality (bluetooth, headphones, loudspeakers). Participants were included as random effects. The full factorial model in lme4 syntax was Correct.Incorrect ∼ Chord.Type + Semitones + Listening.Modality + Chord.Type:Semitones + AgChar: YrsCI + (1|participant). Table 8 shows whether or not the inclusion of each model variable improved the fit of the model. Variables that did not significantly improve the fit were not included in the final model.
χ2 Values and p Values for all Fixed-Effect Variables Based on the GLMM for Chord-Discrimination Accuracy. Variables giving a Significant Improvement in the Fit of the Model are Indicated in Bold Font. st = Semitones

As expected, there was a significant effect of semitone difference, performance improving with increasing difference. The inclusion of “Chord type” (expanded vs reduced) significantly improved the model's fit, performance being better for reduced chord changes. The interaction of Chord type and semitone difference significantly improved the fit of the model. The interaction was driven by improved discrimination with larger semitone differences for reduced chords (estimate = −0.39, SE = 0.18, z = −2.18, p = 0.03).
It was expected that larger values of DHD would be associated with lower accuracy scores, but in fact the inclusion of DHD did not improve the fit of the model. Similarly, AgChar and YrsCI failed to improve the fit of the model. Also contrary to our expectations, MusQ, MEng, and MList did not significantly improve the fit of the model.
Adding listening modality as a fixed effect improved the fit of the model; the use of loudspeakers or headphones was associated with better performance than using Bluetooth streaming.
Two-way interactions between the hearing- and music-related variables were also assessed. The only interaction that significantly improved the fit of the model was AgChar and YrsCI: χ2(3) = 16.55, p < 0.001; estimate = 0.02, SE = 0.0006, z = 3.77, p < 0.001. Accuracy did not change with AgChar overall, but as YrsCI increased, accuracy tended to increase with increasing AgChar.
Table 9 shows the odd ratios, 95% confidence intervals (CI), and p values for the final model. The variables were dummy-coded such that the intercept shows the likelihood of a correct response when all the predictors were set to their reference value (chord type = expanded, difference = 1 semitone, listening modality = Bluetooth streaming, AgChar = 10.33, YrsCI = 1). The intercept was 0.88 (SE = 0.60, p = 0.64, odds ratio = 0.88). This means that participants were 0.88 times more likely to give an incorrect response than a correct response when all variables were at their reference values.
Outcomes of the Final Model for Accuracy in the Chord-Discrimination Task. The Table was Generated using the Package sjPlot (Lüdecke, 2021). Significant p Values are Indicated in Bold Font. σ2 is the Variance, τ00 Subject is the Between-Subject Variance, ICC is Intraclass-Correlation Coefficient (a Measure of Reliability), Nsubject is the Number of Subjects, Marginal R2 is the Variance Explained by only the Fixed Effects and Conditional R2 is the Variance Explained by the Entire Model. St = Semitone
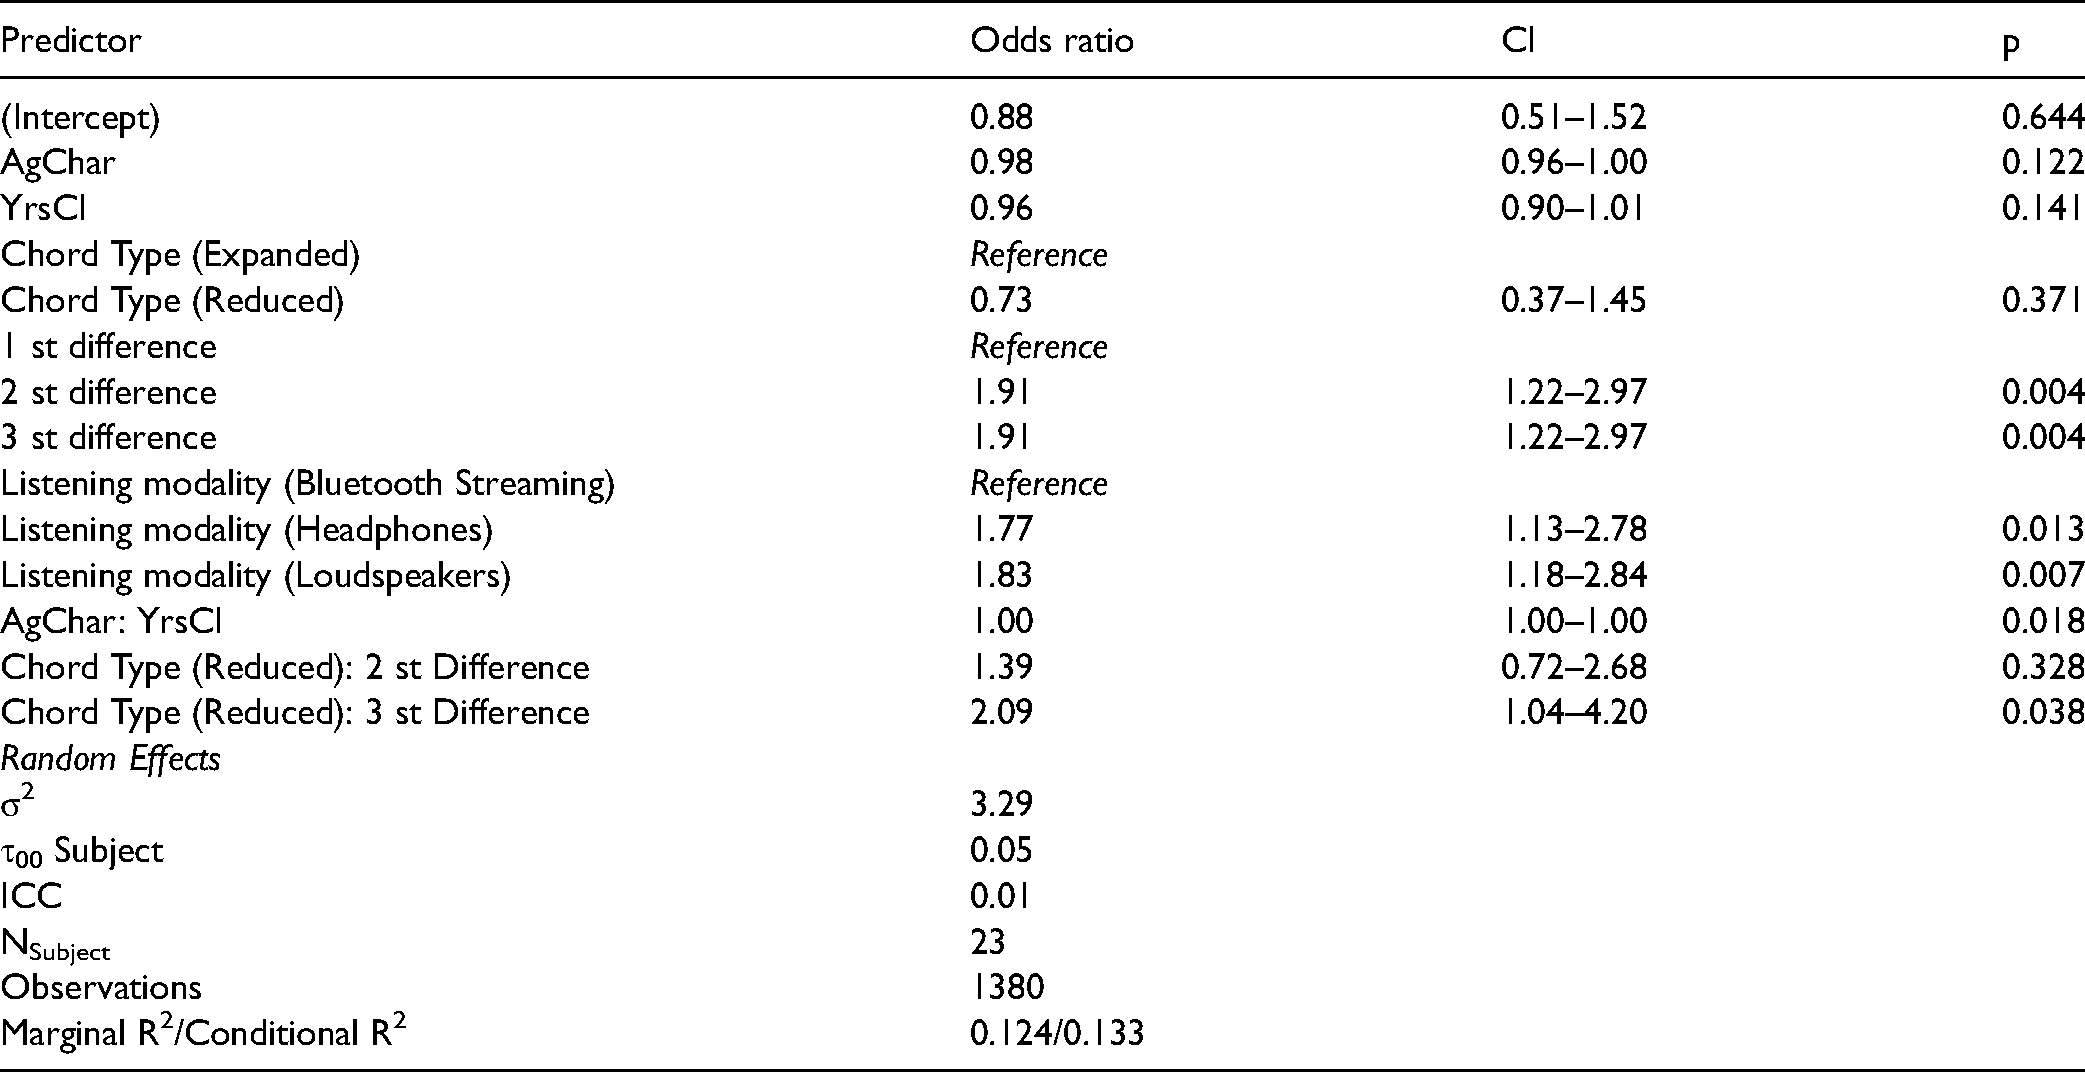
The use of headphones and loudspeakers significantly affected the odds of giving a correct response relative to the use of Bluetooth streaming, with loudspeaker users 1.61 and headphone users 1.56 times more likely to give a correct response. The use of the reduced chord type alone did not significantly affect the odds of a correct response relative to that for the expanded chord type. However, the use of a 2 or 3 semitone difference significantly increased the odds of a correct response relative to use of a 1 semitone difference, by 1.91 times for both semitone differences, hence making a correct response 1.68 times more likely than an incorrect response. The interaction between chord type and semitone difference reflects the finding that using a reduced chord type along with a 3-semitone difference significantly increased the odds of a correct response by 2.09 times, compared to the reference level, hence making a correct response 1.84 times more likely than an incorrect response.
AgChar and YrsCI did not significantly affect the odds of a correct response. However, the interaction between these two variables was significant. As shown in Figure 5, the effects of YrsCI were small when AgChar scores were low, but with greater AgChar, the effects of greater YrsCI became more obvious. Participants with greater AgChar had more correct responses when they had greater YrsCI.
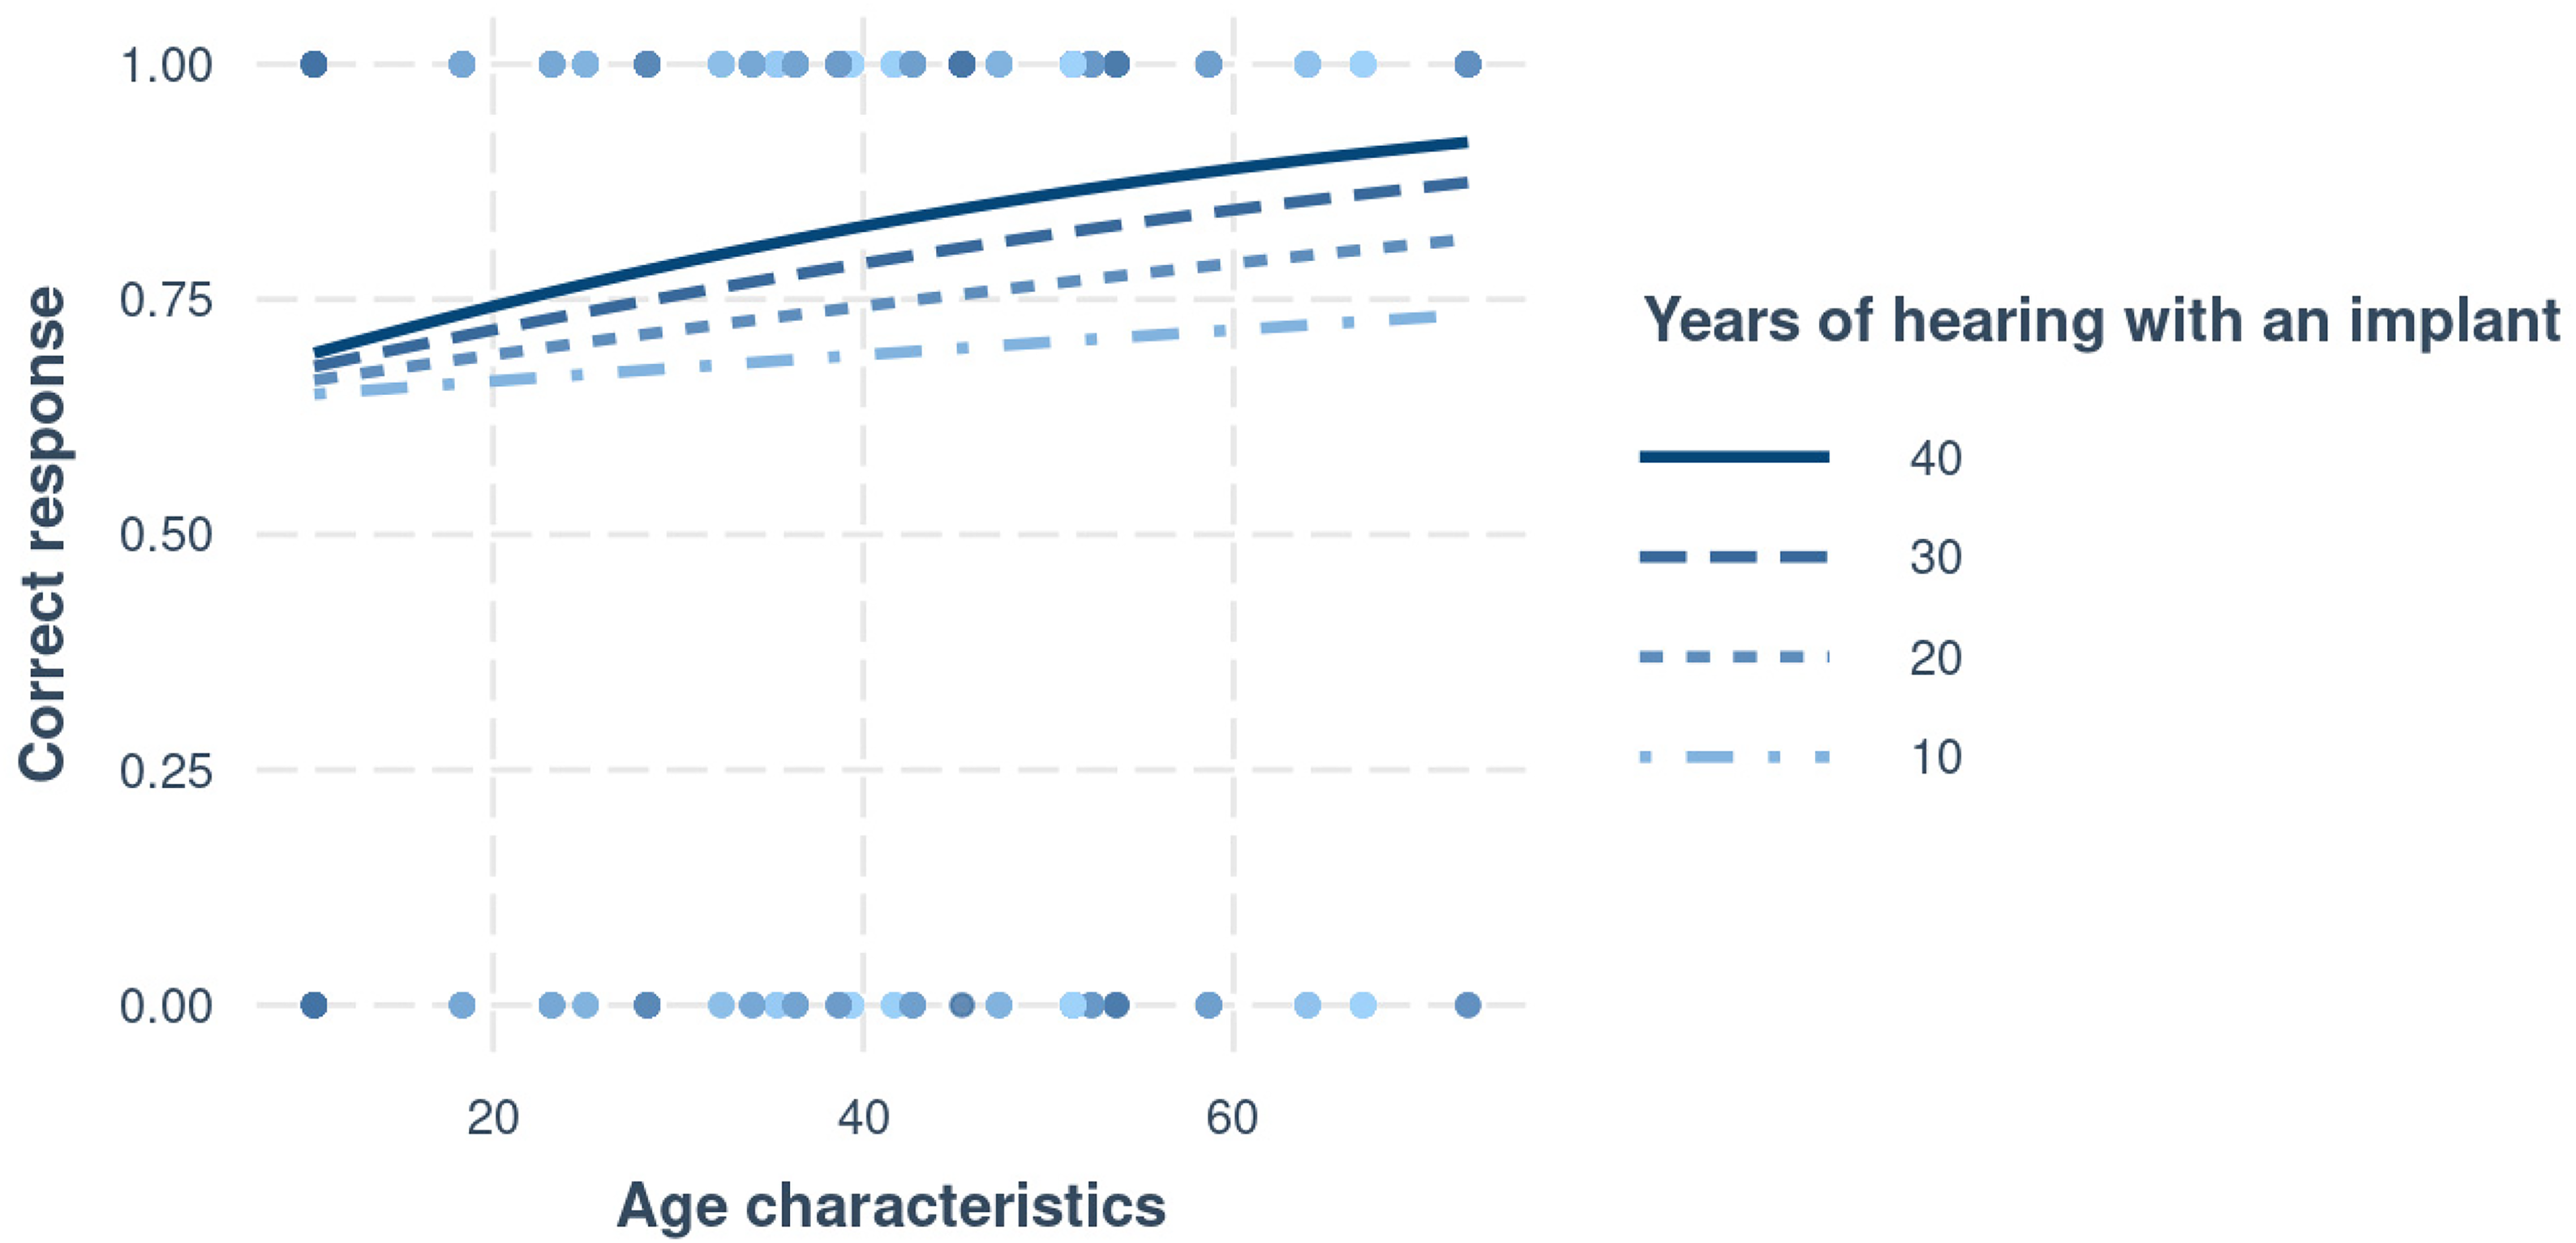
Interaction between AgChar and YrsCI based on correct and incorrect responses in the chord discrimination task.
Reaction Time in Chord-Discrimination Task
A GLMM was fitted incorporating trial-by-trial reaction times as the outcome variable. Semitone difference (one, two, three), chord type (reduced vs expanded), hearing-related variables (DHD, AgChar, and YrsCI), and music-related variables (MusQ, MEng, and MList) were used as fixed effects to determine their association with reaction time. The full factorial model in lme4 syntax was Reactiontime ∼ Listening.Modality + (1|participant).
Table 10 shows the χ2 values and p values that were used for comparing models. Contrary to the expectation that larger semitone differences would result in quicker responses, “Semitone difference” did not significantly improve the fit of the model. The effect of “Chord type” was also not significant. Adding the interaction between “Chord type” and “Semitone difference” also did not improve the fit of the model. This lack of effect may reflect the fact that participants were not instructed to respond as quickly as possible.
χ2 Values and p Values for all Variables Included as Fixed Effects in the Linear Mixed Effects Model for Reaction Time. st = Semitone
None of the hearing-related or music-related variables significantly improved the fit of the model and there were no significant interactions between any of these variables.
The only variable that was included in the final model was listening modality, which significantly improved the fit of the model. Table 11 shows the coefficient estimates, 95% CIs, and p values for the final model for reaction time. The intercept shows the likelihood of the reaction time when all the predictors were set to their reference value (listening modality = Bluetooth). The intercept was 8222 ms (SE = 190, p = <0.001). Participants reacted significantly more quickly when using headphones (estimate = -956 ms, SE = 190, CI = -1331 to −581, p = <0.001) and loudspeakers (estimate = -609 ms, SE = 167, CI = -939 to −280, p = <0.001), than when using Bluetooth. This can probably be partly, but not entirely, explained by the inherent time delay in wireless Bluetooth transmission, which can be as high as 300 ms.
Outcomes of the Final Model for Reaction Times

Relationship of Hearing- and Music-Related Variables to Music Enjoyment
Music enjoyment scores before and after receiving a CI, on a scale from 0 to 10, were also analyzed with a GLMM. Each participant's music enjoyment scores were included in the GLMM as the dependent variable.
As illustrated in Figure 6, music enjoyment scores were significantly higher after receiving a CI than before. Therefore, the effect of time-point (pre/post implantation) as well as hearing- (DHD, AgChar and YrsCI) and music-related (MusQ, MEng, and MList) variables were included in the LMM as fixed effects, along with participants as random effects, to examine the factors influencing music enjoyment. Hypothesis-driven interactions were also added to the LMM, such as interactions between the hearing- and music-related variables. The full factorial model in lme4 syntax was MusicEnjoyment ∼ Time-point + DHD:MusQ + (1|participant). The outcomes are shown in Table 12.
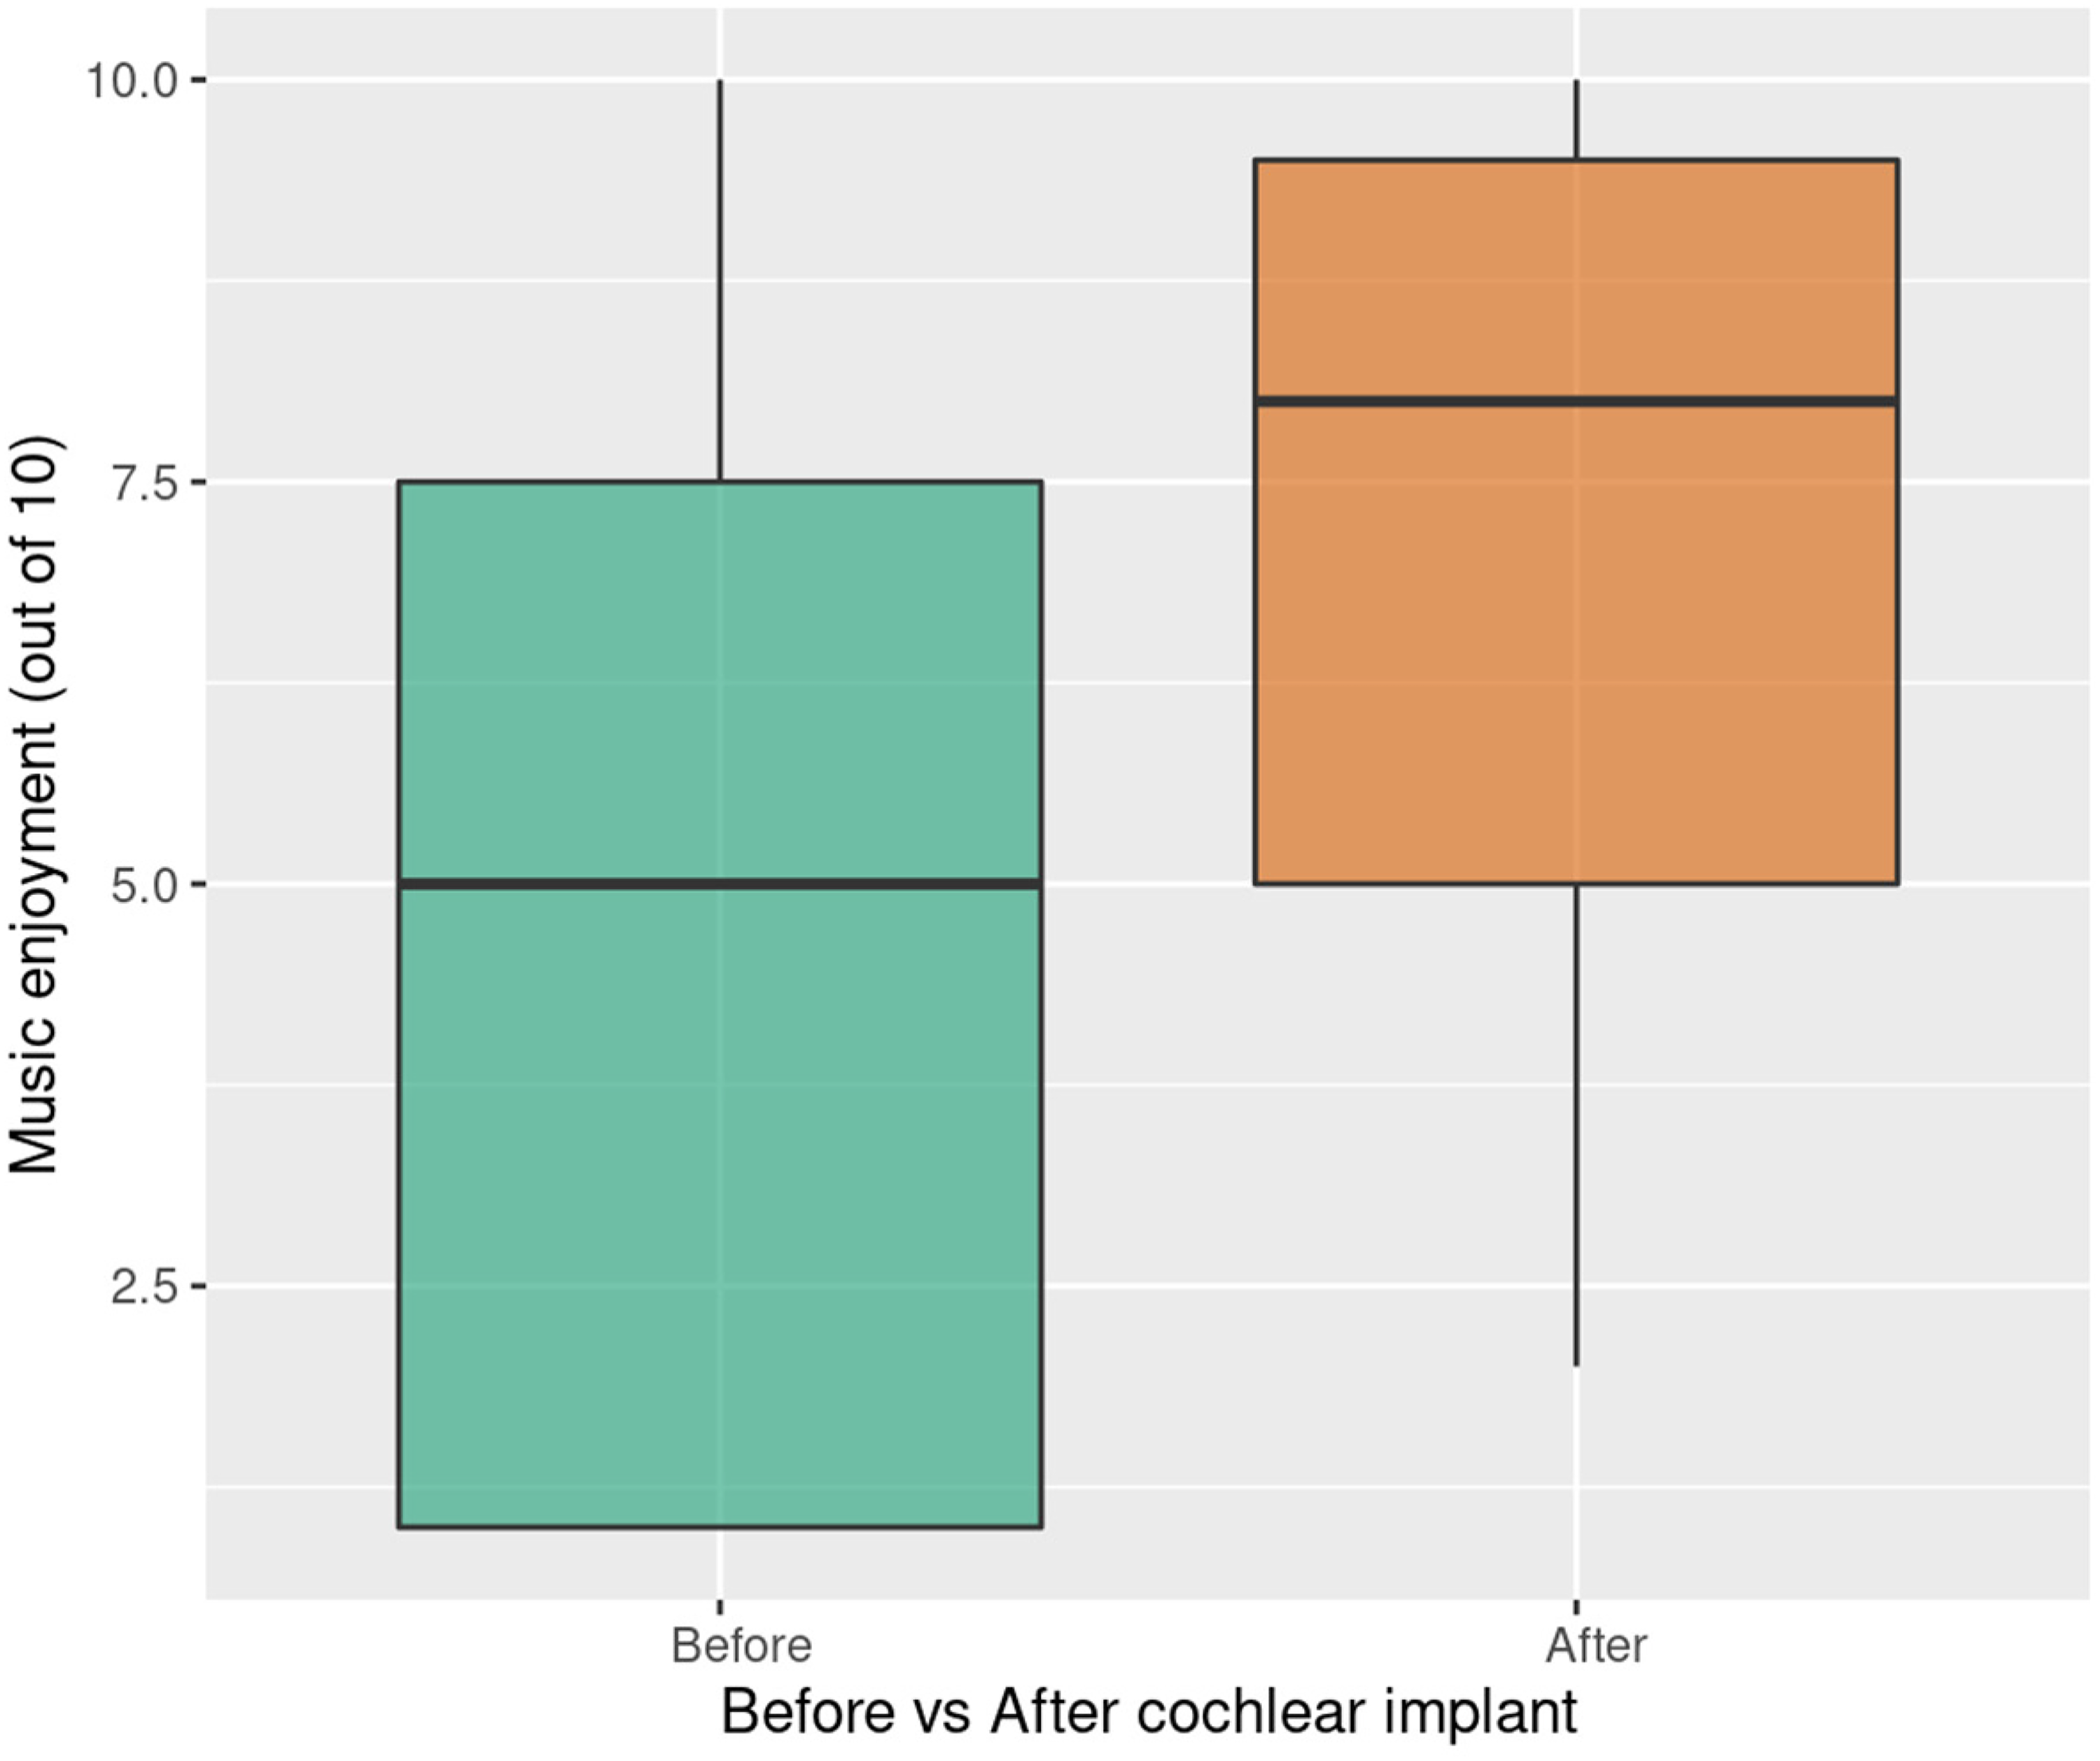
Boxplot showing music enjoyment scores before receiving a CI and after receiving a CI. Box description as for Figure 2.
χ2 Values and p Values for All Variables Included as Fixed Effects in the Linear Mixed Effects Model for Music Enjoyment Scores
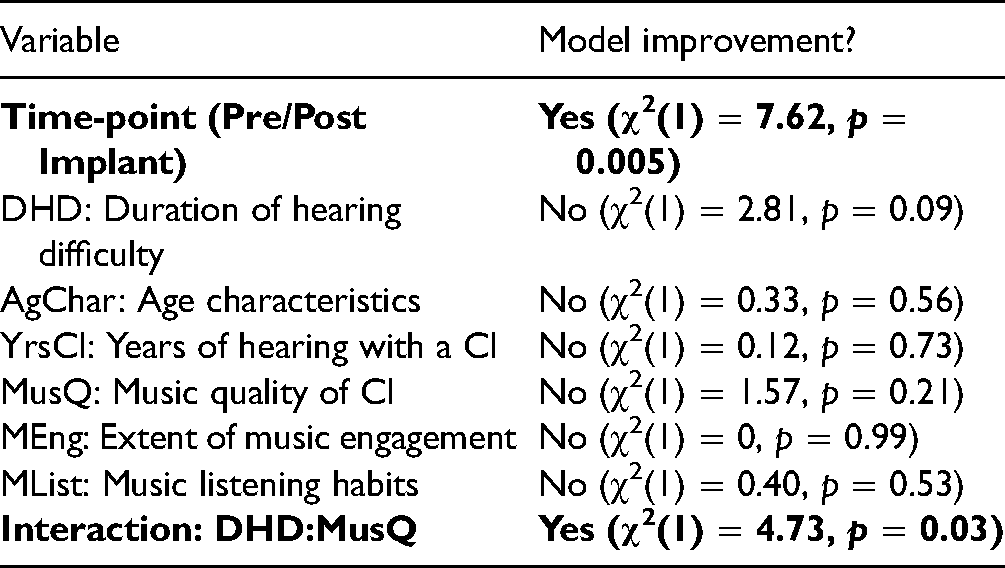
Table 13 shows the coefficients, 95% CIs, and p values for the final model. The intercept shows the mean music enjoyment score when all the predictors were set to their reference values (time-point = before implant, DHD = 5, MusQ = 1.8). The intercept was 3.02 (SE = 0.75, p = 0.006). Music enjoyment scores significantly improved post implant (estimate = 2.22, SE = 0.75, CI = 0.69–3.74, p = 0.005).
Outcomes of the Final Model for Music Enjoyment Scores

None of the hearing-related or music-related variables improved the fit of the model. However, inclusion of the interaction between DHD and MusQ did improve the fit of the model (estimate = 0.01, CI = 0.00–0.02, p = 0.034). As shown in Figure 7, the effects of DHD were small when MusQ scores were low, but with higher music quality, the effects of DHD became larger, such that longer duration of hearing difficulty was associated with higher music enjoyment scores.

Plot illustrating the interaction between DHD and MusQ in their influence on music enjoyment scores.
Discussion
The EFA findings suggested that the independent variables clustered into five LVs and one direct variable. The LVs were duration of hearing difficulty, age characteristics, music quality from the CI, extent of music engagement, and music listening habits, and the direct variable was years of hearing with an implant. Similar variables have previously been identified as important predictors of speech perception and of non-speech music-related skills. For example, duration of profound deafness and age at implantation have both been shown to have a negative relationship with post-implant auditory speech perception (Blamey et al., 2013) and pitch perception and auditory stream segregation (Oxenham, 2008). Similarly, the duration of implant listening has been found to be positively related to speech perception, frequency discrimination, and timbre identification (Lenarz et al., 2012; Ahn et al., 2019). A number of music-related factors have been identified as associated with music-related skills. Looi et al. (2011) showed that music quality with a CI was positively correlated with frequency discrimination, sharpness perception, and spectral-slope discrimination of complex tones. Also, listening to music more frequently can improve melody recognition and discrimination of spectral shape (Gfeller et al., 2019; Galvin et al., 2009).
For the chord-discrimination task, scores were higher when the second note (out of three) was lowered than when the third note was raised. In addition, scores improved as the semitone difference increased. These effects could reflect the use of temporal envelope cues (a form of beats), which would be more salient when the F0 s of the constituent tones were close together and the beat rate was low (Fastl, 1983; Lee, 1994). When the second note was lowered by three semitones, the difference in F0 s of the two lower tones in the chord decreased from 68 Hz for the reference tone to 15 Hz for the reduced chord (see Table 2). This change in F0 difference by more than a factor of four would lead to an easily discriminable change in beat rate for CI users (Kreft et al., 2010). When the F0 of the third note was increased, the difference in F0 s of the two upper tones increased from 62 to 136 Hz, a change of about a factor of two that would be less easily discriminated. It seems likely that performance for the reduced chords depended primarily on the ability to detect beats and discriminate changes in beat rate. In addition, when discriminating chords with the third note raised, the highest note could have activated another electrode within the CI for the larger F0 changes, hence making the change in chord more discriminable. The ability to discriminate beats is likely to play a strong role in both speech and music perception for people listening with CIs, given that CIs mainly provide information about temporal envelope fluctuations in different frequency regions (Spitzer et al., 2019).
The interaction between AgChar and YrsCI showed that individuals with older age characteristics scores and who had a greater number of years of hearing experience with a CI performed better in the chord-discrimination task. Longer experience of hearing with a CI might be associated with improved auditory discrimination abilities due to experience-related changes in auditory-cortex function post-implant (Giraud et al., 2001).
Apart from the interaction between age characteristics and years of hearing with a CI, there were no main effects or interactions that affected performance in the chord-discrimination task. In the literature, some authors have found that longer durations of severe-to-profound hearing loss were linked to both neurodegeneration and neuroplasticity (Blamey et al., 2013; Vanderauwera et al., 2020). Research on perceptual correlates of these effects has predominantly been focused on speech perception and cognitive function (Martini et al., 2014). It was hypothesized in the present research that duration of severe-to-profound hearing loss would also be related to music listening skills and enjoyment. However, effects of the duration of deafness on chord-discrimination accuracy were not observed. This could be due to the fact that the range of durations of severe-to-profound hearing loss was relatively small for our participants. It was also expected that degree of musical engagement and music-listening habits would significantly affect performance in the chord-discrimination task, since it has been shown that musical training (Chen et al., 2010; Vandali et al., 2005) or months of listening exercises (Gfeller et al., 2019; Galvin et al., 2009) can improve discrimination abilities in music listening. No such effect was found in this study, perhaps because performance of the chord-discrimination task depended on beat detection and discrimination, while the tasks used by other researchers involved the discrimination of frequency (Chen et al., 2010), sung vowel stimuli (Vandali et al., 2005), or melodic stimuli (Galvin et al., 2009).
It was hypothesized that the judged music quality of the CI, MusQ, would be associated with better chord discrimination, as MusQ might reflect both the quality of signal processing in the CI and the processing capacity of the auditory system of the CI user. However, no such association was found.
It was also expected that “Depth of musical engagement,” MEng, would be associated with better chord discrimination, because of the widely observed effects of musical training and experience on auditory abilities, especially pitch-related abilities (Musacchia et al., 2007; Wong et al., 2007). However, a relationship between MEng and chord discrimination was not observed, perhaps because performance of the chord-discrimination task depended on the use of beat cues, and the effect of musical training on the ability to use beat cues is small (Grassi et al., 2017).
Chord discrimination was better for loudspeaker and headphone presentation than for Bluetooth streaming. Eleven participants used loudspeakers and of these there were four bilateral users who may have used stereo loudspeakers to increase the benefit of binaural hearing (although the present stimuli would have been the same for the two channels). Of the six participants who used headphones, half were bilateral users. All of the CI users who used Bluetooth streaming were unilateral CI users. Hence, the relatively poor performance of the Bluetooth users might reflect the fact that they were also unilateral CI users and may be disadvantaged when compared to CI users with residual hearing using loudspeaker and headphone presentation. However, the poor performance with Bluetooth might also be related to distortions produced by Bluetooth transmission. Bluetooth devices generally work only over a limited distance between transmitter and receiver and physical barriers and overlapping radio frequencies can lead to drop outs and distortion. Bluetooth systems in CIs also use a variety of audio codecs and bit rates, and low bit rates may lead to artifacts and distortions of the transmitted sounds (Qian et al., 2003). In addition, to save power, Bluetooth systems often power down when no signal is being received. When the signal is turned back on, it can take about 100 ms for the system to power back up, with the result that the first part of the signal is lost. For our chord-discrimination task, this might have resulted in the first part of the first stimulus in each trial being lost. Further research is needed to determine whether the distortion associated with Bluetooth transmission has deleterious effects on music perception.
Reaction time was measured for the chord-discrimination task in an attempt to capture the effects of listening effort, although participants were not instructed to respond as quickly as possible. Participants reacted significantly more quickly when using headphones and loudspeakers than when using Bluetooth streaming. This most likely reflects the delays or powering down that occur in Bluetooth streaming, although it might also reflect the distortions produced by Bluetooth transmission or the fact that the participants who used Bluetooth were also unilateral CI users. The delays inherent to Bluetooth streaming could introduce noticeable audio-visual asynchrony, for example, when receiving a video call with the audio streamed to the CI or when watching a video recording of a musical concert with the audio streamed.
Music enjoyment is a functional measure of music experience, which can affect the quality of life of CI users (Gfeller et al., 2003; Dritsakis et al., 2017). The present results showed that there was a significant improvement in music enjoyment from pre-CI to post-CI. This is consistent with other studies (Bruns et al., 2016; Feldmann and Kumpf, 1988; Mirza et al., 2003). This presumably means that the information provided by the CIs was sufficient to allow better music perception than with acoustic hearing prior to the implantation, and that the benefit of the CIs occurred despite the likelihood that implantation led to some loss of residual hearing (Quesnel et al., 2016). Poor music perception abilities (as experienced pre-implant) might impair music enjoyment, and partially restoring hearing abilities through a CI may lead to better music enjoyment, as observed in several studies of music enjoyment for CI users (Bruns et al., 2016; Feldmann and Kumpf, 1988; Mirza et al., 2003). However, some researchers have explored changes in listening habits from before experiencing a hearing loss to after receipt of a CI and found that music enjoyment scores after receiving a CI were lower than prior to having a hearing loss (Prevoteau et al., 2018; Kohlberg et al., 2014; Migirov et al., 2009). This clearly indicates that while CIs allow some degree of enjoyment of music, the music-listening experience is not as good as that with normal hearing.
None of the effects of the hearing- and music-related variables reached statistical significance as main effects with respect to music enjoyment outcomes. However, out of the theoretically driven interactions between hearing- and music-related variables, the interaction between “Duration of hearing difficulty” and “Music quality of CI” was significantly related to music enjoyment scores. Better music quality of the CI was associated with higher music enjoyment for those with a longer duration of hearing difficulty. The effect could be due to people with a longer duration of hearing difficulty experiencing greater improvements in music quality when fitted with a CI and hence enjoying music more.
Our results suggest that some pre-implant hearing and music experiences have effects on how CI users perceive and enjoy music after receiving a CI and that the pattern of these effects may be different to what is observed for speech perception. In the future, the cues that CI users use to discriminate chords, and how these cues relate to other aspects of music discrimination performance and music enjoyment will be explored. More sophisticated demographics will be explored with the Goldsmiths Musical Sophistication Index (Gold-MSI) to identify more specific factors that might lead to enhanced music enjoyment (Müllensiefen et al., 2014). Identifying the cues, sophisticated demographics and specific features of music that improve music enjoyment will hopefully contribute to further advances in CI processing strategies or CI hardware that could enhance music perception and enjoyment for CI users. Knowledge of these pre-implant hearing experiences and music experiences can also be incorporated into clinical approaches to improve music engagement for CI users.
Limitations
Some limitations of this study should be noted. The self-selected sample might have been made up of individuals who had a particular interest in music and who felt confident in trying online listening tasks. There were only 25 participants, which limits the extent to which the effects can be generalized to the CI population as a whole. With regard to the EFA, the Kaiser-Meyer Olkin test indicated that the MSA was low. For studies using EFA, a minimum of 10–15 participants for each item is generally considered as necessary to give reliable factor weightings and to get a good estimate of population values (Mundfrom et al., 2005; MacCallum et al., 1999). However, this is debated, and approximately 15% of studies suggest that a smaller sample size could be sufficient (Sapnas and Zeller, 2002; Pearson and Mundform, 2010) if the data are well conditioned (i.e., high factor loads and few variables). Using EFA on a small sample can sometimes reveal informative latent patterns if the factors are well defined (Winter et al., 2009). Currently, strict guidelines do not exist, but it is recommended that the MSA analysis should be accompanied by Barlett's test of sphericity (Chan and Idris, 2017), which, if significant, as in our case, suggests that the dataset is appropriate for data-reduction techniques. In addition, the findings from the EFA make sense from a theoretical perspective.
There are multiple validated questionnaires for exploring music experiences with CIs (Dritsakis et al., 2017; Geurts and Wouters, 2000; Looi and She, 2010). The MUMU was chosen for this study as its content was most appropriate for our research questions. However, there are some limitations with the MUMU. First, the MUMU does not give a single overall score or even domain scores, as there are qualitatively different types of items, such as rating scales, multiple choice, and free text. Second, asking participants to remember their perception of sound quality and music enjoyment prior to implantation could lead to recall bias, due to the time lapse. Despite these limitations, the MUMU is the only questionnaire with a comprehensive focus on everyday music listening practices and music enjoyment for CI users.
This study did not capture pre-implant variables such as degree of hearing loss, the presence/absence of dead regions, and speech-perception abilities. Also, the current degree of residual hearing was not assessed, because of the difficulty of obtaining this information via an online platform only.
Conclusions
Participants’ engagement with music before and after receiving a CI was assessed with the MUMU questionnaire and by measuring performance on a chord-discrimination task. Accuracy in the chord-discrimination task was affected by listening modality: performance was better using loudspeakers and headphones than using Bluetooth streaming. Greater age was associated with better chord discrimination when combined with a greater number of years of hearing with a CI. There was an interaction between chord type (expanded vs reduced) and semitone difference (larger differences leading to better performance). The pattern of results was consistent with the idea that the CI users discriminated the chords using amplitude fluctuations (beats) produced as a result of temporal interaction between notes. Other than listening modality, none of the variables affected reaction time in the chord-discrimination task.
Pre-implant hearing- and music-related experiences of CI users were found to be related to post-implant music discrimination and enjoyment. Music enjoyment, as measured by self-reported scores before and after receiving a CI, was predicted by the interaction between duration of hearing difficulty and music quality of the CI: longer duration of hearing difficulty was associated with higher music enjoyment scores as music quality with the CI increased. Depth of musical engagement and music listening habits were not related to chord-discrimination or music enjoyment.
In summary, hearing-related factors that have been previously reported to be related to speech understanding, such as age at implantation, duration of deafness and number of years listening with a CI were found here to be related to chord discrimination and music enjoyment, but the relationship did not necessarily follow the same pattern as for speech perception.
Supplemental Material
sj-docx-1-tia-10.1177_23312165221143902 - Supplemental material for The Relationship Between Hearing Experiences, Music-Listening Behaviors, and Chord-Discrimination Abilities for Cochlear Implant Users
Supplemental material, sj-docx-1-tia-10.1177_23312165221143902 for The Relationship Between Hearing Experiences, Music-Listening Behaviors, and Chord-Discrimination Abilities for Cochlear Implant Users by Cynthia Lam, Brian C. J. Moore, Marina Salorio-Corbetto and Deborah A. Vickers in Trends in Hearing
Footnotes
Declaration of Conflicting Interests
The author(s) declared no potential conflicts of interest with respect to the research, authorship, and/or publication of this article.
Funding
The author(s) received no financial support for the research, authorship, and/or publication of this article.
Supplemental Material
Supplemental material for this article is available online.
References
Supplementary Material
Please find the following supplemental material available below.
For Open Access articles published under a Creative Commons License, all supplemental material carries the same license as the article it is associated with.
For non-Open Access articles published, all supplemental material carries a non-exclusive license, and permission requests for re-use of supplemental material or any part of supplemental material shall be sent directly to the copyright owner as specified in the copyright notice associated with the article.