
Abstract
Listening to speech in noisy environments is challenging and effortful. Factors like the signal-to-noise ratio (SNR), the spatial separation between target speech and noise interferer(s), and possibly also the listener's age might influence perceived listening effort (LE). This study measured and modeled the effect of the spatial separation of target speech and interfering stationary speech-shaped noise on the perceived LE and its relation to the age of the listeners. Reference ranges for the relationship between subjectively perceived LE and SNR for different noise azimuths were established. For this purpose, 70 listeners with normal hearing and from three age groups rated the perceived LE using the Adaptive Categorical Listening Effort Scaling method (ACALES, Krueger et al., 2017a) with speech from the front and noise from 0°, 90°, 135°, or 180° azimuth. Based on these data, the spatial release from listening effort (SRLE) was calculated. The noise azimuth had a strong effect on SRLE, with the highest release for 135°. The binaural speech intelligibility model (BSIM2020, Hauth et al., 2020) predicted SRLE very well at negative SNRs, but overestimated for positive SNRs. No significant effect of age was found on the respective subjective ratings. Therefore, the reference ranges were determined independently of age. These reference ranges can be used for the classification of LE measurements. However, when the increase of the perceived LE with SNR was analyzed, a significant age difference was found between the listeners of the youngest and oldest group when considering the upper range of the LE function.
Keywords
Introduction
Speech communication is an essential part of human society, and speech comprehension has the highest priority. In daily life, ambient sounds challenge communication. In everyday communication situations, the signal-to-noise ratio (SNR) ranges between 2 and 14 dB (Wu et al., 2018). Typically, in this SNR range, normal-hearing listeners score near 100% on standard sentence recognition tests (e.g., Kollmeier et al., 2015). Due to this saturation, differences in speech intelligibility (SI) are not detectable. Nevertheless, even if intelligibility is saturated, subjective listening effort (LE) differences can still be detected (Krueger et al., 2017b; Rennies et al., 2014; Rennies and Kidd, 2018; Sato et al., 2012; Schepker et al., 2016). In recent years, various methods for measuring LE have been proposed (review by Ohlenforst et al., 2017b), including subjective methods, e.g., questionnaires and scales (e.g., Gatehouse & Noble, 2004; Krueger et al., 2017a, b; Rennies and Kidd, 2018). Neurophysiological methods such as electroencephalographic (EEG) responses (Obleser et al., 2012; Miles et al., 2017) and pupil dilation (e.g., Ohlenforst et al., 2017a; Koelewijn et al., 2018), were also used to measure the objective LE. The use of dual-task approaches, where at least one task is listening to speech, allows conclusions about the cognitive load required by the listening task. A decreasing performance in the second task is assumed to be related to increasing LE (e.g., Picou et al., 2014; review from Gagne et al., 2017). A comparison of the subjective and objective measurement methods showed that LE is influenced by multiple factors (e.g., Pichora-Fuller et al. 2016; Peelle 2018) and that often only weak or non-significant correlations between the different measures can be observed (Alhanbali et al., 2019).
In situations in which several noise sources arrive from different directions, humans have difficulties, for instance, to communicate effortlessly or to orient themselves, and it is even more difficult when the different sound sources come from the same location (e.g., Rennies et al., 2019; Heeren et al., 2021). The listener has to distinguish between several sound sources, especially when a target speaker is masked by other speakers, and spatial release from masking (SRM) is an important factor. SRM for speech can be measured as the difference between the speech reception threshold (SRT) for 50% speech intelligibility for co-located target speaker and masker compared to the SRT with spatially separated target speaker and masker. In the following, we will call this SRMSI, to indicate that the SRM is measured using speech as the target signal. With the target speaker presented from the front (speech (S) from 0° azimuth, S0 condition), a release from masking can be achieved depending on the acoustic environment (e.g. reverberation) and on the azimuth of the masker, with a maximum of 12 dB at a noise (N) azimuth of 100° (S0N100 condition) in an anechoic room (e.g., Beutelmann and Brand, 2006; Beutelmann et al., 2010; Bronkhorst, 2000; Rennies and Kidd, 2018).
With respect to LE, only a few studies investigated the effect of the spatial separation of sound sources. Zekveld et al. (2014) measured the effect of spatial separation using pupil dilation and showed that the cognitive processing load is not reduced due to spatial separation. Besides the spatial separation between target speaker from the front and masker from +/- 90°, the gender of the masker was changed, either it was identical (female) to the target speaker or different (male). For both maskers, significantly lower SRTs were measured due to the spatial separation. In the peak dilation amplitude measured during speech test, however, no benefit was observed.
In contrast, using a dual-task approach for measuring the effect of spatial separation in a multi-talker condition, Xia et al. (2015) did observe a reduction of cognitive load. They also investigated the effect of spatial separation between target speaker from the front and competing talker from + /- 15° or + /-60°, as well as an effect of the gender of the competing talker. The reduction of cognitive load was greatest when target and interfering speakers were spatially separated and when the gender of the signals differed.
Rennies and Kidd (2018) measured the effect of spatial separation on SI and on perceived LE under anechoic and reverberant conditions. The corresponding speech intelligibility and the subjectively perceived listening effort were determined for fixed SNR values. Under anechoic conditions, the spatial separation of sources (frontal speech and noise from 135°, versus frontal speech and noise) reduced the SNR at which the perceived LE was rated as ”extreme” by up to 9 dB and by 2 dB for conditions rated with “no effort”. This means that the same effort was perceived at more negative SNR values when the noise was presented from 135° instead of from the front. Under reverberant conditions, the effect of spatial source separation on the perceived listening effort was only observed for high direct-to-reverberant ratios, but not under conditions with low direct-to-reverberant ratio.
In several studies, LE has been measured using young adults with normal hearing or older adults with impaired hearing (see the review by Gagne et al., 2017). In order to separate age effects from effects due to hearing impairment, the comparison of age groups within equal auditory profiles has received more and more attention. It is known that there are age-related changes in cognitive abilities, such as those needed for hearing, listening, comprehending, and communicating (e.g., Lemke & Besser, 2016; Pichora-Fuller et al., 2016; Kiessling et al., 2003). Several studies showed that older listeners are slower in processing speech, especially in acoustically challenging situations (Tun et al., 2009), which might reflect higher LE (Anderson Gosselin and Gagné, 2011; Larsby et al., 2005; Zekveld et al., 2011). In addition, older listeners achieve poorer results in primary or secondary tasks (e.g., greater reduction in recall accuracy (primary task) and tracking accuracy (secondary task) compared to young listeners, Tun et al., 2009), and show longer reaction times (Anderson Gosselin and Gagné, 2011; Zekveld et al., 2011).
To the best of our knowledge, subjective LE has not been investigated with respect to the age of normal-hearing listeners. In this study, we did this using the adaptive categorical listening effort scaling method (ACALES, Krueger et al., 2017a). In contrast to objective measurement methods and dual task paradigms, the listener rates the subjectively perceived LE. ACALES measures the individually perceived LE for different SNR ranges and adaptively calculates the next SNR presentation based on the participant responses. This allows for the determination of the individual SNR range without pre-testing and captures individual differences between listeners in the perception of LE virtually independent of the initial SNR.
Besides the actual measurement of perceived LE, models for predicting LE are becoming more and more important (e.g., Huber et al., 2018; Kranzusch et al., 2018). The relation between LE and SI (e.g., Krueger et al., 2017b; Rennies and Kidd, 2018; Schepker et al., 2016), as well as the effect of spatial source separation on SI (e.g., Beutelmann and Brand, 2006) has already been investigated in several research studies. Therefore, in this study an established model for predicting SI in binaural speech and noise conditions was used; the semi-blind binaural speech intelligibility model (BSIM2020, Hauth et al., 2020) is based on former non-blind versions of BSIM (Beutelmann and Brand, 2006; Beutelmann et al., 2010). Semi-blind means that the binaural front-end of the model, which predicts the SRM, is based only on the mixture of the target speech and the interfering noise. The back-end of BSIM2020, however, which predicts the speech intelligibility, requires auxiliary knowledge about the SNR. Therefore, BSIM2020 is not fully blind. For this study, the semi-blindness of BSIM2020 has an interesting impact, because the blind front-end predicts less SRM for positive SNRs than for negative SNRs. As LE is easily measurable at positive SNRs, this study is well suited for evaluating this model prediction. For this, the SII predicted by BSIM2020 was mapped to LE reference data from the S0N0 condition and the spatial release from listening effort (SRLE) predicted by adjusting the SNR so that BSIM2020 produces the same SII for the S0NX condition (with X denoting the azimuth of the noise) as for the S0N0 condition.
The main research questions of this study are:
(1) Do younger and older normal-hearing listeners differ in their ratings of LE in the same manner as in SI measures? As older listeners partly tend to require longer processing time for speech comprehension, it might be that they perceive and rate an increased LE. (2) Does the subjectively perceived LE benefit from spatial release from masking? The model that we use to predict the SI and LE data assumes that spatial release from masking takes place automatically, based on a modulation analysis of the input signals before the speech recognition process takes place. The hypothesis is that LE benefits from SRM in a similar way as SI. (3) Can BSIM2020 model LE and SRLE and does it predict the level dependency correctly?
To answer these questions, we measured the perceived LE using ACALES for speech from the front and noise from different azimuths. SI measurements were also performed to compare the age effect between LE and SI. We used listeners with normal hearing, aged between 18 and 80 years.
Methods
Speech Intelligibility Test
For the SI measurements in noise, the Oldenburg sentence test (OLSA) with a male speaker was used (Wagener et al., 1999a, b); this is a German version of the matrix sentence-test principle (Kollmeier et al., 2015). The sentences consist of five words with the predefined structure name – verb – numeral – adjective – object. Ten word alternatives exist for each word class. Overall, 120 syntactically correct, but semantically unpredictable sentences are available, which are compiled in 45 lists of 20 sentences or 40 lists of 30 sentences. Due to the missing semantical predictability, it is nearly impossible to learn whole sentences by heart, and thus it is no problem that sentences are repeated when presenting different test lists. However, a training consisting of two test lists with 20 sentences is required, so that the listeners become used to the pool of 50 words. After this training, stable SRTs are measured (Wagener et al., 1999b). In the experiments, the specific background noise of the OLSA, called Olnoise, was used, which was generated by 30 times superimposing the randomly time-shifted speech stimuli. This resulted in a quasi-stationary masker with a long-term spectrum corresponding to the average spectrum of the OLSA (for more details, see Wagener et al., 1999a).
To measure the individual speech recognition threshold (SRT; SNR where 50% of the words are understood correctly) and the slope of the intelligibility function, the standard method for this test was used, i.e., the masker was presented continuously at 65 dB SPL and the speech level was adjusted adaptively. For measuring both the SRT and the slope of the discrimination function concurrently, the “A2” method was used, in which two randomly interleaved tracks converge at 20% and 80% SI. A maximum-likelihood estimate was used to fit the intelligibility function to the data points (Brand and Kollmeier, 2002). The task of the listeners was to repeat all words they understood, and each correct word was scored. Thirty sentences were used for each interleaved track.
Rating of Listening Effort
For measuring subjective LE, the ACALES procedure was used (Krueger et al., 2017a) as follows: Listeners rated subjectively perceived LE when listening to speech (three consecutive sentences of OLSA) on a categorical rating scale, with seven labeled and six unlabeled intermediate categories from “no effort” to “extreme effort” (e.g., Luts et al., 2010) and the additional category “only noise”, when no speech was perceived. For the data analysis, numerical entities in Effort Scale Categorical Units (ESCU) were assigned to the categories (see Figure 1). These numbers were not shown to the listeners.

Categorical rating scale for listening effort in German (left) and in English (right) with the corresponding numerical Effort Scale Categorical Units (ESCU) shown between the scales.
After each presentation of three OLSA sentences, the listener rated the perceived LE. The total presentation time of three sentences lasted about 10 s. In previous studies, this period has been found to be suitable for listening to the sentences and answering the question “How much effort does it require for you to follow the speaker?” (“Wie anstrengend ist es für Sie, dem Sprecher zu folgen?” in German; Krueger et al., 2017a, b). After each presentation of three sentences, the listeners had six seconds to respond. If the listener did not respond within this time frame, the presentation started again with the same SNR. During this repetition, the listener was able to respond at any time, thereby terminating the current presentation. This served as a reinsurance, in case the listener was, for instance, inattentive or unsure.
To measure the individual SNR range from “no effort” to “extreme effort”, the ACALES procedure applied three measurement phases. In the first phase, SNRs for the ratings “no effort” and “extreme effort” were derived using adaptively changing SNRs in two interleaved search processes. Starting with an initial SNR of 0 dB (initial speech/noise level: 65 dB SPL), the SNR was increased by 3 dB until “no effort”, or decreased until “extreme effort” or ”only noise” was selected. In the second phase, seven SNRs were presented in random order. The SNRs were estimated using a linear interpolation between “no effort” and “extreme effort” and the SNRs correspond to the categories “no effort”, “very little effort”, “little effort”, “moderate effort”, ”considerable effort”, “much effort”, and “extreme effort”. In the third phase, the boundaries, as well as the SNRs, were re-estimated by linear regression and the SNRs corresponding to the estimated target LE values (noted above) were presented randomly. The third phase was performed twice. To avoid overly soft or overly loud levels for the speech signal, the limits of the presentation SNRs were set to −30 and 25 dB. Prior to the first measurement, a training phase was performed, which includes the evaluation of the SNRs for the ratings “no effort” and “extreme effort” (measurement phase 1), and was intended to demonstrate the procedure. The instruction of ACALES was only given in written form to the listeners, to avoid any influence of varying investigators (e.g., choice of words, style of language, type of explanation) on the measurement results.
Modelling of Listening Effort
The semi-blind Binaural Speech Intelligibility Model BSIM2020 (Hauth et al., 2020) was used to model LE. BSIM2020 consists of a blind binaural front-end and a non-blind back-end: The front-end analyses the mixed binaural speech and noise signal and calculates a monaural output with enhanced SNR. The back-end applies the Speech-Intelligibility-Index (SII, ANSI-S3.5–1997) for predicting SI and, in this study, also LE. In the following, the front-end and back-end are described in more detail. A comprehensive description can be found in Hauth et al. (2020):
The front-end uses the mixed binaural speech and masker signals as the input and divides them into 30 ERB-wide frequency bands using a gammatone filterbank (Hohmann, 2002). An equalization cancellation (EC) stage similar to Durlach (1963) processes frequency bands below 1500 Hz using two parallel optimization criteria: the interaural time and level differences between the left and the right ear signals are equalized, so that the subtraction of the signals gives either a minimization or maximization of the output level. In theory, the level minimization is the optimal procedure for negative SNRs and the level maximization is the optimal procedure for positive SNRs. To simulate the imperfect human binaural processing, BSIM2020 does not use optimal parameters for interaural level and time equalization, but slightly jittered values that simulate normally distributed processing uncertainties that are realized using Monte-Carlo simulations. In the next step, BSIM2020 uses the speech-to-reverberation modulation ratio (SRMR, Santos et al., 2014) to select whether the level minimization or maximization is used for each gammatone channel. The SRMR calculates the ratio between the energy in modulation frequencies lower than 20 Hz and the energy in modulation frequencies between 20 and 128 Hz, where the low modulation frequencies represent speech and the high modulation frequencies represent noise and room-acoustics effects. The higher the SRMR value, the more dominant the speech-like modulations. For frequencies above 1500 Hz, the SRMR is used to select whether the left-ear signal or the right-ear signal shows more speech-like modulations. The respective gammatone filter channel is selected. In the final step, the front-end combines the selected gammatone bands using a gammatone synthesis filter bank and calculates a monaural output with enhanced SNR.
The back-end applies the speech intelligibility Index (SII) to the front-end's output signal. The SII can be used to predict SRTs, as in Hauth et al. (2020), or to predict LE as in this study. This is achieved by mapping the SII to SI or LE reference data from the S0N0 condition, as described below in the results section. Note that the SII is not blind, as it requires auxiliary information about the spectral power in the front-end's output signal that originates from the clean speech and from the clean noise signal. As all processing steps in the binaural front-end are linear, the impact of the front-end's processing can be calculated separately for the speech and the noise signal.
Listeners
70 listeners aged between 18 and 76 years were invited to the Hörzentrum Oldenburg for two sessions. All listeners had normal hearing, defined as a pure tone average (PTA4; average across 0.5, 1, 2, and 4 kHz) of less than 20 dB HL. The listeners were assigned to three age groups: Group

Mean pure tone audiograms and standard deviation for group
From group
Experiments
At the beginning of the study, all listeners received information about the study, and their consent to participate was obtained. After measuring the pure-tone audiogram (0.25 to 8 kHz), the SI test (OLSA) and LE rating (ACALES) were performed.
Prior to the measurements, the listeners read written instructions and conducted two training lists for OLSA, as recommended by Wagener et al. (1999b), and one training for ACALES for the S0N0 condition: We used a fixed order of the measurements. First, OLSA was measured only in the S0N0 condition. Then ACALES was performed for each azimuth condition (S0N0, S0N90, S0N135, and S0N180) with the order of the azimuths chosen randomly for each listener. The focus is on noise sources in the rear hemisphere, since e.g., hearing aid algorithms typically enhance (speech) signals from the front and suppress (noise) signals from the back. In total, the listeners completed three SI tests using OLSA (including two training lists), and five LE rating measurements using ACALES (including one training) in one session. Listeners were appointed for two visits to evaluate test-retest reliability, and the average time between the two visits was 7.8 days (SD: 4 days, min: 2 days; max: 21 days). During the second appointment, no pure-tone audiogram was measured, but the remaining measurements were the same. The study was approved by the Ethics Committee of the University of Oldenburg (Drs. 47/2017) and was in line with the Helsinki Declaration of Ethical Principles for Medical Research Involving Human Subjects.
In addition to measurements with listeners, simulations with BSIM2020 were performed to predict LE. For this purpose, ten OLSA sentences were used, with each word from the OLSA corpus used once. The speech material was mixed with the noise in a SNR range from −46 to + 15 dB in steps of 1dB for each masker azimuth at 0°, 90°, 135°, and 180°. For each SNR and masker azimuth, ten Monte-Carlo simulations were computed. For the analysis, the SII values were averaged across the Monte-Carlo simulations for each of the ten sentences. The resulting mean SII values were averaged across the 10 sentences, giving one SII estimate for each SNR value.
Equipment
The test signals were presented to the listeners after D/A conversion (sound card ADI-8 Pro by RME, Haimhausen, Germany) and amplification (HB7 by Tucker-Davis, Alachua, Florida, U.S.A.) via loudspeakers (Mackie HR 824 by LOUD technologies, Woodinville, Washington, U.S.A.) in a soundproof room with a reverberation time of 0.11 s (T30) at the Hörzentrum Oldenburg. The speech was always presented from the frontal direction, and the masker azimuth depended on the measurement condition. The participant was seated in a semicircle of four loudspeakers arranged to the right hand side of the participant at a distance of 1.4 m each. The calibration was carried out by adjusting the level of the Olnoise to 80 dB SPL at the position of the participant's head, with the participant absent, using a measurement microphone (type 4189 by Bruel and Kjær, Nærum, Denmark) and a sound level meter (“Modular Precision Sound Analyzer”; model 2260 by Bruel and Kjær, Nærum, Denmark). A touch screen was used for the graphical presentation of the ACALES rating scale, and the response input during the measurement was given independently by the participant him/herself by selecting the desired category on the touch screen.
Analysis and Statistics
To describe the intelligibility as a function of SNR, a model intelligibility function was fitted using a maximum-likelihood estimate, as proposed by Brand and Kollmeier (2002). This model function is given by

To describe the LE as a function of SNR, the “BX” fit by Oetting et al. (2014), as recommended by Krueger et al. (2017a), was used, which minimized the deviation of the SNRs for each rating category from 1 to 13 ESCU (the category “only noise” was excluded from the analysis). This model function considers two linear functions with the slopes

The test-retest standard deviation (Plomp and Mimpen, 1979; Dreschler et al., 2008) for each rating category is calculated as

The software Matlab R2007b (The MathWorks Inc., Natick, Massachusetts, U.S.A.) and SPSS Version 22 (IBM, Armonk, New York, U.S.A.) were used to analyze the data. A multivariate analysis of variance ANOVA for repeated measurements was performed with normally distributed data. As the derived variables of the function are not statistically independent, an ANOVA for repeated measurements was individually performed for the rating categories "no effort", "moderate effort" and "extreme effort". Since the listening effort function consists of two linear functions with independent slopes, the rating categories "no effort" and "extreme effort" can be regarded as statically independent. The rating category "moderate effort" represents the intersection of the two linear functions, which is defined by three statistical degrees of freedom (lower slope, upper slope, intersection). The ANOVA for repeated measurements was carried out for the comparison of the different measurement conditions (S0N0, S0N90, S0N135, and S0N180) and for the test-retest reliability. A one-way analysis of variance ANOVA was used to investigate the differences between the age groups for the different masker directions. The level of significance was always set to 5%.
To verify the homogeneity of variance between the data groups, Levene's test was performed. If the homogeneity of variance was confirmed, an ANOVA was conducted. If heterogeneity of variances was detected, the Kruskal-Wallis test was performed instead of an ANOVA. The Kruskal-Wallis test was also used for nonparametric independent samples. Depending on the samples, the following tests were used post-hoc: Welch test for independent and normally distributed samples; Mann-Whitney U for independent and nonparametric samples; and two-sided t-test for related and normally distributed samples.
The intra-class correlation coefficient (ICC) was used to assess the reproducibility of measurements, e.g., test-retest reliability. Using SPSS, the ICC was calculated with the “two way mixed” model and the “absolute agreement” type for average measures.
For the evaluation of the ACALES results, one participant from group C was excluded. The participant's responses were at very low presentation levels and reached the minimum presentation level of −20 dB SNR. The resulting LE function showed a strong parallel shift and indicated an incorrect sound-card setting during the measurement.
Results
Effect of a ge on Speech Intelligibility and Listening Effort
For the evaluation of the age effect, the age groups were separately compared for SI and LE. Figure 3 shows the average SI functions (left panel) and the average LE functions (right panel) for the three ages groups for frontal presentation of speech and noise (S0N0). The average SI functions were calculated by averaging the individual SRT and slope values estimated using the adaptive procedure for each listener of the specific group. With increasing SNR, SI increased up to 100% at approximately −2 dB SNR for group
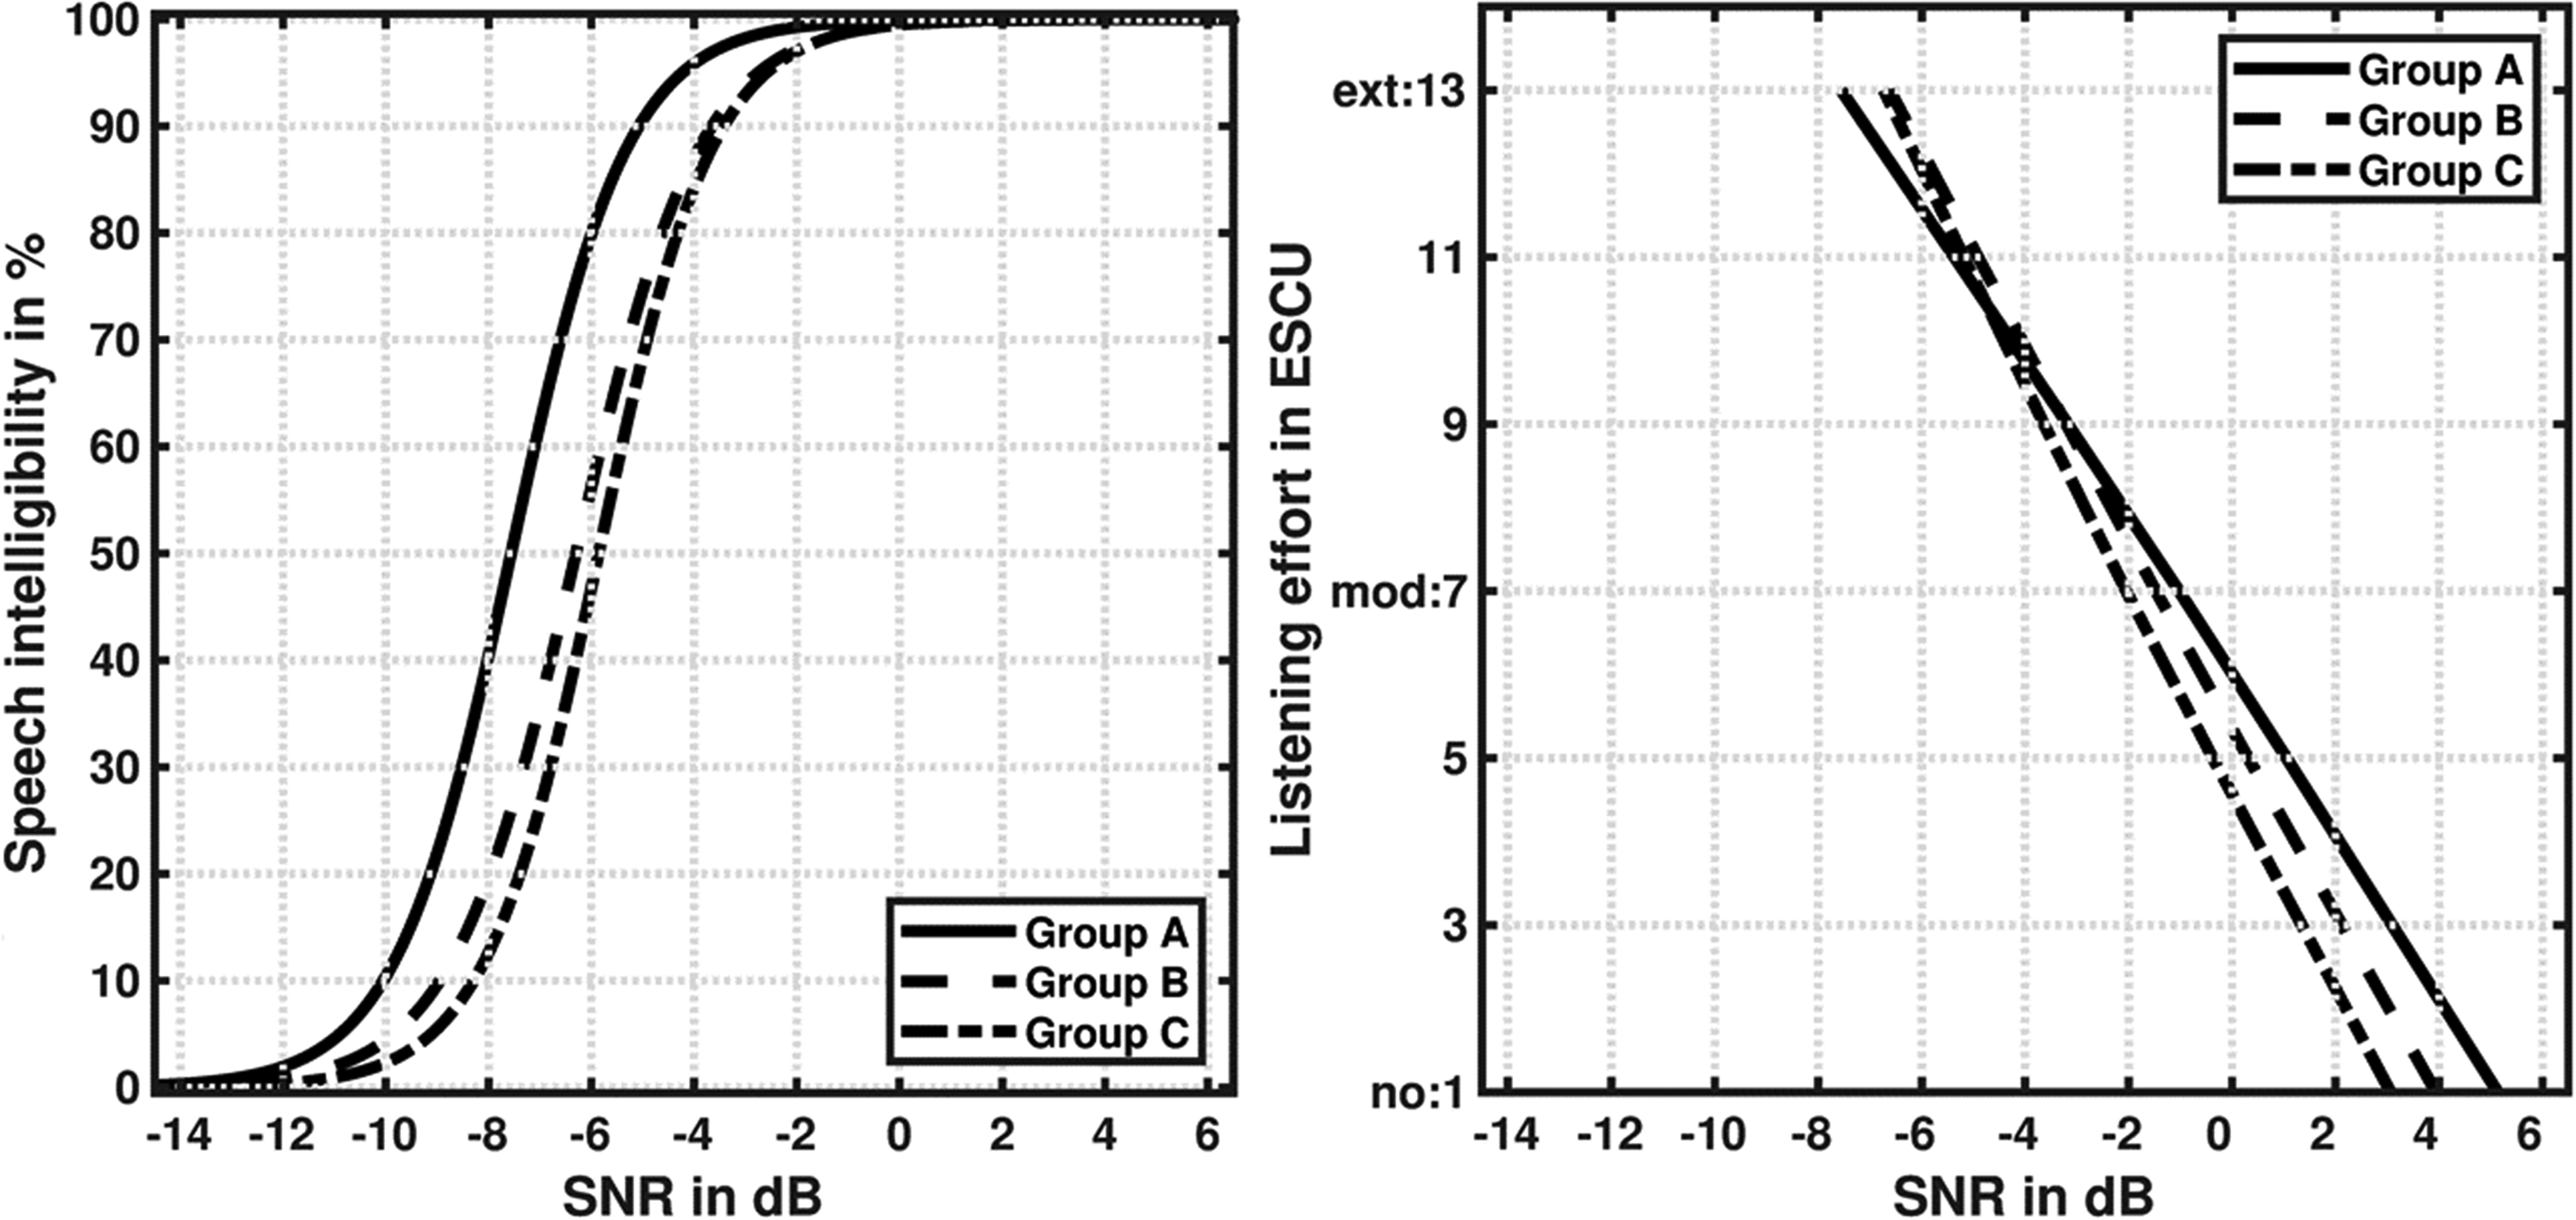
SI functions (left panel) and LE functions (right panel) as a function of SNR in dB for the three age groups and for frontal presentation of speech and noise (S0N0). With increasing SNR, the SI improved and the perceived LE decreased. ESCU = effort scale categorical unit. “no effort” = 1 ESCU, “moderate effort” = 7 ESCU, “extreme effort” = 13 ESCU. ‘Group
The single-factor variance analysis for normally distributed independent samples considering the test of variance homogeneity (Levene test), and the Welch test, showed that the differences between the age groups were statistically significant for the SRT (F(2,66) = 25.77, p < .001). The Mann-Whitney U post hoc test for independent samples confirmed that all age groups differed significantly from each other in SRT (Group
The differences in the slope of the SI function were analyzed using the Kruskal-Wallis test for non-normally distributed independent samples, and showed no significant differences (H(2) = .79, p = .671).
The average LE function was calculated by averaging the SNRs for each rating category over all listeners (Figure 3, right panel). As recommended by Krueger et al. (2017a), the two-slope function was used for the evaluation of the different masker azimuths, even though the shape of the two-slope function is very similar to a straight line. The perceived LE decreased with increasing SNR. In the range from “no effort” (1 ESCU) to “considerable effort” (9 ESCU), the younger listeners (group
The single factor variance analysis for normally distributed independent samples considering the test of variance homogeneity (Levene test) and the Welch test showed that the differences between the age groups were statistically not significant for the perceived LE category “no effort” (F(2,66) = 1.85, p = .165), “moderate effort” (F(2,66) = .73, p = .487), and “extreme effort” (F(2,66) = 1.25, p = .294). Accordingly, no significant differences were found between the SNRs belonging to the respective rating categories and the three age groups.
In a following evaluation step, the descriptive parameters of the listening effort function - lower and upper slope - were analyzed. The differences between the lower slope between “no effort” and “moderate effort”, and the upper slope between “moderate effort” and “extreme effort”, ranged from 0 to 3.0 for the different listeners (see Table 1).
Averaged Values and Standard Deviations in Parentheses for the Lower and the Upper Slope of the LE Function Divided into Groups. ‘Group

The differences in the slopes of the two-slope LE function were analyzed using the Kruskal-Wallis test for independent samples. The lower slope between “no effort” and “moderate effort” was found to be marginally non-significant using a significance level of 0.05 (H(2) = 5.72, p = .057), but the upper slope between “moderate effort” and “extreme effort” showed significant differences between age groups (H(2) = 9.95, p = .007) (see Supplemental Table 1 and azimuth 0°). The Mann-Whitney U post-hoc test for independent samples showed that the listeners of group
In summary, significant differences were found between the age groups for the upper slope as a parameter of the listening effort function, but not in the analysis of the SNRs belonging to the respective rating categories. This contradictive finding is discussed below.
SI and LE functions showed very different behaviors: SI approximated 100% asymptotically at −2 dB SNR, whereas LE decreased with increasing SNR and was rated with 7 to 8 ESCU (between “moderate effort” and “considerable effort”) in the SNR range where the SI reached 95%. SI no longer increased with increasing SNR, but the perceived LE continued to decrease, and reached its minimum at an SNR of 3 to 5 dB. For each age group the SNR corresponding to the SRT was rated as requiring “extreme effort” (13 ESCU).
Effect of Spatial Separation on Listening Effort for Different a ge Groups
For the evaluation of the age effect and the spatial separation as well as the interaction between, the age groups were compared with each other for each noise azimuth. Figure 4 shows the LE functions for the noise azimuths 90° (left panel), 135° (middle panel), and 180° (right panel).
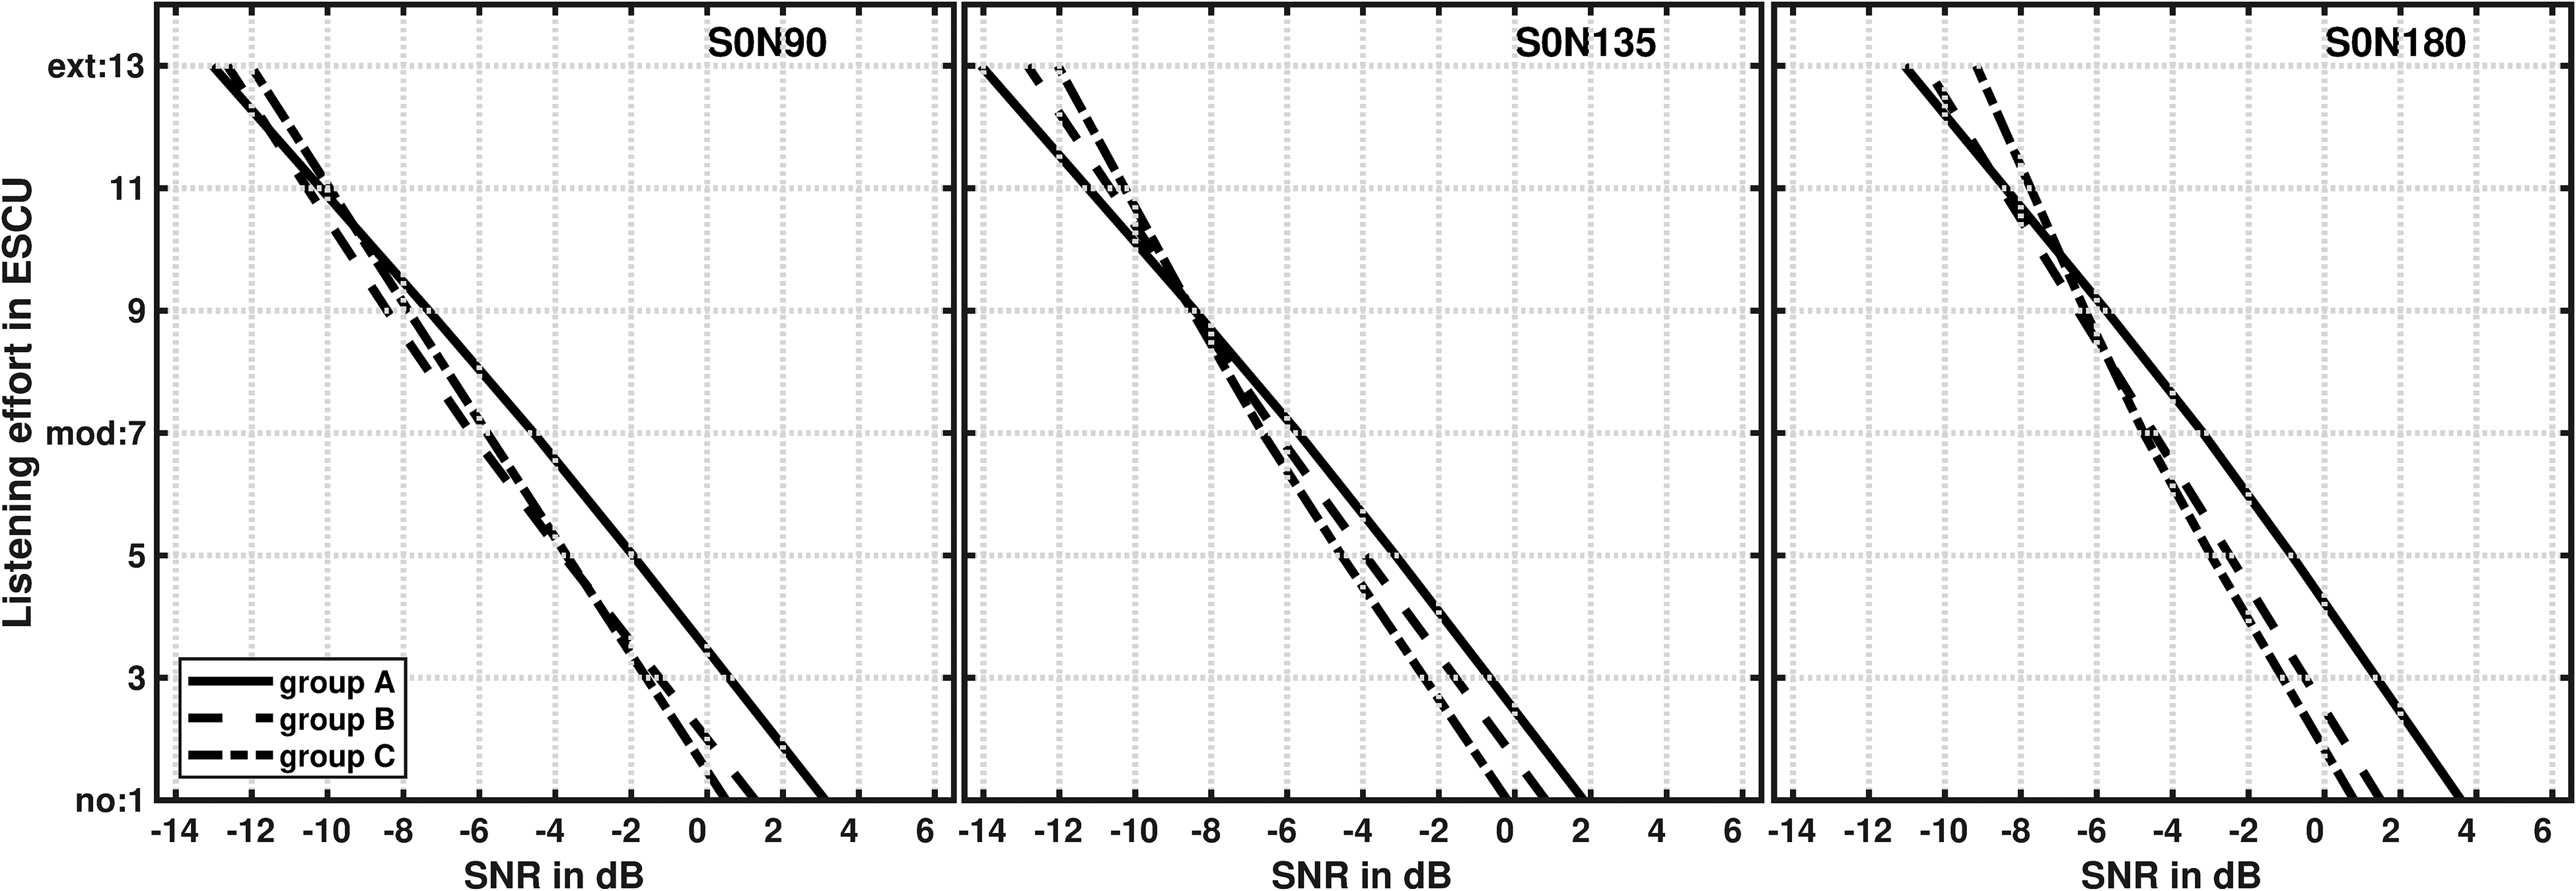
LE functions in effort scale categorical units (ESCU) for three noise azimuths and three age groups: group
As already described for the noise azimuth of 0°, the younger listeners (group
The differences in the slopes of the two-slope LE function were analyzed using the Kruskal-Wallis test for independent samples for each noise azimuth. The results are summarized in Supplemental table 1. The slopes of the LE function differed significantly between the age groups for the upper slope, except for 135°. No significant effects were found for the lower slope. The Mann-Whitney U post hoc test for independent samples showed that group
The interaction between age and spatial conditions was analyzed using the ANOVA for repeated measures. No significant interaction was found (F(7.32, 241.41) = .95, p = .473) for the respective rating categories as well as for the lower (F(3.15, 104.07) = .91, p = .443) and upper slope (F(6, 198) = 1.66, p = .134), which means that the perceived listening effort for the spatial direction did not differ depending on age.
Effect of Spatial Separation on Listening Effort for all Listeners
To investigate the effect of spatial segregation in detail, all 69 listeners are considered, irrespective of age, since no significant differences were found for the listening effort function and between the rating categories while comparing age groups. Figure 5 shows the average LE functions for the four noise azimuths. The subjective LE in ESCU is plotted as a function of the SNR in dB.

LE functions for four noise azimuths averaged across 69 listeners (age-independent). Speech from the frontal direction (S0) and noise (N) from 0°, 90°, 135°, or 180° azimuth.
With increasing noise azimuth, the subjectively perceived LE decreased up to 135° and increased again for 180°. The upper and the lower slope of the two-slope functions were nearly identical. The distance between the LE functions increased with increasing LE. For 1 ESCU, the maximum difference was 3.2 dB, and 6.1 dB for 13 ESCU.
For statistical analysis, the SNRs for the rating categories "no effort” (1 ESCU), “moderate effort” (7 ESCU), and “extreme effort” (13 ESCU), calculated from the estimated LE functions of each individual participant and each noise direction, were analyzed separately. The ANOVA for repeated measures showed a significant effect of the masker direction for all rating categories (“no effort”: F(3,204) = 39.23, p < 0.001; “moderate effort”: Greenhouse-Geisser ε = 0.88, F(3,204) = 111.04, p < 0.001; “extreme effort”: Greenhouse-Geisser ε = 0.82, F(3,204) = 500.31, p < 0.001). The results of the two-sided post hoc t-test for related samples in Supplemental Table 3 shows significant differences (p < .001) for almost all directions.
For the calculation of SRLE, the SNR values for each named rating category (1, 3, 5, 7, 9, 11, and 13 ESCU) and for each noise azimuth (90°, 135°, and 180°) were subtracted from the values for 0° noise azimuth (see Figure 6). In general, the SRLE increased with LE, showing a parallel shift of the curves. At 1 ESCU ("no effort"), the SRLE ranged from 2 dB (at 180°) to 3.2 dB (at 135°). At 13 ESCU, these values lay between 3.3 dB (180°) and 6.1 dB (135°), which is the highest value. Accordingly, the SRLE was more pronounced in the negative SNR range (above 5 ESCU for noise azimuth 0°) than in the positive range (below 5 ESCU for noise azimuth 0°). Nevertheless, SRLE was clearly measurable at low LE values (1 to 5 ESCU), with values up to 4.2 dB at 135°.

Spatial release from LE for the labeled rating categories (no effort” = 1 ESCU, “moderate effort” = 7 ESCU, “extreme effort” = 13 ESCU). Speech from the frontal direction and noise from 0°, 90°, 135° or 180°. Solid lines: SNR values for noise azimuth 0° are positive; dashed lines: SNR values for noise azimuth 0° are negative (see Figure 5).
Modeling of Listening Effort
BSIM2020 (Hauth et al., 2020) was used to model LE, using the identical speech and noise signals as in the experiments. Figure 7 shows the averaged output SII values of BSIM2020 as well as the perceived LE functions measured with the listeners. The SII was highest for S0N135, and decreased with decreasing noise azimuth. For S0N180, the SII was only slightly better than for S0N0. Comparing the SII values for the different azimuths at the same SNR, higher SII values indicate a better result. Comparing the LE values for the different azimuths at the same SNR, high LE values indicated a higher listening effort. Thus, the better results for SII and LE are inversely related. Accordingly, the LE functions, measured with listeners, showed the reverse ranking to the modeled SII functions.

Output SII functions of BSIM2020 (left scale, black lines) and measured LE functions (right scale, gray lines), averaged across all listeners (N = 69) for the noise azimuths 0°, 90°, 135°, and 180°.
Figure 8 shows the relationship between SII and LE. For this purpose, for each LE category, the SNR value and the associated SII were taken from Figure 7. The resulting functions for S0N0, S0N90, and S0N135 are very close together. If the model worked perfectly, these functions would be identical. The function for S0N180 deviates from the other functions, indicating the predictions for this condition are biased. Furthermore, the SII difference between the functions for S0N135 and S0N180 increases from approximately 0.06 at "no effort" (1 ESCU) to 0.09 at “extreme effort” (13 ESCU).

SII output functions of BSIM2020 and measured LE functions, averaged across all listeners (N = 69), for noise azimuths 0°, 90°, 135°, and 180°. LE functions in effort scale categorical units (ESCU).
Figure 9 shows the measured SRLE (solid line) and the modeled SRLE (dashed line) for the different LE categories. For this purpose, for each LE category, the SNR value and the associated SII were taken from Figure 7 for all noise azimuths. The corresponding SII values for each rating category from the S0N0 condition are used as the reference SII values (1 ESCU: SII = 0.904, 3 ESCU: SII = 0.855, 5 ESCU: SII = 0.793, 7 ESCU: SII = 0.769, 9 ESCU: SII = 0.709, 11 ESCU: SII = 0.638; 13 ESCU: SII = 0.573). For the calculation of the SRLE, the SNR values corresponding to the reference SII values were derived for the 90°, 135° and 180° noise azimuth and subtracted from the reference SNR values. In the following we will use the term modeled LE for these values.

Measured and predicted SRLE. The corresponding SII values for each rating category were established based on the S0N0 condition.
The top row of Figure 9 includes the rating categories 1 ESCU to 5 ESCU, which have positive SNR values for noise azimuth 0° (see Figure 7). For the rating categories 1, 3, and 5 ESCU, BSIM2020 overestimates the SRLE by up to 1.8 dB for N0S135 and underestimates the SRLE by 1.3 dB for N0S180. For S0N90, BSIM2020 overestimates the SRLE by less than 1 dB for the rating categories 1 and 5 ESCU. For the rating categories with negative SNR (bottom row), BSIM2020 predicts the SRLE very accurately for S0N90 and S0N135. The inaccuracy occurs with an underestimation of 0.5 dB at the rating category 9 ESCU (S0N90) and of 0.6 dB at 13 ESCU (S0N135). For S0N180, however, the SRLE is constantly underestimated by up to 2.3 dB at 13 ESCU.
Test-Retest Comparison
Figure 10 shows curves of equal LE for all 69 listeners, irrespective of age. The average SNR values for the rating categories 1 ESCU (top) to 13 ESCU (bottom) are plotted as a function of the masker azimuth measured in two sessions (black and grey lines). The curves show parallel bathtub-like patterns, and test and retest are very similar. The largest difference between the averaged test and retest results is 0.9 dB (1 ESCU) for S0N135. With increasing LE and decreasing SNR, the distance between test and retest condition decreases. An ANOVA for repeated measures found no significant differences between the two sessions for S0N0, S0N90, and S0N180 (p > 0.2 for all test conditions). For S0N135, significant differences are revealed for the rating categories 1 ESCU (F(1,68) = 5.01; p = .028) and 3 ESCU (F(1,68) = 4.14, p = .046). No significant difference was found for the other rating categories (p > 0.1).

Curves of equal LE for the test and the retest measurement, averaged over 69 listeners (age-independent) for different noise azimuths and test - retest results for SRTs divided by age groups. The target speech was presented from the front. ESCU stands for effort scale categorical unit. “no effort” = 1 ESCU, “moderate effort” = 7 ESCU, “extreme effort” = 13 ESCU.
The rest-retest results for the SRT measurement are divided into the age groups due to the significant age effects between the groups (see section III. A). The difference between test-retest is on average 0.3 dB for group
To quantify the reproducibility of ACALES for the four noise azimuths the test-retest standard deviation (TRSD) was calculated from the SNR values for each rating category (see Table 2) as well as the TRSD for the age-related SRTs. For the SI, the TRSD ranges from 0.5 dB (group
Test-retest Standard Deviation (TRSD) Calculated Across 69 Listeners (age-independent) Using the Individual SNR Values for Each Rating Category (1 ESCU = “

The intra-class correlation coefficient (ICC, see Table 3) confirmed the test-retest reliability between the estimated LE functions for the two sessions (p
Reference Ranges for Listening Effort
Normal-hearing reference ranges were measured, which may serve for the classification of individual measurement results. Since no age-related differences in the perceived LE were found, the reference ranges were calculated age-independently and the data of all 69 listeners were used. Furthermore, no significant differences between the test and retest results were found, so that both test and retest results were considered, and the reference ranges determined based on 138 data sets (test and retest results of 69 listeners). For this purpose, the LE function was calculated for the ratings of each listener separately for test and retest. Figure 11 shows the 10th and 90th percentile range of the LE function for each masker azimuth (gray-shaded area) as well as the average LE function (solid line) calculated using the test and retest data of all 69 listeners, in total 138 LE functions.

10th and 90th percentile reference ranges for the four noise azimuths (gray-shaded area) and the average two-slope functions for all listeners (N = 69). LE functions in effort scale categorical units (ESCU). “no effort” = 1 ESCU, “moderate effort” = 7 ESCU, “extreme effort” = 13 ESCU. Top left: noise azimuth 0°, top right: noise azimuth 90°, bottom left: noise azimuth 135°, bottom right: noise azimuth 180°.
The reference ranges were narrowest in the range of “extreme effort” (13 ESCU) and became wider as LE decreased. The maximum width was reached at “no effort”. This was noticeable for all azimuths. Overall, the S0N0 condition had the narrowest reference range with 9.6 dB at 1 ESCU, and with 5.1 dB at 13 ESCU. The ranges for 90°, 135°, and 180° showed similar patterns. Supplemental Table 4 shows the 10th and 90th percentile values, as well as the mean and median values for each masker presentation direction.
Discussion
This study investigated the influence of age on subjective LE and SI as well as the benefit of spatial source separation on LE. Furthermore, LE and SRLE was modeled using BSIM2020. In the following, the results are discussed with respect to the hypotheses mentioned in the introduction and the current state of listening effort research.
Effect of a ge on Listening Effort and Remaining Effect of Hearing Loss
Larsby et al. (2005) compared young with older normal-hearing listeners, and measured perceived LE at a constant SNR of 10 dB using the Borg'CR-10 scale (Borg, 1990). They suggested that older adults tend to rate perceived LE lower than younger adults. This effect was found at positive SNRs, and is supported to a certain degree by the current study. A similar phenomenon occurred in the subjective perception of speech intelligibility. In studies by Failes et al. (2020) and Rogers et al. (2012), young and older listeners were asked to repeat the target word at the end of the sentence and to rate whether they a) heard the word, b) recognized the word based on the context, or c) guessed the word. It turned out that older listeners are more likely to rate with “heard” in the cases of false hearing compared to young listeners, which indicates that the older listeners tended to overestimate their own speech recognition ability.
To the best of our knowledge, ours is the first study investigating age effects on ratings of perceived LE for different SNR conditions based on an adaptive procedure. The analysis of the respective LE categories shows no significant differences. Despite visible trends, due to the large standard deviations for both the categories "no effort" (1 ESCU) and "extreme effort" (13 ESCU) no significant age effect was detected for the respective LE categories. Nevertheless, the age order of the listening effort functions reversed at 10 ESCU (see Figure 3 and Figure 4). At positive SNRs younger listeners perceived more effort than older listeners, but this was reversed for higher effort conditions at negative SNRs. This effect may be explained in part by differences in hearing ability, as the PTA4 of the older listeners (group
However, this reversal might explain that no significant effect was detected in the statistical evaluation of the LE rating. To analyze this in more detail also the slopes of the rating functions were used for the analysis of the age effect. Here, significant difference was found between the older (group
Listeners in the different age groups have varying prior experience with listening effort measurements. With increasing age, the prior experience decreases. At the beginning of each test session, a complete ACALES measurement was performed, as recommended by Krueger et al. (2017a). Prior experience made speech material and background noise more familiar to listeners, but had no measurable impact on the perception of listening effort.
Relation Between LE and SI
In a study with 15 young normally hearing adults (mean age: 24.6 years) comparing SI functions with LE functions in the S0N0 condition, Krueger et al. (2017b) found that at −2 dB SNR, SI reaches saturation at values above 95%. At this SNR, the perceived LE was rated with 8 ESCU. These values were reproduced in this study with 69 adults that had normal hearing and different ages. This suggests that the relationship between SI and LE is also valid for older adults with normal hearing, and is thus independent of age.
Wu et al. (2018) stated that everyday communication situations range from 2 to 14 dB. In our presented study, it was shown that SI of almost 100% can be achieved even earlier, but with a clearly perceivable LE. The subjective perceived LE reaches its minimum between + 3 dB and + 6 dB SNR, depending on the age group. This suggests that the everyday SNR range for communication represents a mixture of high SI and low LE.
Effect of Spatial Separation on LE and on SI
The subjectively perceived LE decreased with increasing spatial separation of target and masker up to 135°, and decreased again at a separation of 180°. A similar pattern was found for SRMSI by Bronkhorst and Plomp (1988), Beutelmann and Brand (2006), and Hauth et al. (2020). However, the absolute amount of the release from masking is larger for SI than for LE: Beutelmann and Brand (2006) found a SRMSI between 9.4 dB for S0N45, and 12.1 dB for S0N125. Thus, SRMSI was almost twice as large as SRLE, with 6.1 dB for S0N135. A possible explanation for this finding is that the auditory processing that enables SRMSI is related to an increased LE, and that consequently SRLE is lower than SRMSI.
SRLE depends on the SNR: For rating categories above 5 ESCU (negative SNRs for S0N0), the SRLE for S0N135 was between 4.5 and 6 dB. For rating categories below 5 ESCU (positive SNRs for S0N0) the SRLE for S0N135 was between 3 and 4 dB. Hauth et al. (2020) found a similar level dependency for SRMSI. This is discussed in the section “Prediction of LE and SRLE using BSIM2020”.
Test-Retest Comparison
Once the listeners created an internal definition of LE in the first session, they could reproduce their ratings quite well at a later date; the maximal time interval was 21 days in the current study. This is indicated by Krueger et al. (2017a), who reported an average ICC of 0.92 for ACALES. In that study, the ICC values (averaged across age groups) ranged between 0.86 and 0.89 for the different noise directions, which confirms a good reliability ( Koo & Li, 2016). The test-retest standard deviation (TRSD) for ACALES found in the current study is between 1.0 to 2.4 dB, depending on the noise azimuth and the LE rating category, with a mean value of 1.8 dB. The TRSD decreased with increasing effort and increased with increasing spatial separation of target speech and noise. Only for the noise azimuth 135° significant differences were found for the rating categories 1 and 3 ESCU. Note that the TRSD for these two categories is, at 2.3 dB (1 ESCU) and 2.0 dB (3 ESCU), identical to the TRSD for 90° and 180° noise azimuth.
For SI measured with the German matrix test, a TRSD of 0.5 dB for young normal hearing and 0.7 dB for older hearing impaired listeners was determined (Wagener, 2004). In this study, the TRSD for normal hearing listeners is below 0.7 dB for all age groups. The young listeners of group
Prediction of LE and SRLE Using BSIM2020
Hauth et al. (2020) developed BSIM2020 for modeling SRT values and evaluated it using SRMSI data for both the negative and positive SNRs. In the model, BSIM2020 predicted a larger SRMSI for negative SNRs compared to positive SNRs, which was in line with the data of Hauth et al. (2020).
In this study, we used BSIM2020 for predicting LE and SRLE. The predictions agree very well with the measured LE for "moderate effort" (7 ESCU) up to “extreme effort” (13 ESCU), where the SNR is negative, so it can be concluded that the strategy of BSIM2020 for negative SNR values is applicable for modeling both SI and LE. The largest SRLE was found for the rating category “extreme effort” (13 ESCU), with a magnitude of 5.5 dB between S0N0 and S0N90 and 6 dB between S0N0 and S0N135. Both were predicted very well.
In the positive SNR range, less SRLE was found, which BSIM2020 overestimated by 2 dB in the S0N135 condition. We see two possible explanations for this overestimation: First, the spatial release from masking requires effort, and consequently the perceived SRLE is smaller than predicted. Second, the SRM is indeed smaller than the model predicts. Based on this study, we have no evidence in favor of either possible explanation. Nevertheless, the finding that SRLE is at all detectable at positive SNRs is evidence in favor of the hypothesis that the human binaural system enables spatial release from masking even at positive SNRs. This is in line with BSIM2020, which uses a level-maximization strategy in its EC stage.
BSIM2020 underestimated SRLE for all rating categories in the S0N180 condition. In this condition, there are no interaural differences, but only spectral differences between target speech and interferer. In this condition, the binaural front-end of BSIM2020 has no effect. This indicates that the SII, which acts as the model back-end, underestimates the release from LE that is caused by these spectral differences.
Comparison to Rennies and Kidd (2018)
Rennies and Kidd (2018) also used categorical ratings of LE and measured a SRLE of 2 dB for the rating categories “no effort” (1 ESCU) between the S0N0 and the S0N135 conditions. This is compatible with the results of the present study. However, in Rennies and Kidd (2018), “no effort” (1 ESCU) was rated in the range from 10 to 14 dB SNR, whereas in the present study the range was from 1 to 5 dB SNR. Furthermore, in Rennies and Kidd (2018), "extreme effort" (13 ESCU) was rated in the range from −15 to −27 dB SNR, whereas in the present study the range was from −7 to −13 dB SNR. These differences can, to a certain degree, be explained by the different speech test used in the two studies. Rennies and Kidd (2018) used the American Matrix test spoken by a female speaker, with an SRT of −10.0 dB SNR (Kollmeier et al., 2015) for normal-hearing listeners in the S0N0 condition. The present study used the German Matrix Test spoken by a male speaker and an SRT of −7.1 dB SNR for the S0N0 condition (Wagener et al., 1999c).
Furthermore, there are several other differences in the methods of the two studies, which may have influenced the results: Rennies and Kidd (2018) used constant stimuli with fixed SNR values, which differed for the presented noise azimuths and ranged between −25 to 10 dB SNR in steps of 5 dB. Based on these predefined SNR values, anchors were given to the listeners, which may have influenced the ratings. In the current study, ACALES was used, which does not use fixed and predefined SNR values, but calculates the SNR values based on the individual ratings. Both the adaptive method and the measurement with fixed SNRs are easily applicable methods to determine subjective listening effort. Due to the different focus of the methods, many possible applications are covered. The adaptive method provides the ability to determine the entire individual listening effort function from easy to difficult listening situations to within one measurement. The method with fixed SNRs allows measuring the subjective listening effort for specific listening situations, e.g., at 5 dB SNR.
In Rennies and Kidd (2018), LE was rated directly after each sentence. In the present study, participants listened to three sentences for each rating. This causes a TRSD between 1.0 to 2.4 dB, depending on the noise azimuth and the LE rating category. Compared to the test-retest reliability of the subjective loudness scaling method, which has values between 3 and 6 dB depending on the quartile (Oetting et al., 2014), the values for ACALES are noticeably lower. It is currently an open question how good the TRSD is for only using one sentence per rating. With a high TRSD, the time saving could provide a benefit.
Rennies and Kidd (2018) tested all spatial conditions and SNR combinations in one block, with random order, and they did not use training prior to testing. In our study, the different spatial conditions were tested block by block, and training was used, as recommended by Krueger et al. (2017), to familiarize the participant with the procedure and to create their own internal reference how they interpret LE. These differences may have led to the different dynamic ranges in the two studies. Both randomization approaches have their rationale. Randomizing all test condition (spatial conditions and SNR combinations) within one measurement block reflects a very dynamic cocktail party situation where the speaker and SNRs constantly change. The participant has to adapt quickly to the listening situation. Problematic is only the short acclimatization time of one sentence to the new measurement situation, as the participant has to decide directly how to rate the perceived listening effort. Measuring each test condition in succession allows acclimatization to the spatial condition and it changes only the SNR during the measurement. This may have led to the increased measurement accuracy.
Rennies and Kidd (2018) used headphones, and signals were convolved with head-related room impulse responses. In this study, the stimuli were presented via loudspeakers in the free field. The different sound presentation in the two studies shows that both headphones and loudspeakers can be used to measure subjective listening effort and can be selected according to the intended application, e.g., measurement of hearing aids or complex virtual acoustic situations.
Reference Ranges for Listening Effort
The noise-azimuth-dependent reference ranges can be used as an orientation for the classification of LE results. However, so far we cannot recommend the method for diagnostic purposes, as, to the best of our knowledge, diagnostics based on subjective LE ratings have not yet been studied. Nevertheless, the reference ranges introduced allow a comparison of the individually perceived LE with normal-hearing listeners from different age groups.
Comparison to Studies Using Objective Methods
LE is influenced by various factors such as arousal, attention, stress, perceived difficulty, motivation (Pichora-Fuller et al. 2016). In this study, only subjective listening effort was determined. In research, objective methods such as EEG, pupillometry and dual-task approaches are also established. Although all measurement methods claim to measure LE, it is questionable whether they measure the same thing. Comparing subjective and objective methods has proved to be difficult and often no or only very low correlations were found (e.g., Alhanbali et al., 2019).
Behavioral and physiological measures reflect changes in neural processing, subjective measures the self-perception. Even if the listening situation causes neurologically increased deflections, self-perception may remain unchanged and vice versa. This assumption is confirmed by comparing this study with the studies of Zekveld et al. (2014) and Xia et al. (2015). In our study, the effect of spatial release from masking was measured subjectively, both in the negative and positive SNR range. Zekveld et al. (2014) determined listening effort using pupillometry with the SRT as a fixed SNR and a multi-talker masker. In their study, they found no benefit of the spatial separation. In contrast, Xia et al. (2015) found a significant benefit from spatial separation using a dual-task approach, at a fixed SNR of 0 dB and a target signal level of 65 dB SPL. It is unclear whether the different findings depend only on the different measurement methods or also on the different fixed SNRs.
Limitations and Possible Improvements
In this study, the adaptive scaling method ACALES (Krueger et al., 2017a) was used to measure subjective listening effort. Based on the adaptive level calculation, the individual listening effort function is estimated from "no effort" to "extreme effort". Sentences of the German matrix test are used, which do not contain semantic cues. Since semantically different sentences elicit different levels of effort due to factors such as prior knowledge, familiarity, etc., the ACALES measurement focuses exclusively on the audiological auditory system, which is useful for purely audiological studies (e.g., hearing aid comparison). In this study, the subjectively perceived listening effort did not differ across age groups for the respective ratings, but for the upper slope. However, it could be that differences are revealed when speech material with semantic cues is used. Factors such as working memory, processing speed or attention may then have a greater impact on cognitive load. Furthermore, the listeners’ motivation is not considered in the ACALES measurement. In real life, motivation plays a decisive role and interacts with effort and demand (Pichora-Fuller et al., 2016).
Stationary speech-shaped noise was used to determine the spatial separation of sources and the influence on the perceived listening effort. To measure the effect in the real world, it would be interesting to use complex spatial listening situations or, following Zekveld et al. (2014) and Xia et al. (2015), to use multi-talkers as maskers. This would also allow a comparison between pupillometry, dual task and subjective rating.
Conclusions
This study investigated LE for spatially separated target speech and noise interferers, using 69 listeners with normal hearing and aged between 18 and 80 years. The following conclusions were reached:
No significant effect of age was found for the respective LE function. However, for the upper slope of the LE function a significant difference between the young and the oldest listeners were found. Note, that the estimate of this upper slope includes more data, and thus more statistical power, than the estimates of the respective LE ratings. SRLE was measurable using subjective scaling. SRLE increased with increasing LE and with increasing spatial separation, up to a noise azimuth of 135°. This is comparable with SRMSI. SRLE occurred for positive and negative SNRs and was more pronounced for negative SNRs. BSIM2020, which was originally developed for predicting SI, was used to predict LE. The model predicted spatial release from LE for negative SNRs with high accuracy. For negative SNRs, predicted and measured SRLE is approximately equal. For positive SNRs, the predicted SRLE was larger than the measured SRLE. The test-retest standard deviation of the SNRs with identical LE (estimated by the fitted LE functions) ranged between 1.0 and 2.4 dB. The test-retest standard deviation decreased with increasing LE. The test-retest standard deviation increased with increasing noise azimuth (from 0° to 180°). A significant difference between the LE functions of test and retest condition was detected for S0N0 and the LE categories 1 and 3 ESCU. Reference ranges for the noise directions 0°, 90°, 135°, and 180° were defined. They can be used for the classification of LE measurements.
Intra-class Correlation Coefficient (ICC) Ranges Based on the Minimum and Maximum ICC Values for the Rating Categories 1 to 13 ESCUs, Calculated for All Listeners (N = 69). The ICC was Calculated with the “Two Way Mixed” Model and the “Absolute Agreement” Type for Average Measures.

Supplemental Material
sj-png-1-tia-10.1177_23312165221129407 - Supplemental material for Assessing and Modeling Spatial Release From Listening Effort in Listeners With Normal Hearing: Reference Ranges and Effects of Noise Direction and Age
Supplemental material, sj-png-1-tia-10.1177_23312165221129407 for Assessing and Modeling Spatial Release From Listening Effort in Listeners With Normal Hearing: Reference Ranges and Effects of Noise Direction and Age by Melanie Krueger, Michael Schulte and Thomas Brand in Trends in Hearing
Supplemental Material
sj-png-2-tia-10.1177_23312165221129407 - Supplemental material for Assessing and Modeling Spatial Release From Listening Effort in Listeners With Normal Hearing: Reference Ranges and Effects of Noise Direction and Age
Supplemental material, sj-png-2-tia-10.1177_23312165221129407 for Assessing and Modeling Spatial Release From Listening Effort in Listeners With Normal Hearing: Reference Ranges and Effects of Noise Direction and Age by Melanie Krueger, Michael Schulte and Thomas Brand in Trends in Hearing
Supplemental Material
sj-png-3-tia-10.1177_23312165221129407 - Supplemental material for Assessing and Modeling Spatial Release From Listening Effort in Listeners With Normal Hearing: Reference Ranges and Effects of Noise Direction and Age
Supplemental material, sj-png-3-tia-10.1177_23312165221129407 for Assessing and Modeling Spatial Release From Listening Effort in Listeners With Normal Hearing: Reference Ranges and Effects of Noise Direction and Age by Melanie Krueger, Michael Schulte and Thomas Brand in Trends in Hearing
Supplemental Material
sj-png-4-tia-10.1177_23312165221129407 - Supplemental material for Assessing and Modeling Spatial Release From Listening Effort in Listeners With Normal Hearing: Reference Ranges and Effects of Noise Direction and Age
Supplemental material, sj-png-4-tia-10.1177_23312165221129407 for Assessing and Modeling Spatial Release From Listening Effort in Listeners With Normal Hearing: Reference Ranges and Effects of Noise Direction and Age by Melanie Krueger, Michael Schulte and Thomas Brand in Trends in Hearing
Footnotes
Acknowledgements
We thank all listeners for their participation in the study and Müge Kaya for data collection. English language support was provided by ![]() . This work was funded by the Cluster of Excellence “Hearing4All”, and by the Deutsche Forschungsgemeinschaft (DFG, German Research Foundation) – Project-ID 352015383 – SFB 1330 A1“.
. This work was funded by the Cluster of Excellence “Hearing4All”, and by the Deutsche Forschungsgemeinschaft (DFG, German Research Foundation) – Project-ID 352015383 – SFB 1330 A1“.
Declaration of Conflicting Interests
The author(s) declared no potential conflicts of interest with respect to the research, authorship, and/or publication of this article.
Funding
The author(s) disclosed receipt of the following financial support for the research, authorship, and/or publication of this article: This work was supported by the Deutsche Forschungsgemeinschaft (DFG, German Research Foundation), (grant number Project-ID 352015383 – SFB 1330 A1).
Supplementary Material
Supplemental material for this article is available online.
References
Supplementary Material
Please find the following supplemental material available below.
For Open Access articles published under a Creative Commons License, all supplemental material carries the same license as the article it is associated with.
For non-Open Access articles published, all supplemental material carries a non-exclusive license, and permission requests for re-use of supplemental material or any part of supplemental material shall be sent directly to the copyright owner as specified in the copyright notice associated with the article.