
Abstract
The relation between degree of sensorineural hearing loss and maximum speech identification scores (PBmax) is commonly used in audiological diagnosis and rehabilitation. It is important to consider the relation between the degree of hearing loss and the lower boundary of PBmax, as the PBmax varies largely between subjects at a given degree of hearing loss. The present study determines the lower boundary by estimating the lower limit of the one-tailed 95% confidence limit (CL) for a Dantale I, word list, in a large group of young and older subjects with primarily sensorineural hearing loss. PBmax scores were measured using Dantale I, at 30 dB above the speech reception threshold or at the most comfortable level from 1,961 subjects with a wide range of pure-tone averages. A nonlinear quantile regression approach was applied to determine the lower boundary (95% CL) of PBmax scores. At a specific pure-tone average, if the measured PBmax is poorer than the lower boundary (95% CL) of PBmax, it may be considered disproportionately poor.
Keywords
Speech audiometry is an integral part of an audiological test battery. It assists in understanding an individual’s receptive communication skills, contributes to the differential diagnosis of the auditory pathology, and contributes to the audiological management of hearing aids (McArdle & Hnath-Chisolm, 2010). Among speech audiometric measures, speech identification scores (SISs) provide information about an individual’s speech perception ability. SIS is measured as the percentage of correctly identified words out of the total number of the presented words. Hearing loss can result in damage that is not fully captured by the audiogram, and this damage can have major perceptual consequences. Thus, the measurement of SIS plays a major role in understanding communication difficulties experienced by hearing-impaired patients (Festen & Plomp, 1983; Moore, 2007; Plomp, 1986). SIS varies largely between subjects with sensorineural hearing loss due to the aforementioned reasons.
In most audiology clinics, SIS is measured using the smallest meaningful units of a language (i.e., monosyllabic words or bisyllabic words). In English, NU-6 and PB-50 monosyllabic word lists are commonly used (Martin & Morris, 1989; Martin et al., 1998). In Denmark, Dantale I is used across clinics for measuring SIS (Elberling et al., 1989). As words are used as test materials, SIS is also termed as word recognition score or word identification score. Ideally, SIS is estimated at several speech levels, and the obtained highest score is designated as the maximum score for phonetically balanced word lists (PBmax). However, in the clinical practice due to time constraints, SISs are typically estimated at a single suprathreshold level or at the most comfortable level, and the SIS at that level is considered as PBmax (DeBow & Green, 2000; Martin & Morris, 1989; Martin et al., 1998). Audiological surveys have documented the level of presentation for obtaining PBmax and indicate that 80% of audiologists chose a stimulation level of 30–40 dB above the speech recognition threshold (SRT) in clinical practice (Martin et al., 1998). Typically, in Denmark, PBmax is obtained at 30 dB above SRT with Dantale I, which contains 200 monosyllabic words divided into 8 lists with each list having 25 words (Elberling et al., 1989).
For differential diagnostics and rehabilitation, it is important to judge the PBmax obtained at a suprathreshold level with reference to the pure-tone average (PTA) and decide whether scores are disproportionately poor. An individual having a PBmax of 50% or less with normal hearing across audiometric frequencies indicates a disproportionately poor speech identification. In contrast, consider another individual having a PTA of 60 dB HL with a PBmax score of 50% at 30 dB above SRT; it is not clear whether such a PBmax should be regarded as disproportionately poor or whether it is consistent with the severity of the peripheral hearing loss (Jerger & Jerger, 1971; Jerger et al., 1968; Yellin et al., 1989). Thus, it is important to understand the distribution of PBmax scores across the different degrees of hearing loss and also to estimate the lower boundary of the range of PBmax scores that are associated with a particular degree of hearing loss.
In medical, health, epidemiological, and economical research, there is often a focus on estimating a set of quantile curves showing the variation of the population distribution on various parameters (e.g., body mass index, birth weight, blood pressure, or salary distribution, etc.; Le Cook & Manning, 2013; Lo et al., 2015; Magzamen et al., 2015; Shen et al., 2015). Furthermore, these charts are used as a first stage for screening in health or medical diagnostics. Like the distribution of height and weight with reference to age in medical science, distribution of PBmax scores varies as function of PTA in individuals with hearing loss (Dubno et al., 1995). Hence, it is important to understand the minimum (lower boundary) PBmax that is possible to obtain at a specific PTA. This can further be used as a first stage of screening to determine the audiological diagnosis (Dubno et al., 1995; Yellin et al., 1989).
The lower boundary for PBmax was initially reported by Yellin et al. (1989) for the PAL-PB 50 word list (Egan, 1948) obtained at two speech levels in patients with cochlear hearing loss. Yellin et al. (1989) determined the PBmax boundary by fitting a linear regression between PBmax scores with PTA (average of 1.0, 2.0, and 4.0 kHz) at the 98% percentile point (Yellin et al., 1989). Dubno et al. (1995) showed that the relationship between PTA (average of 0.5, 1, and 2 kHz) and PBmax was nonlinear, and so a lower confidence limit (CL) based on a linear regression was not appropriate to determine the lower boundary of PBmax associated with a particular degree of hearing loss.
Dubno et al. (1995) adopted a different approach for obtaining CL for PBmax as a function of PTA. They recruited a group of listeners (n = 212) with 407 hearing-impaired ears. The listeners were grouped into 11 groups based on PTA, and the distribution of PBmax scores was determined for each group. Ears were grouped so that a sufficient number of ears belonged to each PTA group. No specific distribution of PBmax scores within each PTA group was assumed, and the lower boundary of the 95% CL was determined using computer simulation. For each PTA group, 2,500 samples of normally distributed PBmax scores were generated using the mean determined from experimental data and 1.62 times the standard deviation (SD) estimated from the binomial equation (see Equation 1 in Dubno et al., 1995). Within each PTA group, a one-tailed 95% CL was estimated from the simulation data. A sigmoid function was then fitted through the simulated CL, yielding a continuous 95% CL for PBmax as a function of PTA.
To avoid the problem of variable distribution of data across different PTA groups, Dubno et al. (1995) used computer simulations with assumed normality for estimating the lower boundary for PBmax. The lower boundary was estimated by measuring the one-tailed 95% CL (i.e., 5% percentile or 0.05th quantile). The PBmax distribution is variable across different degree of hearing loss with few being normal and the majority being highly skewed and multimodal (Dubno et al., 1995; Yellin et al., 1989). To avoid the assumption of normality and sampling errors encountered while subgrouping the population data (Le Cook & Manning, 2013), in the present study, the lower boundary of PBmax was estimated by fitting a nonlinear quantile regression (QR) for the 0.05th quantile. Hereafter, the 95% CL is used to represent the 0.05th quantile.
The present study employed a bootstrapped nonlinear QR (Feng et al., 2011; Koenker & Park, 1996). There are at least two motivations for use of nonlinear QR in the present study. First, unlike traditional regression methods such as least square and logistic regression, which models the mean of the target variable against the predictor variable, the QR models the impact of predictor variables on the target variable across the whole distribution. In addition, QR has no distributional assumptions and robustly handles extreme values and outliers of the target (Congdon, 2017; Das et al., 2019; Koenker & Bassett, 1978; Wei et al., 2019). Second, the change in PBmax with increase in PTA is not linear; PBmax changes only minimally between PTA < 20 dB HL and up to 40 dB HL, but at higher levels of PTA, PBmax can be dramatically reduced indicating a nonlinear relation between PTA and PBmax (Dubno et al., 1995).
In addition to PTA, PBmax scores are also influenced by age but to a smaller extent. Frequently, poorer PBmax scores are seen in older individuals (>60 years) compared with younger individuals (<60 years) when controlled for their PTA (Divenyi et al., 2005; Dubno et al., 2008; Jerger, 1992; Jerger & Hayes, 1977). Longitudinal studies have consistently documented a decline in PBmax with increasing age even after controlling for age-related difference in PTA (Divenyi et al., 2005; Dubno et al., 2008). Cross-sectional studies assessing the effect of age and hearing loss on PBmax have documented that hearing loss accounted for a larger portion of changes in PBmax, and age accounted for a smaller portion of the change (Dubno et al., 1997; Jerger, 1973; Wiley et al., 1998; Willot, 1991).
The relationship between PBmax and PTA will be different for each test material (Bess, 1983; Bess & Humes, 2008; McArdle & Hnath-Chisolm, 2010). Therefore, it will be inappropriate to apply the boundary of PBmax developed for one speech material with other speech materials. The lower boundary of PBmax estimated in the earlier studies was obtained for monosyllabic words in English (Dubno et al., 1995; Yellin et al., 1989). To the best of our knowledge, there are no earlier studies estimating the lower boundary for PBmax in Danish. As noted earlier, in addition to PTA, age also has a small effect on PBmax. Hence, the purpose of this study was twofold: (a) to assess the contribution of age and PTA on estimating the 95% CL of PBmax and (b) to derive the 95% CL of PBmax scores for Dantale I word lists and compare it with 95% CL reported by Dubno et al. (1995).
Method
Participants
Patients referred for hearing aid treatment with various degrees of hearing loss were recruited from the Region of Southern Denmark at Odense University Hospital and the Region North Jutland at Aalborg University Hospital. Participants who visited audiology clinics at these hospitals in the period from December 2016 until January 2018 were recruited. A total of 1,961 participants were recruited, and out of these, 1,096 were males and 865 were females. The age of these subjects ranged from 19 to 83 years with a mean age of 66.2, median of 68 and SD of 11.6. Of these, 1,514 were older than 60 years and 447 were younger than 60 years. All the participants underwent pure-tone audiometry and an otolaryngologic examination. From results of this test battery, it was determined that subjects enrolled in the current study did not require any surgical or medical treatment of their hearing loss apart from hearing aids.
For the current study, PTA is calculated by taking the average of air-conduction thresholds obtained at 0.5, 1, 2, and 4 kHz for both ears. The conductive and mixed hearing losses were determined by air-bone gap, that is, subjects having air-bone gap >20 dB were excluded from further analysis, but other subjects were included regardless of the specific etiology of cochlear hearing loss.
Procedure
Basic Audiological Evaluation
All the audiometric measurements were carried out in double-walled sound-treated rooms in both clinics. Based on the protocol of audiological evaluation in both clinics, a calibrated two-channel diagnostic audiometer (Madsen Astera 2, Type 1066; GN Otometrics, Taastrup, Denmark) was used to determine the pure-tone air-conduction (TDH-39; Telephonics, Farmingdale, NY and ER-3A; Etymotic Research, IL, USA) and bone-conduction thresholds (B-71; Radioear, Middelfart, Denmark) using the procedure described in ISO 8253-1 (2010). In one of the participating clinics, a calibrated middle ear analyzer was used to determine the middle ear status.
Maximum Speech Identification Scores (PBmax)
PBmax was obtained for both ears using the presentation of Dantale I word lists played from a CD developed by Elberling et al. (1989). Testing began with the better-hearing ear for participants with asymmetrical hearing loss; if hearing loss was equivalent in the two ears, testing began with the right ear. The 25-item list was presented in quiet at 30 dB above the SRT or at the most comfortable level in cases of severe hearing loss, where it was not possible to stimulate 30 dB above the SRT (Elberling et al., 1989). Masking in the nontest ear was introduced when necessary.
Statistical Analysis
QR is a statistical method for deriving the functional relationships between the outcome and the independent variables at arbitrary quantiles of a conditional probability distribution. Traditional linear regression estimates the conditional mean by minimizing the sum of squared errors, whereas QR estimates the conditional quantile function by estimating the parameters to minimize the weighted sum of deviations from the estimated quantile.
Let Yi be a response variable and Xi predictor vector for subject i (i = 1 to n). Yi is an independent observation of a continuous random variable with cumulative distribution function (cdf) FY (⋅). The QR model with τth quantile for the response Yi given Xi takes the form of Equation 1.


Model 1 of Nonlinear QR
Literature has documented that both PTA and age influence the PBmax scores (Dubno et al., 1995, 1997; Jerger, 1992), in turn influencing the derivation of the lower boundary of PBmax. A nonlinear equation with PTA and age as continuous independent variables and PBmax as dependent variable is given by Equation 3.
where
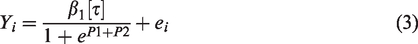
and

The nonlinear QR model, where Yi is the ith observation of the PBmax variable, that is, the total scores achieved at 30 dB above SRT expressed in percentage, and x1i is the ith observation on PTA (in dB HL); x2
i
is the ith observation on age in years; β1(τ) is the parameter that represents the asymptotic weight of the SIS; β2(τ) is a constant; β3(τ) is the rate at which PBmax varies with PTA; and β4(τ) is the coefficient for age. For the random error, the following distribution is assumed:
The QR analysis indicated that the association between response (PBmax) and predictor variables (PTA and age) at τ = 0.05 reached significance for PTA but not age, indicating that the age is not a significant factor in deriving the lower boundary of PBmax, that is, 95% CL (0.05th quantile). Hence, predictor variable age was removed from Model 1 in deriving the 95% CL.
Model-2 of nonlinear QR
The age component in Equation 3 is removed, and one independent variable (PTA) nonlinear function (i.e., sigmoid function; shown in Equation 4) was used for further analysis.

The nonlinear QR model, where Yi is the ith observation of the PBmax score, and xi is the ith observation on PTA (in dB HL); β1(τ) is the parameter that represents the asymptotic weight of the SIS; β2(τ) is a constant; and β3(τ) is the rate at which PBmax varies with PTA. For the mean zero, normal distribution is assumed for error terms:
A variation of the likelihood ratio test (based on the chi-squared distribution) was applied to the estimated parameters at the two different quantiles of the nonlinear QR model (τ = 0.05 and τ = 0.5) to test whether significant difference exists among coefficients of these quantiles (Koenker & Machado, 1999). The following hypothesis was considered—Ho:
In addition, the goodness of fit in a QR model is measured by R1(τ) (Koenker & Machado, 1999; Xu et al., 2015) which is an analogue of R2 for the linear mean regression. R1(τ) is defined in Equation 5.
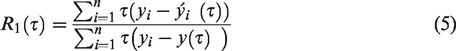
All the statistical analyses were performed using R software version 3.6 (R Core Team, 2019) and programmed with help of RStudio (RStudio Team, 2018), and data were plotted using the “ggplot2, pp. 89–107” package (Wickham, 2016). QR was performed using the “quantreg, p. 37” package (Koenker, 2019).
Results
Selecting the Predictor Variable
To define the 95% CL for PBmax scores, data from both ears of each subject were pooled, because the aim was to estimate the 95% CL of the distribution and not to test the effect of the ear. A total of 696 participants who had conductive or mixed hearing losses were excluded from further analysis. In addition, PBmax was not estimated in 49 individuals. Among them, approximately 10 ears have significantly high thresholds (>100 dB HL); thus, PBmax could not be estimated. Time constraints or significant difficulties in understanding the test procedure may have impeded PBmax estimation for the remaining 39 individuals. In total, 1,216 subjects (or 2,432 ears) were considered for further analysis. The mean age, thresholds at individual frequencies, PTA, and PBmax scores along with SDs are presented in Table 1.
Age, Pure-Tone Thresholds, Pure-Tone Average (PTA), and PBmax.

Note. SD = standard deviation.
Distribution of PTA Versus PBmax
The QR was adopted to predict PBmax with PTA as the predictor variable, as PTA is the most commonly used index of peripheral hearing loss (Gelfand, 2016; Schlauch & Nelson, 2015) and was used in the study of Dubno et al. (1995). To understand the distribution of PBmax as a function of PTA, the PTA was divided in 10 dB steps above 20 dB HL, and the distribution of PBmax for every PTA division is shown in Figure 1. It can be clearly seen from Figure 1 that the distributions of PBmax at the particular range of PTA are highly skewed. There are many scores above 90% for PTAs between 25 and 50 dB HL. In addition, very high PBmax (i.e., near 100%) is achieved with PTAs as high as 40–60 dB HL. These observations suggest that the relationship between PTA and PBmax is not linear, and therefore, a linear approach for deriving the upper and lower limits of quantiles (i.e., by linear regression) may not be appropriate. In addition to Figure 1, for the same PTA groups, mean PBmax, SD, skewness, and number of ears for each of the eight PTA groups are shown in Table 2.

Distribution of PBmax for Different PTA Groups. PTA = pure-tone average.
Mean, SD, and Skewness of PBmax from Binomial Distribution.
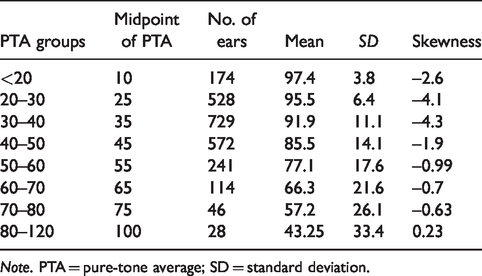
Note. PTA = pure-tone average; SD = standard deviation.
Deriving the 95% CL for PBmax Using Nonlinear QR
To estimate the 95% CL for PBmax, the distribution of PBmax scores for each PTA must be known. As detailed earlier, PBmax changes nonlinearly as a function of PTA, and also the distribution of the PBmax is variable across different ranges of PTA. Hence, nonlinear QR is used and employed to understand the distribution of PBmax scores as a function of PTA. The predicted nonlinear QR curves for the 95% CL using the sigmoid function are shown in Figure 2, with the estimated parameters, standard error of parameters, and R1 values of QR models in Table 3. From Table 3, it can be seen that the parameter estimates from the nonlinear QR model are significantly higher at median (τ = 0.5) compared with the 95% CL (τ = 0.05) with the similar amount of variance. The likelihood ratio test showed that the difference in the parameters for the two quantiles in QR model differs significantly (p < .001).

Scatter Plot Showing PBmax (in Percent) as a Function of PTA (dB HL). The solid line shows lower boundary of 95% CL, and the dashed line shows the median. All the curves were estimated using nonlinear quantile regression, and the shaded area around the curves indicates standard error of the estimate. CL= confidence limit.
Coefficients of Sigmoid Function for Both Quantiles (Median and 95% CL) Along With Standard Error, and R1.

*** p < .001.
Applying the 95% CL to the Experimental Data
Using Equation 4 and parameter values listed in Table 3, the values of PBmax at the median and lower boundary of 95% CL were estimated for PTA values ranging from 0 to 100 dB HL and are listed in Table 4. In addition to the values derived from Equation 4, Table 4 also provides the discrete values for the median and lower boundary of 95% CL for PBmax as applied to scores in increments of four. Using Table 4, it is possible to determine, for a particular PTA, if a score obtained using a 25-item list is below the 95% CL for PBmax.
Median and 95% Confidence Limit (CL) for PBmax as Derived by the QR Nonlinear Equation and Discretized for 25-Item Dantale I Word List.

Note. PTA = pure-tone average.
In addition, the 95% CL of PBmax associated with each PTA was plotted along with scores obtained using 25-item Dantale I word lists in Figure 2. From Figure 2, it is possible to determine the number of scores from the experimental data that fall outside the lower boundary of PBmax. As shown in Figure 2, 128 of 2,432 scores (or 5.2%) were lower than the 95% CL that is approximately 5% of scores that are expected to fall below the lower boundary, further confirming that the model calculations were performed appropriately.
Discussion
The 95% CL estimated using QR at the 0.05th quantile provided an approximate estimate, as the PBmax scores falling below were approximately 5%. These results were similar to those reported by Dubno et al. (1995), where approximately 5% of the subjects fall below the lower boundary for PBmax. For the purpose of comparison, the 95% CL estimated in the present study is plotted along with the 95% CL as estimated in Dubno et al. (1995) in Figure 3. From Figure 3, it can be observed that the lower boundary scores for the PTAs below 60 dB obtained in the present study were slightly higher (4–8%) and those for PTAs above 60 dB scores were lower in the present study (∼5%) than those estimated by Dubno et al. (1995). These differences likely stem from the differences in language and procedure used to estimate the lower boundary of the 95% CL.
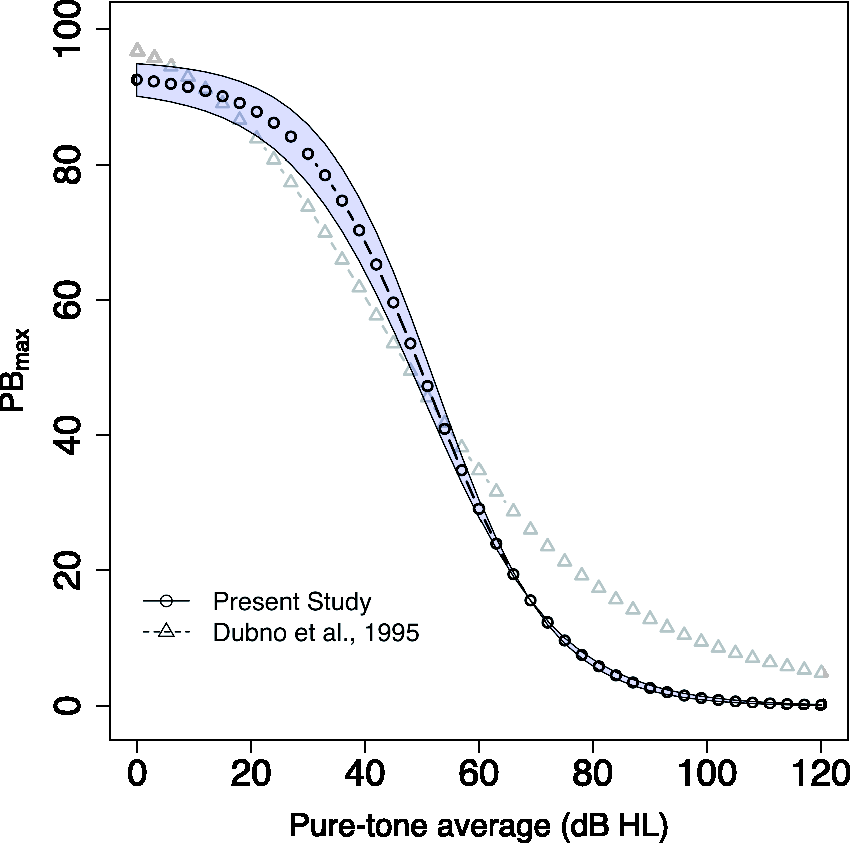
Comparison of 95% CL estimated with nonlinear quantile regression. The present study (open circle) compared to the 95% CL as estimated by Dubno et al., (1995) (open triangle). The shaded area indicates stranded error.
QR analysis indicated that age is not a significant factor in deriving the 95% CL of PBmax; probably the effect of age on PBmax is smaller than the degree of hearing loss. Therefore, the derived 95% CL for PBmax with only PTA is applicable for all ages. However, PBmax scores are influenced by age, as they are lower for older age groups as compared with younger age groups (Dubno et al., 1997; Jerger, 1992). Both cross-sectional and longitudinal studies have documented that hearing loss accounted for a larger portion of changes, and age accounted for a smaller portion of the change in in PBmax (Dubno et al., 1997, 2008; Jerger, 1973; Wiley et al., 1998; Willot, 1991).
Future directions for this work may include the following:
a. To assess the advantages and disadvantages of current approach in estimating 95% CL, future studies could compare the different approaches of estimating the 95% CL. These could be a nonlinear QR model, a robust CL using bootstrapping approach, and Dubno’s approach (Dubno et al., 1995). b. The current experiment studied the relation between PTA and PBmax. The speech intelligibility index (SII; American National Standards Institute, 1997) estimates the proportion of the total speech information available to the listener’s ear for a given speech material. In other words, SII provides information about audibility. Studying the relation between SII and PBmax in a larger population may be an informative direction for further understanding the perceptual difficulties accounted by audibility and with suprathreshold distortion.
Conclusion
The derived lower boundary (lower boundary of 95% CL) for the PBmax for the Dantale I word list allowed us to determine the measured PBmax scores disproportionately poor in relation to the degree of hearing loss. However, clinicians should be cautious because in the clinical practice, SISs were measured at a single suprathreshold level or preferably at the most comfortable level; hence, the measured score that is poorer than the lower boundary suggests that the score may be an underestimate of PBmax.
Footnotes
Acknowledgment
The authors thank two reviewers for helpful comments on earlier versions of this article.
Declaration of Conflicting Interests
The authors declared no potential conflicts of interest with respect to the research, authorship, and/or publication of this article.
Funding
The authors disclosed receipt of the following financial support for the research, authorship, and/or publication of this article: This work was primarily funded in part by the Innovation Fund Denmark (Grand Solutions 5164-00011B), Oticon, GN Hearing, and Widex-Sivantos Audiology and partners. The work is supported by all partners (University of Southern Denmark, Aalborg University, Technical University of Denmark, FORCE Technology – Technical-Audiological Laboratory, and Aalborg, Odense, and Copenhagen University Hospitals).