
Abstract
The medial olivocochlear reflex (MOCR) has been implicated in several auditory processes. The putative role of the MOCR in improving speech perception in noise is particularly relevant for children who complain of listening difficulties (LiD). The hypothesis that the MOCR may be impaired in individuals with LiD or auditory processing disorder has led to several investigations but without consensus. In two related studies, we compared the MOCR functioning of children with LiD and typically developing (TD) children in the same age range (7–17 years). In Study 1, we investigated ipsilateral, contralateral, and bilateral MOCR using forward-masked click-evoked otoacoustic emissions (CEOAEs; n = 17 TD, 17 LiD). In Study 2, we employed three OAE types: CEOAEs (n = 16 TD, 21 LiD), stimulus frequency OAEs (n = 21 TD, 30 LiD), and distortion product OAEs (n = 17 TD, 22 LiD) in a contralateral noise paradigm. Results from both studies suggest that the MOCR functioning is not significantly different between the two groups. Some likely reasons for differences in findings among published studies could stem from the lack of strict data quality measures (e.g., high signal-to-noise ratio, control for the middle ear muscle reflex) that were enforced in the present study. The inherent variability of the MOCR, the subpar reliability of current MOCR methods, and the heterogeneity in auditory processing deficits that underlie auditory processing disorder make detecting clinically relevant differences in MOCR function impractical using current methods.
Keywords
Introduction
The auditory cortex exerts its influence on peripheral hearing mechanisms via feedback loops. This feedback enables fine-tuning of bottom-up signal encoding (Khalfa et al., 2001; León, Elgueda, Silva, Hamame, & Delano, 2012; Perrot et al., 2006; Winer, 2006; Xiao & Suga, 2002). The final leg in this feedback loop is the medial olivocochlear reflex (MOCR) in the brainstem. The MOCR inhibits outer hair cell (OHC) activity in the cochlea, reducing the OHC gain (Gifford & Guinan, 1987; Liberman & Brown, 1986; Siegel & Kim, 1982; Warr & Guinan, 1979). Among other putative MOCR functions, this gain reduction is thought to aid signal detection in noise (for reviews, see Guinan, 2006; Lopez-Poveda, 2018). The role of the MOCR in signal detection in noise is particularly relevant for children who complain of listening difficulties (LiD). These children are typically referred to audiology clinics for an auditory processing disorder (APD) evaluation as difficulty listening in noisy environments, despite clinically normal audiograms, is their primary complaint (Chermak, Tucker, & Seikel, 2002). The goal of this study is to determine whether the MOCR activity is different in children with LiD given MOCR’s putative role in aiding signal detection in noise.
On one hand, prior studies, including ours, have shown small but significantly reduced MOCR function in individuals with LiD or other developmental delays when compared with their typical controls (Boothalingam, Allan, Allen, & Purcell, 2015; Garinis, Glattke, & Cone-Wesson, 2008; Muchnik et al., 2004). On the other hand, musicians, known for their exceptional auditory abilities, including speech-in-noise (Moreno & Bidelman, 2014; Patel, 2014; Strait & Kraus, 2011), demonstrate larger than typical MOCR activity (Brashears, Morlet, Berlin, & Hood, 2003; Micheyl, Khalfa, Perrot, & Collet, 1997; Perrot, Micheyl, Khalfa, & Collet, 1999). However, neither the superior MOCR function (Stuart & Daughtrey, 2016) nor the speech-in-noise perception in musicians (Boebinger et al., 2015; Madsen, Whiteford, & Oxenham, 2017; Ruggles, Freyman, & Oxenham, 2014) is fully reconciled across studies. Notwithstanding, it is conceivable that MOCR function exists in a continuum, with the lower end occupied by individuals with LiD and the higher end by individuals such as musicians. Therefore, in addition to the posited role of MOCR in unmasking signals in noise, it is tempting to postulate that the MOCR may play a role in LiD. Indeed, the working hypothesis of the studies that typically investigate MOCR function in LiD is that a compromised MOCR function could potentially contribute to their speech-in-noise difficulties. However, evidence for this hypothesis has been marked with controversy as other groups have failed to demonstrate a compromised MOCR function in children or adults with LiD (Butler, Purcell, & Allen, 2011; Clarke, Ahmmed, Parker, & Adams, 2006). Further, many studies that report a significant difference suffer from methodological issues.
Summary of Studies Investigating the MOCR–LiD Relationship.

Note. MOCR = medial olivocochlear reflex; APD = auditory processing disorder; OAE = otoacoustic emissions; SNR = signal-to-noise ratio; MEMR = middle ear muscle reflex; CEOAE = click-evoked otoacoustic emissions; SPL = sound pressure level; peSPL = peak equivalent sound pressure level; BBN = broadband noise; EA = equivalent attenuation; SPIN = speech perception in noise; TEOAE = transient-evoked otoacoustic emissions; SSW = staggered spondaic word test; DPOAE = distortion product otoacoustic emissions.
To further our understanding of the role of the MOCR in LiD, in the present study, we comprehensively evaluated MOCR function in two experiments. In the first experiment, we measured bilateral MOCR using click-evoked OAEs (CEOAEs) in children with LiD and their typically developing (TD) peers. We hypothesized that bilateral MOCR activity is compromised in children with LiD. We predicted that children with LiD will demonstrate, in addition to reduced MOCR functioning, deviant binaural interaction of the MOCR. This prediction is based on our prior work that demonstrated an intriguingly lower MOCR–binaural interaction component (mBIC) in typical children compared with adults (Boothalingam, Macpherson, Allan, Allen, & Purcell, 2016). In addition, individuals with LiD and related disorders have been reported to demonstrate reduced binaural interaction assessed using both behavioral and electrophysiological methods (BIC; Gopal & Pierel, 1999; Roush & Tait, 1984). In the second study, we compared contralateral noise-elicited MOCR activity as measured using three different OAE types (CEOAEs, stimulus frequency [SF] OAEs, and distortion product [DP] OAEs) in the LiD and TD groups. We hypothesized that the difference in generation mechanisms of OAEs and the relative stimulus levels influence MOCR measurement (Abdala, Mishra, & Williams, 2009). We predicted that the differences in MOCR estimation across OAE types will lead to a group/OAE type interaction.
Materials and Methods
Participants
In Study 1, 47 children in the age range of 7 to 17 years took part. Twenty-one were TD children (TD group; mean age: 11.4 ± 2.4 years; 13 females), and 26 children were referred to our in-house audiology clinic with LiD (LiD group; age = 9.9 ± 2.8 years; 7 females). In Study 2, a total of 72 children in the same age range as Study 1 participated. The 47 children who took part in Study 1 also took part in Study 2. There were 25 TD children (age = 11.4 ± 2.7 years, 14 females) and 47 children in the LiD group (age = 9.6 ± 2.6 years, 9 females).
Screening
All children had hearing thresholds of 20 dB HL or better at octave intervals between 0.25 and 8 kHz (GSI-61, Grason-Stadler Inc., MN) and normal middle ear function as determined by clinical tympanometry: type-A tympanogram, middle ear pressure between ±50 daPa, and static compliance between 0.3 and 1.5 mmho (GSI-TympStar, Grason-Stadler Inc., MN). All children also had contralateral acoustic reflex thresholds >70 dB HL for steady-state broadband noise. Children also underwent a screening DPOAE measurement (Integrity v-500, Vivosonic Inc., ON) to confirm the presence of OAEs. Screening OAEs were performed with primary tones (f1/f2) presented at 65/55 dB sound pressure level (SPL) between 0.75 to 6 kHz in half-octave intervals.
APD Testing
Children in the LiD group underwent an APD test battery similar to that used by Boothalingam, et al. (2015; Boothalingam, Allan, Allen, & Purcell, 2019). Briefly, this procedure included three standard clinical tests—the staggered spondaic word test (SSW; Katz, 1998), words in ipsilateral competition (WIC; Ivey, 1969), and pitch pattern sequence test (PPT; Pinheiro, 1977)—and two adaptive psychoacoustic tests—gap detection test (GDT) and difference limen for frequency (DLF). The two psychoacoustic tests were developed in-house and employed a three-alternative forced-choice paradigm based on the methods proposed by Moore, Ferguson, Halliday, and Riley (2008) and explained in detail in Allan (2011). All tests were administered in accordance with their respective manuals and were interpreted according to published age-specific normative data.
There were a total of 47 children in the LiD group when pooled across the two studies. Of this 47 children with LiD, 32 were diagnosed as having APD, that is, scored two standard deviations (SDs) below the normative expectation in at least two tests (American Speech-Language-Hearing Association [ASHA], 2005). Of the 15 children who did not obtain the diagnosis, 11 children failed in one test, and 4 children passed all tests. In both studies, irrespective of the diagnosis of APD, all children referred to our clinic for LiD were grouped together in the LiD group in line with our previous studies (e.g., Boothalingam et al., 2015, 2019). We also chose to use the term listening difficulties in place of APD because it captures children with APD and children who passed the test battery but still complain of LiD.
OAE Recording Setup
All stimuli were digitally generated in MATLAB (Mathworks Inc, MA) and played through a digital-to-analog converter (National Instruments 6289 m-series, TX) at a sampling rate of 32 kHz to three separate programmable attenuators (PA5; Tucker-Davis Technologies, FL) that controlled the output signal levels. The PA5 analog outputs were power amplified (SA1; Tucker-Davis Technologies, FL) and fed to three separate ER-2 loudspeakers (Etymotic Research Inc, IL). Clicks, tones, and the ipsilateral MOCR elicitor were presented via two ER-2 s coupled to an ER10B+ (Etymotic Research Inc, IL) probe assembly that was inserted flush to the participants’ test ear canal opening (ipsilateral-channel) using a flexible plastic tip. An additional ER-2 delivered the contralateral MOCR elicitor in the opposite ear (contralateral channel) coupled to the ear using a single-use foam tip. This signal-to-channel mapping for both studies, and across OAE types, is illustrated in Figure 1.
Schematic representation and temporal sequence of events for all OAE types employed in the study: (a) forward-masked CEOAE, (b) CEOAE, (c) SFOAE, and (d) DPOAE. Channels (Ch) indicate separate physical transducers: I = ipsilateral and C = contralateral. Numbers in the figure are duration (ms) of each epoch and trial across OAE types. Note that the sizes of each element in the figure are made disproportionate to their duration to show shorter events clearly.
Stimuli were calibrated using a Type-2250 sound level meter (Bruël and Kjær, Denmark) and an ear simulator Type-4157 (IEC 711; Bruël and Kjær, Denmark). Further details regarding calibration are provided separately for each OAE type later. Responses were recorded using the microphone in the ER-10B+ probe system with the preamplifier gain set at +40 dB. The recorded signal was then fed to a bandpass filter (Frequency Devices Inc., IL) that filtered responses from 0.4 to 10 kHz and applied a further 20 dB gain. The filtered responses were digitized by an analog-to-digital converter (National Instruments 6289 m-series, TX) that applied another 6 dB of gain prior to conversion. Stimulus delivery and response acquisition were controlled using custom programs developed in LabView (National Instruments, TX).
Stimuli and Response Characteristics
The temporal order of stimulus presentation for all OAE types is illustrated in their respective panels in Figure 1. Stimulus levels for all OAE types were chosen to maximize OAE amplitude while minimizing the possibility of the OAE stimulus evoking the ipsilateral MOCR (Boothalingam & Purcell, 2015; Guinan, Backus, Lilaonitkul, & Aharonson, 2003) and the MEMR (Guinan et al., 2003). All OAE evoking stimuli were presented in “blocks,” the duration of which varied across the three OAE types (see Figure 1). Block durations were dictated by (a) the need to fit an integer number of cycles (for tonal stimuli) within a block that was compatible with our hardware setup and (b) the minimum duration that was long enough to elicit a sustained MOCR activity. Blocks, with and without elicitors, were concatenated to make a “trial” that was repeated several times (varied across OAEs) to obtain robust OAEs. The shorter block and trial arrangement offers protection against slow drifts that may affect OAEs obtained separately with and without elicitor in one long presentation (Goodman, Mertes, Lewis, & Weissbeck, 2013; Guinan, 2014; Guinan et al., 2003).
CEOAE stimuli and response
The CEOAE stimuli and response characteristics used in both studies (1 and 2) are similar to our prior work (Boothalingam et al., 2016). Briefly, CEOAE were evoked using unfiltered clicks, 93.75 μs in duration, presented at 55 dB peak equivalent (pe)SPL and at a rate of 41.67 Hz. This click rate translated to an “epoch” (click and CEOAE combination) duration of 24 ms. An iso-voltage calibration was performed to set the click level in an IEC 711 ear simulator. CEOAEs and noise metrics were obtained in the time window 5–20 ms post click presentation and digitally bandpass filtered from 0.6 to 6 kHz using a fourth-order zero delay Butterworth filter. Epochs with root-mean-squared (RMS) amplitudes that were two SDs above the mean (within-individual) were rejected. Response reliability was estimated by the correlation between consecutive epochs separated into two buffers. While noise was estimated as the standard deviation (SD) between the two buffers, CEOAE was the mean of the two buffers. Noise and CEOAE waveforms were Fourier transformed, and the magnitudes between 0.6 and 6 kHz were used to estimate the SNR at each frequency. CEOAE frequencies with SNR < 12 dB were not included in the spectral average. Results of some of the data quality metrics used in the study are provided in Figure 2. In Figure 2(a), the distribution of SNR across OAE types and groups is plotted. After rejection of data below 12 dB SNR, the median SNR across OAE types was around 20 dB, except for the reflection type DPOAEs where it was around 15 dB. This pattern is expected because DPOAE reflection emission is evoked by much lower stimulus level, by the wavelets that emanate from the f2 place (Kalluri & Shera, 2001; Shera & Guinan, 1999). Nonetheless, all these SNR levels are conducive for reliable estimation of the MOCR (Goodman et al., 2013). In Figure 2(b), the distribution of the percentage of data rejected (frequency points after Fourier transformation of the response) due to the presence of enhancements, as opposed to inhibition due to the presence of MOCR elicitor, is plotted across OAE types and groups. To further demonstrate such enhancements, a representative sample (from one participant in the TD group) of CEOAE spectra is provided in Figure 2(c). The frequencies where the magnitude of the CEOAE in the with-noise condition is higher than the baseline are highlighted with orange circles. These highlighted data points were not included in the MOCR calculation to avoid changes in the CEOAE magnitude potentially arising from spurious phase/level-related changes. Further discussion on this topic is included in the Discussion section (3. Reliability of MOCR methods and enhancements in OAE magnitude).
Data quality metrics. Data are plotted as violin plots in Panels (a) and (b). In Panel (a), the distribution of SNR across OAE types (from both studies) is plotted. In Panel (b), the distribution of data rejected due to enhancements in OAE level is plotted. In both panels, the “violin” colors differentiate the OAE types. For each color, darker shades are data from the TD group, and lighter shades are from the LiD group. The shape of the violin is based on the kernel density distribution fitted to the data (Hintze & Nelson, 1998). Included within each violin are traditional box plots where the white circle is the median, the thick black line around the white circle is the interquartile range, and the thin black line is the data range. The horizontal, colored, line is the mean. Individual colored circles within each violin are raw data. The OAE types are presented as x axis labels in both panels. CEOAE 1 and 2 are CEOAEs from Studies 1 and 2, respectively. CEOAE 1 is the mean of all three literalities from Study 1. DPOAEm is mixed DPOAE, DPOAEd is distortion component, and DPOAEr is reflection component of the DPOAE. In Panel (c), a representative CEOAE sample from one participant (TD group) in the baseline and with-noise conditions, and the noise floor + 12 dB (original noise floor is 12 dB below the dashed line) is presented. Enhancements are highlighted with orange filled circles. Data points below the noise floor + 12 dB line and those with enhancements were rejected.
MOC inhibition of CEOAEs (explained later) obtained in Pascals was expressed as normalized (re: baseline CEOAE amplitude) percent change in CEOAE level (ΔCEOAE). While CEOAE experiments in both studies (1 and 2) used the same click and elicitor, their duration and order of presentation varied.
Study 1: Forward-masked-CEOAEs
To obtain ipsilateral and bilateral MOC inhibition of CEOAEs, we used a forward masking paradigm like Boothalingam et al. (2016). In this method, as illustrated in Figure 1(a) for the middle three blocks, the elicitor was presented first to activate the MOCR, and the OAE evoking clicks followed a 2-ms gap for the next 96 ms. The 96-ms long block contained four click epochs that were 24 ms apart (41.67 Hz). This arrangement was chosen to capture the majority of the MOC inhibitory effect that has a decay time of at least 100 ms (Backus & Guinan, 2006). MOCR elicitors were uniform broadband noise presented at 60 dB SPL for 478 ms duration (Berlin, Hood, Hurley, Wen, & Kemp, 1995; Boothalingam, et al., 2016) with 20 ms onset/offset ramps to avoid startle responses. A single “trial” contained five click blocks where the first and last blocks served as baselines and the middle three blocks captured the forward-masked ipsilateral, contralateral, and bilateral MOCR activity, respectively. Trials were repeated 400 times to acquire 1,600 click epochs (4 clicks × 400 repetitions) in each block. All click epochs within a block were averaged to obtain an average CEOAE. However, because there were two baselines (first and last block), there were twice (3,200) the number of click epochs in the baseline condition. In addition to estimating CEOAE across lateralities, we also calculated the mBIC. The mBIC, like its electrophysiological counterpart (BIC), is calculated by subtracting the bilateral MOCR effects (ΔCEOAE) from the sum of unilateral MOCR effects.
Study 2: Contralateral MOCR activation
CEOAEs in Study 2 were obtained using the traditional contralateral MOCR elicitor method. Here, the blocks were 2.544 s long and contained 106 click epochs. As illustrated in Figure 1(c), one block was presented with the contralateral elicitor and the other without. The two blocks were separated by 0.528-second silent gaps to allow the MOCR to return to baseline functioning (Backus & Guinan, 2006). Trials were repeated 20 times to acquire 2,120 click epochs for both with- and without-noise blocks. The difference in the number of clicks obtained between Studies 1 and 2 was largely due to time restrictions as Study 1 took much longer to complete. In our experience, typically, around 1,000 clicks are sufficient to obtain CEOAEs with high enough SNR for MOCR measurements. Therefore, both studies have an adequate number of click epochs to obtain high-quality CEOAEs. Also, as evident from Figure 2(a), the SNR distributions of CEOAEs obtained in the two studies seem to overlap considerably.
SFOAE stimulus and response
Probe tones presented at 40 dB SPL in the frequency range between 0.928 to 1.248 kHz at 16 Hz intervals were used to evoke SFOAEs. This frequency region, approximately representing the 1 kHz region, was chosen based on prior evidence for larger MOCR activity (Lilaonitkul & Guinan, 2012; Zhao & Dhar, 2009). Intracochlear suppressor tones corresponding to each probe-tone (where, suppressor frequency = probe frequency + 16 Hz) with linear rise/fall ramps of 50 ms duration and 60 dB SPL in level were used according to the suppression method (Brass & Kemp, 1993; Guinan, 1990) to extract SFOAEs using discrete Fourier transforms. As illustrated in Figure 1(b), the probe was presented continuously for the duration of one trial with three blocks. While the probe and the probe and suppressor combination in the first two blocks were used to extract baseline SFOAE, the probe and suppressor (second block) and the probe and contralateral elicitor (third block) combination provided the MOCR inhibited SFOAE. The difference in SFOAE magnitude between the first and last blocks provided the SFOAE-estimated MOCR magnitude. Like CEOAEs, SFOAE-estimated MOCR was expressed in Pascals to obtain a normalized (re: baseline SFOAE level) percent change metric (ΔSFOAE). Each trial was repeated at least five times to obtain reliable SFOAEs. Data quality was monitored both online and offline. Based on the online analysis, additional epochs were recorded for every noisy epoch (if RMS amplitude exceeded 0 dB SPL in 0.5 to 0.9 kHz band), for clipped epochs, or if the SNR was lower than 9 dB. Offline, epochs with RMS amplitude larger than mean + 2 × SD were rejected prior to data analysis. The RMS levels of the tones and the elicitor were calibrated in the IEC 711 coupler. In addition, an in-the-ear calibration of the tones was carried out before every measurement to produce the desired SPL in the ear canal at the probe tip.
DPOAE stimulus and response
The primary tones, f1 (from 1231 Hz to 2462 Hz), and f2 (from 1502 Hz to 3003 Hz) were swept exponentially from their respective start to endpoints at the rate of 8 s/octave. The frequency difference between the primaries was maintained at a constant ratio (f2/f1) of 1.22 and levels (L1/L2) at 60/50 dB SPL producing a corresponding 2f1-f2 DPOAE in the frequency range from 960 Hz to 1920 Hz. One block was 8.54 s long and contained both primaries, either with or without the contralateral elicitor. Blocks were separated by 0.676 s to allow MOCR to return to baseline functioning (Backus & Guinan, 2006). Therefore, one trial was 18.432 s long and was repeated 20 times.
The use of exponential sweeps during recording allowed for the use of the least squares fit algorithm (LSFA) as described by Long, Talmadge, and Lee (2008) to separate the distortion and reflection components (Kalluri & Shera, 2001; Knight & Kemp, 2001; Talmadge, Long, Tubis, & Dhar, 1999) of the 2f1-f2 DPOAE. The output of the LSFA algorithm, for the ear canal recorded waveforms, provided amplitude and phase as a function of sweep frequency. This information was used to convert the signal from the frequency- to the time domain using inverse Fourier transform. Under ideal circumstances, the difference in time of arrival of the two DPOAE components must reveal itself as two distinct peaks in the time domain. However, the separation between the time domain peaks is not homogenous across participants and sometimes multiple peaks occur. Therefore, we manually selected the cutoff time between the two components. This was done by moving the cutoff point in the form of a “component separating slider” along the signal in the time axis. The final cutoff was set at a time point where two distinct phase responses across frequency—flat for distortion component and rapidly changing for reflection component—was clearly visible. Two rectangular filters were then applied on either side of the cutoff point to Fourier transform the signals into distortion and reflection component OAE magnitudes. Calibration of tones and noise for the DPOAE experiment was the same as the SFOAE experiment.
DPOAE components were separated to avoid spurious enhancements in the DPOAE amplitude due to MOCR activation. Such enhancements presumably occur due to the interaction between the reflection and distortion components owing to their relative phase changes with MOCR activation (Abdala et al., 2009; Deeter, Abel, Calandruccio, & Dhar, 2009). The difference in amplitude as a function of frequency between with- and without- elicitor conditions was obtained to quantify the MOCR effect on both separated and unseparated DPOAE components. Prior to applying LSFA, noisy epochs were rejected by comparing RMS level across epochs (1.024 s length of data). The noisiest epochs were rejected until no further decrement in SNR was observed.
Data Collection Procedures
Final n-Size Across OAE Types for Both Studies After Data Postprocessing for Quality.

Note. CEOAE = click-evoked otoacoustic emissions; SFOAE = stimulus frequency otoacoustic emissions; DPOAE = distortion product otoacoustic emissions; LiD = listening difficulties; TD = typically developing; mix = mixed/composite DPOAE; dis = distortion type DPOAE; ref = reflection type DPOAE.
Experimental Procedures
During data acquisition, participants sat in a comfortable chair in a double-walled sound attenuated booth (Eckel Industries, ON) and watched a silent closed-captioned movie. They were encouraged to relax and swallow as few times as comfortable. All OAEs were recorded from only one ear per participant. The ear being tested was the ear with the larger DPOAE amplitude obtained during the screening process. The nature of the study was explained prior to obtaining written informed assent from every participant and informed consent from participants’ parent/caregiver. Participants were compensated for their time with gift cards toward books or school supplies. All study procedures were approved by the Health Sciences Research Ethics Board of Western University, Canada.
Test for MEMR
In addition to recruiting participants with high enough ARTs (>70 dB HL) and using an elicitor level that was less likely to elicit the MEMR (60 dB SPL), we employed three additional metrics to test for MEMR activation.
In Study 1, a click-based test used in our prior work was employed (Boothalingam, Kurke, & Dhar, 2018; Boothalingam & Purcell, 2015). This test is based on the hypothesis that a significant MEMR would cause an increase in stimulus level due to an increase in impedance offered by the stiffer ossicular chain. A level increase of 1.4% (or 0.12 dB) has been suggested as an indication of MEMR activation (Abdala, Dhar, Ahmadi, & Luo, 2014). To test for such changes in level, a 125 -μs window around the first trough of the click (and it is ringing) waveform was chosen, and the RMS levels within this window for elicitor-on/off conditions were compared. By choosing a region with high SNR and a single trough, we aimed to minimize the number of frequencies that may be involved in the estimation of the RMS amplitude. As seen in Figure 3(a), changes in the presence of MOCR elicitors do not exceed ±0.075 dB for any of the three lateralities (ipsilateral, contralateral, and bilateral). A further indication of MEMR activation would be a larger change in the stimulus level for the bilateral elicitor condition due to increased stimulus energy from binaural summation. However, the stimulus level changes in the bilateral condition were similar to either unilateral condition, and an analysis of variance (ANOVA) test does not show an effect of laterality, F(2, 68) = 0.26, p = .74, at the group level. Taken together, these results suggest that the MEMR was likely not activated (but see the third method in the final paragraph of this section).
Violin plot demonstrating tests for the MEMR. Panel (a) shows the change in click (Δstimulus level) across the three lateralities in Study 1, and Panel (b) shows SFOAE group delay in the with contralateral elicitor condition in Study 2. The dashed gray line in Panel (a) is the normalized stimulus level in the baseline condition (no forward masker). Violin colors differentiate the CEOAE laterality. For each color, darker shades are data from the TD group, and lighter shades are from the LiD group (see Figure 2 caption for details on violin plots).
In Study 2, an SFOAE group delay-based metric was used to detect MEMR activation. The rationale for the SFOAE method is that the MEMR-induced SFOAE group delay changes will produce very short delays owing to changes in the middle ear impedance (Guinan et al., 2003; Zhao & Dhar, 2011). This is because the MOCR-induced changes in SFOAE level and phase occur only within the cochlea; therefore, the resulting SFOAE would still produce relatively long group delays commensurate with their round-trip travel time (Guinan et al., 2003; Zhao & Dhar, 2011). A group delay of around 10 to 11 ms would be expected in the current study given that the SFOAEs are generated around the 1 kHz region. SFOAE group delay was calculated from the slope of the SFOAE phase as a function of frequency (Boothalingam et al., 2015; Guinan et al., 2003; Zhao & Dhar, 2011). As seen in Figure 3(b), group delays of all included participants were comparable with 10 ms, the least being 8.44 ms. This result presumably suggests that the SFOAE level changes reported in the present study are likely due to the MOCR, and not the MEMR (but see the third method below).
Neither method previously employed is infallible. For instance, depending on the frequency, an MEMR activation may either increase or decrease the stimulus level (Feeney & Keefe, 1999; Wojtczak, Beim, & Oxenham, 2017). Spontaneous (S) and synchronized spontaneous (SS) OAEs add further complexity as they add MOCR-mediated effects to the stimulus that may mask MEMR mediated stimulus level increase (Marks & Siegel, 2017). Therefore, an additional criterion was imposed: conditions where the MOCR-mediated OAE change was larger than the group mean + 2 × SD were rejected. Overall, one participant in the TD group (in SFOAE) and one participant in the LiD group (in DPOAE reflection emission) was rejected for MEMR activation across two studies, and this was based on the mean + 2 × SD criteria. Even with this additional metric in place, it is not a guarantee that the presence of MEMR can be detected accurately. This is because the mean + 2 × SD criterion depends on the quality of the OAEs. Analysis of the same data presented here at a lower SNR criterion led to the rejection of a different participant. Even if an accurate MEMR detection test is in place, a question that remains to be answered is what effect does MEMR activation have on the observed MOCR, or how much MEMR is tolerable, especially for clicks? Therefore, until methods that are robust to SNR and S/SSOAE influence are developed and the understanding of the influence of the MEMR is improved, MOCR metrics must be treated with caution.
Results
Study 1: MOCR Strength Is Not Different Between Groups for Unilateral and Bilateral Conditions
Raw and mean ΔOAE across all elicitor lateralities and the mBIC are presented in Figure 4. First, group effects and Group × Laterality interactions were tested using a repeated measure (RM)-ANOVA with Greenhouse-Geisser corrections applied for degrees of freedom when sphericity was violated. Contrary to our prediction and prior reports (Boothalingam et al., 2016; Muchnik et al., 2004), there were no group effects, F(1, 32) = 0.88, p = .36, or Group × Laterality interactions, F(1.9, 61.5) = 1.98, p = .15. This result suggests that the strength of the MOCR does not vary between LiD and TD groups.
Study 1 MOCR effect across the three lateralities and the mBIC. In Panel (a), normalized mean MOCR inhibition (%), that is, ΔCEOAE, for the different lateralities is plotted. The mBIC is plotted in Panel (b). In Panel (b), the dashed gray line at 0 represents the condition ipsilateral + contralateral MOCR = bilateral MOCR. As such, negative values indicate larger bilateral MOCR, and positive values indicate smaller bilateral MOCR re: ipsilateral + contralateral MOCR. Violin colors differentiate the CEOAE laterality. For each color, darker shades are data from the TD group, and lighter shades are from the LiD group (see Figure 2 caption for details on violin plots).
There was, however, a significant main effect of laterality, F(1.9, 61.5) = 99, p < .001, η2Partial = 0.76, owing to the larger bilateral ΔCEOAE (see Figure 4(a)). Post hoc tests after false discovery rate (FDR; Benjamini & Hochberg, 1995) corrections with data collapsed across groups showed a significant difference between bilateral ΔCEOAE and both ipsilateral—mean difference [MD] = 12.3%, 95% confidence interval [95% CI] = ±2.5%, t(33) = 10.2, p < .001—and contralateral—MD = 13.3%, 95% CI = ±2%, t(33) = 13.5, p < .001—ΔCEOAE. There was no difference between ipsilateral and contralateral ΔCEOAE— MD = 1.1%, 95% CI = ±2%, t(33) = 1.1, p = .3—consistent with some prior studies that show similar MOCR strengths between ipsilateral and contralateral MOCR effects (Berlin et al., 1995; Lilaonitkul & Guinan, 2009). However, frequency-specific differences between ipsilateral and contralateral activation and tuning pattern of the MOCR have been reported when measured using SFOAEs (Lilaonitkul & Guinan, 2012). Further, an independent sample t test showed no significant difference in mBIC between the two groups, MD = −1.97%, 95% CI = ±5.9%, t(32) = −0.75, p = .12, as evident in Figure 4(b). The lack of difference between groups for mBIC is contrary to BIC studies that show reduced binaural interaction in children with LiD (Delb, Strauss, Hohenberg, & Plinkert, 2003; Gopal & Pierel, 1999).
Two secondary analyses (within and across epoch) were conducted to test whether group differences exist when temporal aspects of the MOCR are considered. In the first temporal analysis, the CEOAE waveform (5–20 ms) within each epoch was separated into six 2.5-ms long sequential time windows (see Figure 5(a–c)). Individual ΔCEOAE were then calculated for each of the six time windows in the same manner as the original ΔCEOAE earlier, with the corresponding no-elicitor time windows as the reference. Mean ΔCEOAE across time windows are plotted in Figure 5 for both groups. RM-ANOVA with time, elicitor laterality, and the group as independent variables and ΔCEOAE as a dependent variable did not show any significant group effects or interactions (p > .05), consistent with the original ΔCEOAE analysis earlier. There was again a significant effect of the elicitor, F(2, 64) = 61.5, p < .001, η2Partial = 0.66. In addition, there was a significant effect of time, F(5, 160) = 10.7, p < .001, η2Partial = 0.25. There were no interactions between time × elicitor (p > .05). When collapsed across group and elicitor laterality, post hoc tests suggested that the MOCR inhibition increases with time, substantially beyond 10 ms. Because an analysis of MOCR across time is not the primary focus of this study, these post hoc results are not included in this report. It should, however, be noted that because consecutive click epochs within the 96 ms block (see Figure 1(a)) were collapsed, this analysis is not a true “temporal” analysis. The across time-window difference in MOCR activity likely reflects MOCR effects that are typically stronger for frequencies in the range of 0.8–3 kHz relative to higher frequencies (Lilaonitkul & Guinan, 2012; Zhao & Dhar, 2012). Due to frequency dispersion in the cochlea, OAEs at this narrow band of frequencies appear in the ear canal later compared with higher frequencies. For instance, 1 kHz is thought to have a delay of around 10 ms (Shera, Guinan, & Oxenham, 2002, 2010). This frequency-delay relationship likely results in larger MOCR effects at and beyond the 10 ms CEOAE delay as seen in Figure 5(a) to (c).
Temporal analysis. analysis of ΔCEOAE across different time scales. Within-epoch analysis is shown in the top row: Panels (a), (b), and (c) represent ipsilateral, contralateral, and bilateral elicitor conditions, respectively. Mean ΔCEOAE obtained in successive 2.5-ms temporal bins (x axis) is plotted for both TD (circles, darker shades) and LiD (squares, lighter shades). Across-epoch analysis is shown in the bottom row; Panels (d), (e), and (f) represent ipsilateral, contralateral, and bilateral elicitor conditions, respectively. Mean ΔCEOAE (for the entire epoch duration 5–20 ms) obtained in four successive epochs following elicitor cessation is plotted for both TD (circles, darker shades) and LiD (squares, lighter shades). In the bottom panels, time on x axis also includes the 2-ms silent period following elicitor cessation (see Figure 1). Error bars represent 1 SD.
In the second temporal analysis, shown in Figure 5(d) to (f), an across-epoch analysis was carried out. This is a true temporal analysis as the temporal aspects of the CEOAE were preserved during averaging. Here, CEOAE levels of the entire epoch for each of the four epochs that followed a noise elicitor were obtained. ΔCEOAE was then calculated using the corresponding reference click epochs from the two baseline blocks (see Figure 1(a)). This analysis provided data on MOCR inhibition decay over time in four time steps (22, 46, 70, and 94 ms). Note in Figure 5(d) to (f), the first time window starts at 7 ms instead of 5 ms where the OAE window starts after each click presentation. This is due to the 2-ms silence period following the elicitor presentation. In the same fashion as within-epoch temporal analysis, an RM-ANOVA with time, elicitor laterality, and the group as independent variables and ΔCEOAE as a dependent variable did not show any significant group interactions or a main effect of the group (p > .05). There was a significant effect of elicitor, F(2, 64) = 36.2, p < .001, η2Partial = 0.5, and a significant effect of time, F(2.3, 74.9) = 6.9, p = .001, η2Partial = 0.2. Post hoc tests (not included) with data collapsed across groups and elicitor literalities demonstrate the well-known temporal decay of MOCR over time, that is, smaller ΔCEOAE with increasing time (Backus & Guinan, 2006).
Finally, to test whether non-APD children in the LiD group had larger MOC inhibition than children diagnosed as APD, additional analyses were performed where APD (n = 10) and non-APD (n = 7) were separated into two groups, and their MOC inhibition was compared using FDR-corrected independent sample t tests. Results showed no significant difference in MOC inhibition for ipsilateral, contralateral, and bilateral conditions (p > .05). This result suggests that the inclusion of non-APD children in the LiD group likely did not contribute to the lack of group difference between LiD and TD groups.
Study 2: MOCR Strength Is Similar Between Groups for All OAE Types
Mean MOC inhibition across OAE types and groups is plotted in Figure 6. Statistical analyses were complicated by the uneven rejection of participants across OAE types. For instance, a participant may be rejected for poor SFOAE but may have good DPOAEs, and vice versa. If an RM analysis was performed, this type of participant rejection would have led to an n-size of only 12. This would significantly reduce the power of the study, undoing the advantage of performing an RM-ANOVA. To avoid this, group means were compared using independent sample t tests for each OAE type separately with FDR corrections for performing multiple comparisons.
Study 2—MOCR effect across the three OAE types. The magnitude of MOC inhibition of OAEs (normalized change in level re: baseline elicitor-off condition) is plotted for all OAE types. Violin colors represent OAE type. For each color, darker shades are data from the TD group, and lighter shades are from the LiD group (see Figure 2 caption for details on violin plots).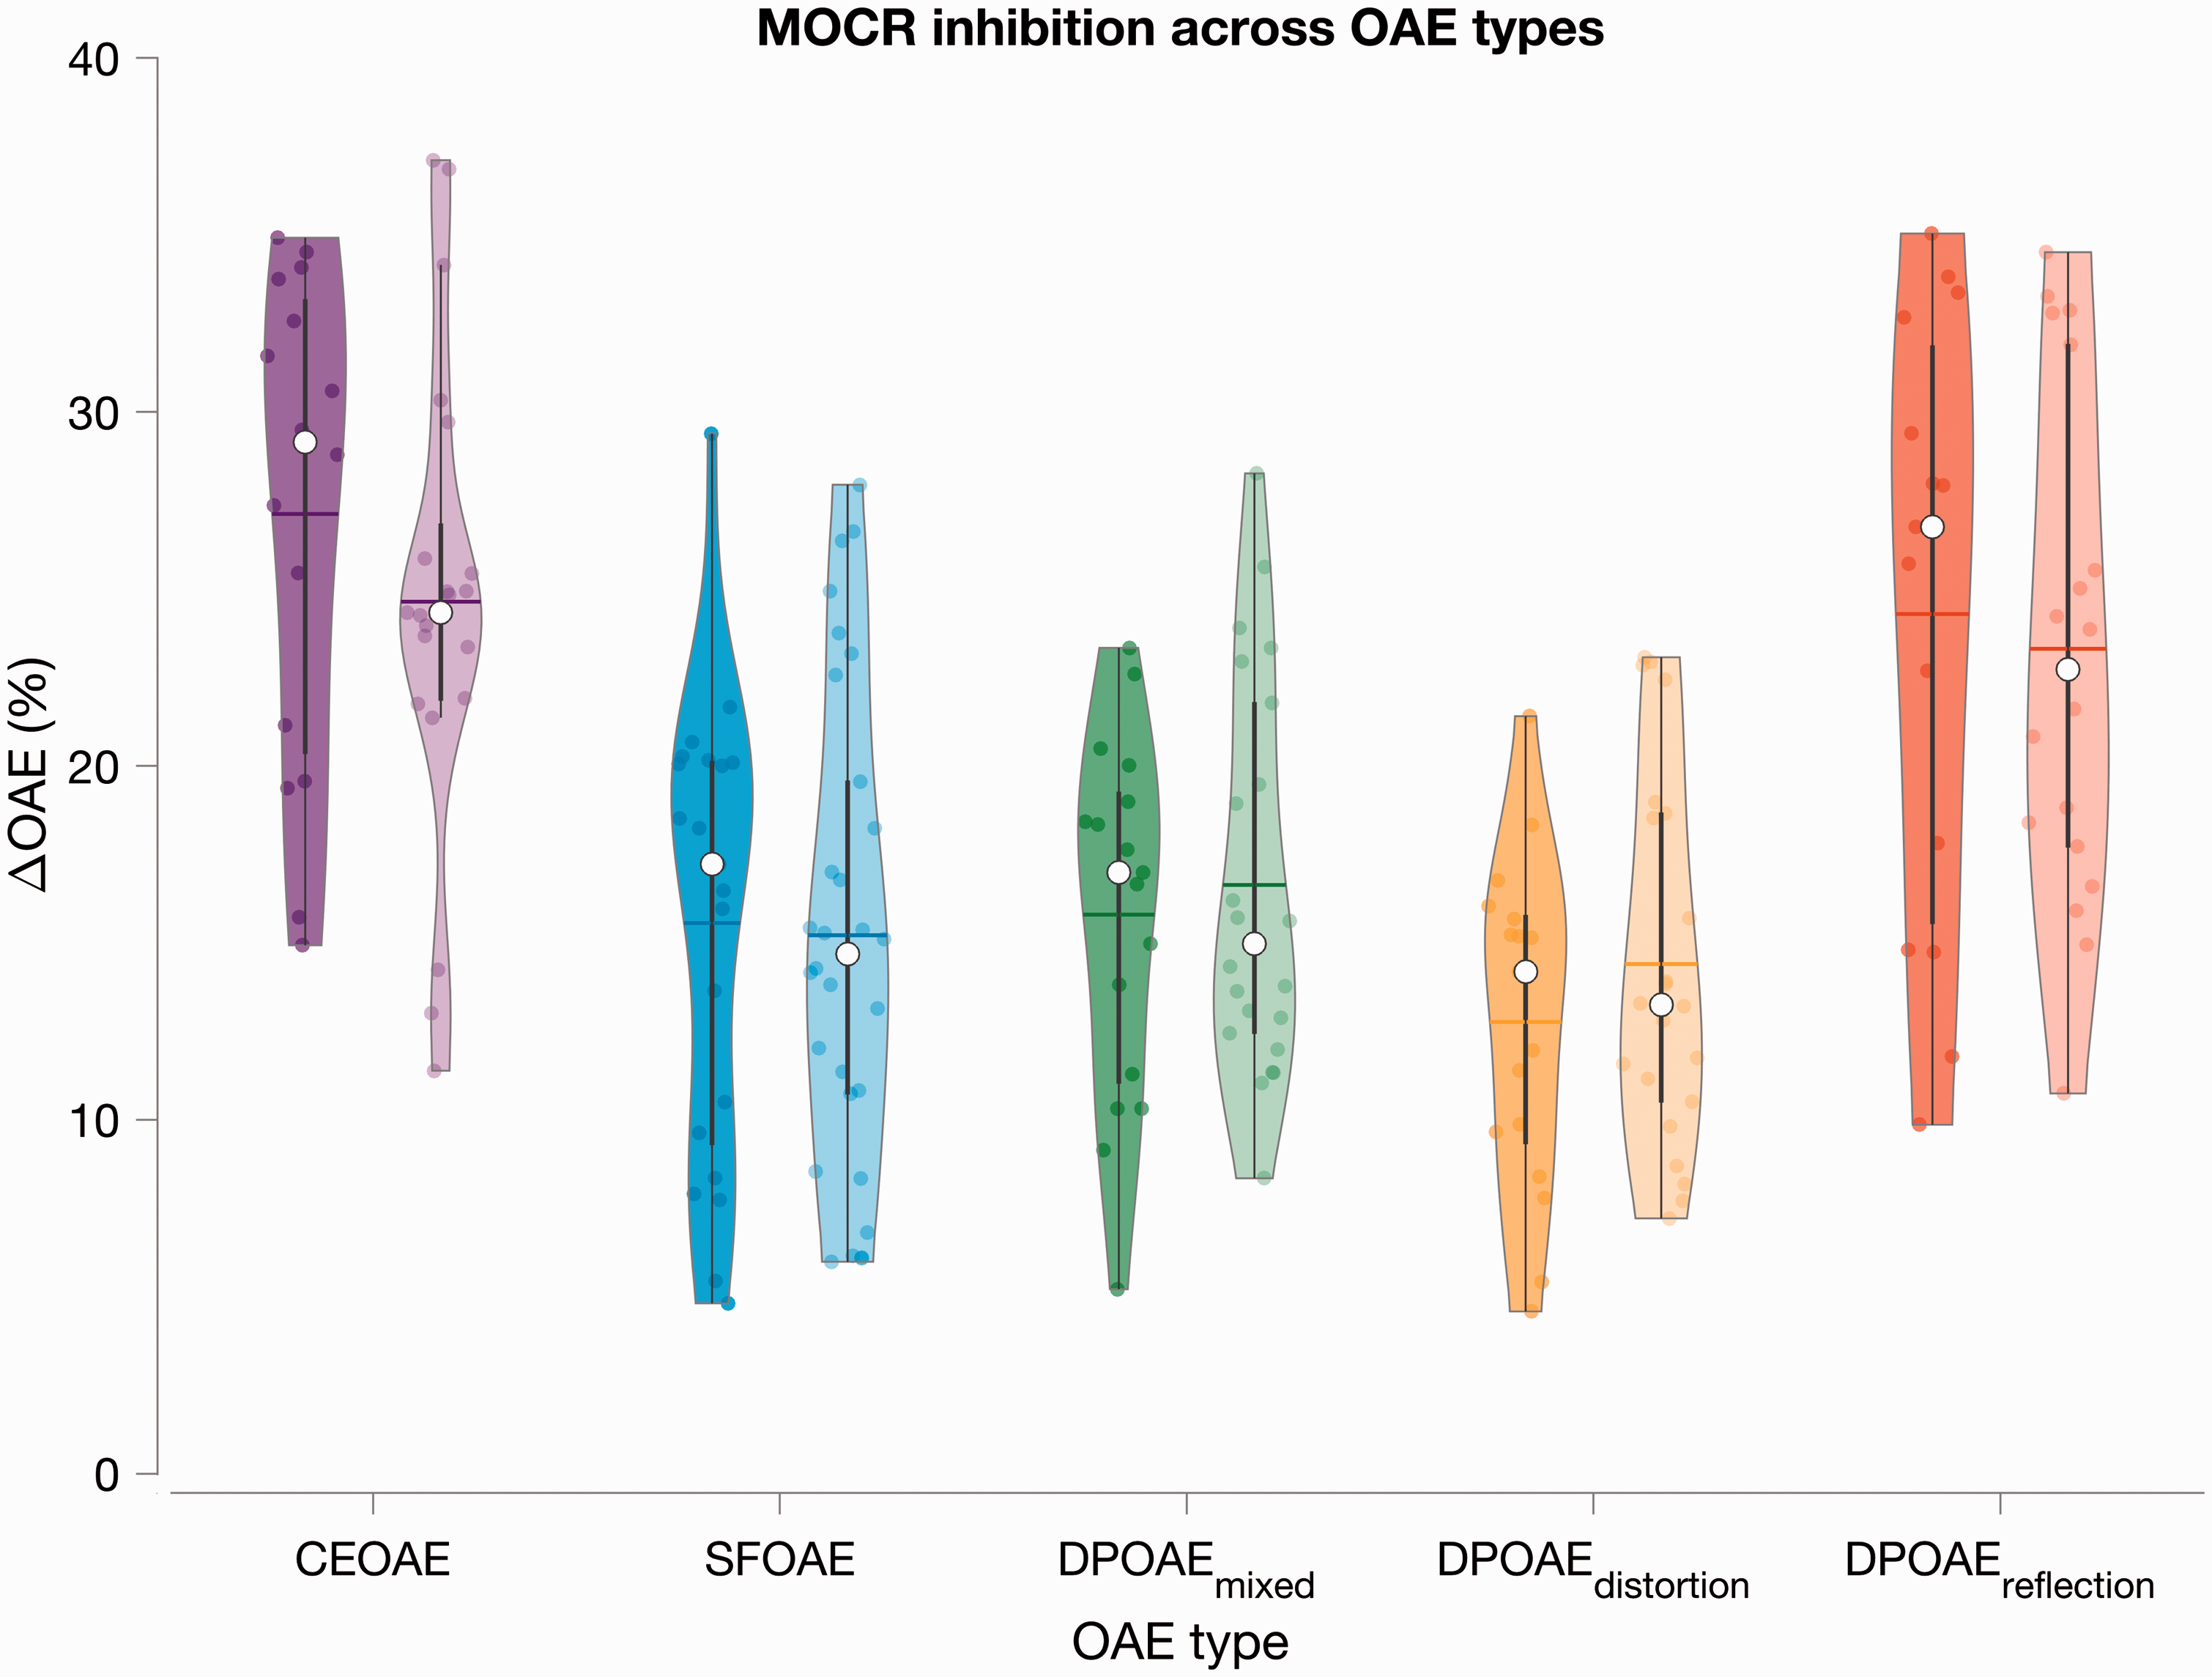
Results of Across-Group Comparison (TD vs. LiD) for all OAE Types Using Independent Sample t Test.

Note. CEOAE = click-evoked otoacoustic emissions; SFOAE = stimulus frequency otoacoustic emissions; DPOAE = distortion product otoacoustic emissions; MD = mean difference; TD = typically developing; LiD = listening difficulties; CI = confidence interval; FDR = false discovery rate.
Discussion
Our motivation for the present study was to comprehensively evaluate the role of the MOCR in LiD. To this end, we employed multiple OAE-based methods while controlling for known methodological shortcomings. Our results suggest that the MOCR is unlikely to play a role in children with LiD or APD.
MOCR Measured Using Multiple OAE Types and MOCR Lateralities Do Not Support a Compromised MOCR in the LiD Group
We investigated group differences in the ipsilateral, contralateral, and bilateral MOCR using forward masking in addition to the traditional contralateral MOCR method using simultaneous noise. Our motivation was that bilateral MOCR effects are larger relative to unilateral activations at similar OAE SNR (Berlin et al., 1995; Boothalingam et al., 2018; Lilaonitkul & Guinan, 2009). Bilateral elicitors presumably also activate the entire MOCR network (Guinan, 2006; Robles & Delano, 2007). Therefore, if deficits in MOCR were prevalent in the LiD group, these differences should be more apparent in the bilateral condition. Our results from Study 1 suggest that the MOCR elicited using forward masking across the three lateralities does not provide evidence for reduced MOCR function in children with LiD. This result is corroborated by MOCR indexed using other OAE types measured in a traditional contralateral presentation of simultaneous noise in Study 2. Therefore, the forward masking paradigm could not be the sole reason for the lack of group difference in Study 1. Furthermore, if the hypothesis that MOCR function is weaker in children with LiD was true, a weaker MOCR function should reveal itself in any type of MOCR stimulation, including simultaneous or forward masked.
Within- and Across-Epoch Temporal Analysis of CEOAE Lateralities Do Not Support a Compromised MOCR in the LiD Group
The forward masking paradigm in Study 1 also allowed for analysis of CEOAEs across time. CEOAEs were considered in 2.5 ms windows within an epoch and in larger 15 ms windows across epochs. This secondary analysis was conducted to test whether group differences in MOCR strength existed at specific temporal windows that may be washed out when data are averaged across time. No previous studies have reported across epoch, that is, time-course of MOCR function in LiD or related disorders. However, three prior studies have reported within-epoch temporal analysis. Muchnik et al. (2004) reported a significant group difference in a slightly shorter and later time window (8–20 ms) but not when the entire CEOAE duration was (2.5–20 ms) was considered. Iliadou et al. (2018) performed an overlapping (1 ms-moving window) temporal analysis; however, they did not report on group differences (high vs. low scorers in a speech-in-noise test) or the actual post-stimulus time of their time windows. Garinis et al. (2008) reported marked enhancement in their study group (learning disability) in the 12 to 14 ms window. Like Garinis et al. (2008), as seen in Figure 5(a) to (c), MOCR strength increases beyond 10 ms in the present study, but no group differences were noted.
As described in the Results section, the within epoch time-window analysis does not reflect a true MOCR temporal effect. The ∼10 ms CEOAE delay likely corresponds to CEOAEs generated around the 1 kHz region when measured using emissions generated by the coherent reflection mechanism (Kalluri & Shera, 2007; Shera et al., 2002, 2010; Shera, Tubis, & Talmadge, 2008). The loss of significance in Muchnik et al. (2004) when a longer time window (2.5 to 20 ms) was considered corroborates our argument that when higher frequencies (earlier CEOAE components) were included, where the MOCR activity is much lower, the group effects were washed out. Our across-epoch temporal analysis (Study 1), where the time-course of the MOCR is preserved, did not show any group differences. Therefore, it can be suggested that there are no significant differences in the time-course of the MOCR between groups.
Binaural Interaction of the MOCR Is Not Different Between LiD and TD Groups
Intrigued by a difference in the mBIC between adults and TD children in a prior study (Boothalingam et al., 2016) and because children with LiD have been reported to have deficits in binaural interaction (Gopal & Pierel, 1999; Roush & Tait, 1984), we also measured the mBIC in the present study. In contrast to the reported deficits in binaural interaction in the afferent pathway (BIC), we did not find a significant group difference in the mBIC. There are considerable differences between the BIC and the mBIC. The scalp-recorded BIC is thought to be a complex sum of distributed sources from multiple levels of the auditory system (McPherson & Starr, 1993; Wada & Starr, 1989). The mBIC, however, is presumably only due to MOC neurons in the brainstem. Therefore, whereas the mBIC is likely to reflect only the MOCR effects, the BIC might capture deficits from a wider array of neural structures from across auditory pathways along the entire brainstem. As such, the lack of group effects in the mBIC is consistent with the results in ipsilateral, contralateral, and bilateral conditions.
While no previous studies have reported on mBIC in children with LiD, studies have investigated the left–right asymmetry in MOCR function, a measure similar to, but not the same or analogous to, the mBIC. A few studies report a left-bias in MOCR activity in individuals with LiD (or related disorders) in contrast to a right bias in the control group (Burguetti & Carvallo, 2008; Garinis et al., 2008; Veuillet, Magnan, Ecalle, Thai-Van, & Collet, 2007). Veuillet et al. (2007) also reported a change from such “atypical” asymmetry to typical right-bias asymmetry in children with reading disability following audiovisual training. Such atypical symmetry in auditory processing has been reported across several disorders when measured using electrophysiological (e.g., Brunswick & Rippon, 1994) and behavioral methods (e.g., Hugdahl, Helland, Færevaag, Lyssand, & Asbjørnsen, 1995). However, because we tested only one ear per participant, our data cannot provide evidence for or against such laterality differences. Future studies may pursue this avenue in children with LiD rather than compare group differences in MOCR strength in one ear.
Taken together, the findings of the present study are inconsistent with prior reports, including one of our own (Boothalingam et al., 2015a; Garinis et al., 2008; Muchnik et al., 2004; Rocha-Muniz, Mota-Carvalo, & Schochat, 2017; Yalçinkaya, Yilmaz, & Muluk, 2010) but are consistent with others (Butler et al., 2011; Clarke et al., 2006; Veuillet et al., 2007) in that the MOCR function in children with LiD does not differ from their TD peers. Several reasons could have led to the difference in findings between the present study and studies that report group differences between children/adults with APD (or related disorders) and their respective controls.
1. Insufficient control for the MEMR
For instance, Muchnik et al. (2004) reported that normal contralateral MEMR was one of their criteria for including children in their study but did not mention any cutoff values. Bar-Haim et al. (2004) did find significantly larger thresholds and a greater number of absent MEMR in their study group relative to TD children. Yalçinkaya et al. (2010) presented CEOAE evoking clicks at 83 dB peSPL; two other studies presented clicks at 74 dB peSPL (Bar-Haim et al., 2004; Muchnik et al., 2004) in conjunction with a contralateral elicitor at 40 dB SL. These levels are likely to elicit ipsilateral MOCR and possibly also the MEMR (Boothalingam et al., 2018; Guinan et al., 2003). Other studies either do not report a MEMR criterion or report all their participants had MEMR thresholds greater than their MOCR elicitor level. Recent studies have shown that the MEMR can be elicited at much lower levels compared with MEMR thresholds obtained from a clinical immittance meter (Goodman et al., 2013; Guinan et al., 2003; Schairer, Ellison, Fitzpatrick, & Keefe, 2007).
In the present study, we used low click levels (55 dB peSPL), a relatively slower click repetition rate (41.67 Hz vs. 50 Hz in prior studies), and moderate elicitor level (60 dB SPL) while monitoring MEMR in all measurements. Despite using stimuli that are less likely to elicit MEMR (re: prior studies), we rejected two participants based on our MEMR criteria. Given that children in the LiD group have elevated or absent MEMR (Allen & Allan, 2014), it is possible that the combination of faster click rates, higher stimulus levels, and insufficient rigor in detecting the MEMR during MOCR measurements could lead to an apparent increase in MOCR inhibition in the TD group if MEMR was driving the OAE inhibition. This larger MEMR-mediated OAE level change in the TD group could be mistaken as reduced MOCR functioning in the LiD group. This argument, however, may not apply for SFOAEs as they are less likely to elicit MEMR relative to other OAE types (Guinan et al., 2003). Nonetheless, these arguments imply that it is critical to monitor the MEMR during MOCR measures. Considering new developments in our understanding of MOCR measurements, data from prior studies lacking the rigor to differentiate MOCR from MEMR-induced changes in OAEs must be interpreted with caution.
2. Variability in MOCR estimation
There is considerable variability and overlap in MOCR activity (ΔOAE) between groups. OAE-based MOCR metrics, in general, have large variability. For instance, in MOCR studies on young normal-hearing individuals, Backus and Guinan (2007), using a vector change in SFOAEs, reported a mean MOCR strength of 35 ± 12% (n = 25); Garinis, Werner, and Abdala (2011) reported 41% inhibition when using 60 dB peSPL clicks (n = 13); Mishra and Lutman (2013) reported 14% (n = 35); and Abdala et al. (2014) reported between 5% and 34% based on DPOAE frequency and component in 91 participants with ages ranging from 13 to 73 years. In the present study, the mean ΔOAE ranged from 12.7% in the DPOAE distortion component to 27% in CEOAEs. Across studies, it is evident that the MOCR indexed using different OAEs vary widely and the MOCR magnitude also vary within a given OAE type in a level- and frequency-dependent manner. Such variability makes direct comparisons across studies difficult; this was one of our motivations for Study 2. Consequently, the RM design across OAE types employed in Study 2 was able to overcome some of these limitations. Therefore, despite such large variability, the lack of group difference in the present study across OAE types provides confidence that deficits in the MOCR may not be prevalent in children with LiD.
The presence of S/SSOAEs may also influence MOCR estimation (Guinan, 2014). S/SSOAEs were not monitored in the present study. All OAEs in the present study were sampled across at least a 300-Hz range with a reasonable frequency resolution providing an adequate number of frequency samples where evoked OAEs would be expected to dominate the MOCR effects. As such, even if S/SSOAEs were present, they may not be the dominant source of MOCR across OAEs and groups. Further, even if S/SSOAEs were monitored, although frequencies neighboring S/SSOAE in the SF- and DPOAEs may be ignored (e.g., Guinan et al., 2003), there is currently no efficient means to eliminate S/SSOAE effects in CEOAEs. Nonetheless, accounting for S/SSOAEs during MOCR measurements in the future may reduce the variability within and across groups.
3. Reliability of MOCR methods and enhancements in OAE magnitude
Test–retest reliability is critical for replicability in science. Therefore, the rather poor test–retest reliability of MOCR methods is unsettling (Kumar, Methi, & Avinash, 2013; Mertes & Goodman, 2016; also see Mishra & Lutman, 2013). The large variability in MOCR strength added with the subpar reliability of current methods might explain at least some of the discrepancies across studies. If MOCR tests were to be used in understanding APD, further refinements must be made to the current methods to improve their test–retest reliability.
Some of the reliability issues may be related to the use of low SNR criteria (described later); others may be inherent to the OAE itself. One such variability might arise from how investigators treat MOCR-mediated enhancements in OAE level. For instance, Garinis et al. (2008) reported that individuals with learning disability demonstrated larger enhancements, as opposed to inhibition, in CEOAE amplitude with MOCR activation relative to controls. They speculated deficiencies in the primary MOCR neurotransmitter (acetylcholine [ACh]) or an “overshoot” of OAE activity following a release from the putative slow MOCR effects could have led to larger OAEs following MOCR activation. However, with recent advances in our understanding of OAE generation and propagation mechanisms, we now know that enhancements in OAE amplitude occur predominantly due to phase changes in OAE caused by MOCR activation rather than an actual enhancement of cochlear activity (Abdala et al., 2008; Deeter et al., 2009; Zhao, Dewey, Boothalingam, & Dhar, 2015). In addition, such enhancements typically tend to occur at spectral valleys where the SNR is very low. For this reason, we did not include MOCR-mediated enhancements and data points that were within 12 dB from the noise floor. We also separated DPOAE components in Study 2 to minimize any spurious OAE level changes resulting from the mixing of distortion and reflection components. With such quality indicators in place, neither CEOAE nor DPOAE components show group differences in the present study. Why such enhancements occur only in the study group of Garinis et al. (2008) is still an open question and needs further investigation. Because we included only children with a complaint of LiD, direct extrapolation of current results to other disorders, such as learning disability (e.g., Garinis et al., 2008), may not be possible. However, our data might provide some general reasoning based on a qualitative comparison of observed enhancements across OAE types (Figure 2(b)).
As seen in Figure 2(b), the median percentage of enhancements varied across OAE types with the least in SFOAEs where only one participant demonstrated MOCR enhancement. In the mixed DPOAE, Abdala et al. (2008) showed that the relative difference in inhibition of distortion versus reflection emissions caused phase-related enhancements in the composite DPOAE spectrum. Our data, with the distortion and reflection emission separated, show considerable reduction in such enhancements (re: mixed DPOAE), corroborating Abdala et al. (2008), but they nonetheless persist. Therefore, phase-related changes may not be the only reason that causes enhancements in OAE magnitude upon MOCR activation. The fact that SFOAEs show no such enhancements (except for one participant) leads us to speculate two additional factors that may be at play: (a) proximity of the OAE frequencies and (b) presence of SOAEs. Both CEOAEs and DPOAEs were elicited at much closer frequency bins relative to SFOAEs in the present study. In addition, whereas SFOAEs were elicited using discrete tones, CEOAEs were elicited using clicks that theoretically contain all frequencies instantaneously and DPOAEs using sweeps that rapidly change in frequency over time. Therefore, both CEOAE and DPOAEs have a greater chance of between-frequency interactions causing mutual intracochlear suppression of OAE wavelets. If the phase/level of one or more of the frequencies involved in mutual suppression is altered upon MOCR activation, causing a release from suppression, it could lead to an apparent enhancement in the OAE magnitude. Such release from intracochlear suppression has been demonstrated previously in SOAEs (Burns, Strickland, Tubis, & Jones, 1984; Murphy, Tubis, Talmadge, & Long, 1995) and transiently evoked SFOAEs (Konrad-Martin & Keefe, 2003). As such, the presence of S/SSOAEs may also lead to such enhancements in evoked OAE frequencies neighboring S/SSOAEs. Due to such uncertainties, we did not include OAE level enhancements in the present study. While it may be conservative, it is probably prudent to do so.
4. Inadequate SNR
Several recent studies have emphasized that the reliability of a MOCR-mediated change depends critically on the SNR of the OAE being measured. Guinan et al. (2003) suggested that an SNR of at least 9 dB is required to reliably detect a change in OAE level. Goodman et al. (2013) further emphasized this and reported that to detect a 2-dB change in OAE with 99% confidence, an SNR of 12 dB is required. With the exception of Boothalingam et al. (2015), no previous studies that investigated the MOCR in children with APD or related disorders have employed the minimum required 9 dB SNR criterion. While more recent studies have adopted a 6-dB criterion or used statistical metrics (Butler et al., 2011), older studies have typically used a 3-dB criterion.
The 3-dB criterion is presumably a remnant of the SNR criteria applied for detecting the presence of OAEs in clinical equipment (Kemp & Ryan, 1993). While the 3 dB SNR may be adequate for detecting the presence of OAE for screening purposes, it is inadequate for detecting a change in the OAE due to MOCR (ΔOAE). A 3 dB SNR suggests that the OAE is only 1.4 times larger than the noise floor. The across-condition difference, that is, MOCR magnitude or the ΔOAE, based on signals so close to the noise floor is likely to be influenced by noise and may lead to poor test–retest scores. For instance, Sanches and Carvallo (2006) reported no statistical group difference in MOCR magnitude between their APD and TD groups. But the authors also reported that they repeated their measurement three times and determined the true change in CEOAE level in children who showed a positive ΔCEOAE. This clearly demonstrates the inconsistency in estimates of MOCR mediated change in CEOAE. Given that the test–retest reliability of current MOCR methods is rather low despite following strict SNR criteria (e.g., Mertes & Goodman, 2016), it is not surprising that replicating the results of studies that used a low SNR criterion has been a challenge. Lewis (2019) suggested that clicks presented at a higher level (∼ 80 dB ppeSPL) provide an SNR advantage over clicks presented at lower levels, despite a reduction in overall MOCR effect at higher levels. Future studies might consider using clicks at higher levels, but at lower rates (Boothalingam & Purcell, 2015), to study the MOCR, especially when comparing MOCR function across groups.
5. The inclusion of non-APD children
An argument could be made that the inclusion of non-APD children together with APD children in the present study might have reduced any difference between the LiD and TD groups. In most prior studies, the study group consisted only of individuals diagnosed to have a disorder, either APD or a related disorder. In the present study, we included all children who were referred to our audiology clinic with a complaint of listening difficulty in the study group, irrespective of their diagnosis as APD or non-APD. Additional analyses done in both studies (1 and 2) do not show evidence for a difference in MOCR function between APD and non-APD children within the study group. Therefore, including children without an APD diagnosis, as recommended by ASHA (2005), likely did not contribute to the lack of group difference in MOCR functioning in the present study.
6. Auditory deficits that underlie APD
APD is diagnosed using a behavioral test battery (ASHA, 2005). Several recent studies have suggested that the use of behavioral methods alone may under- or overestimate the auditory deficits depending on language, attention, and cognitive abilities of the child (Dawes, Bishop, Sirimanna, & Bamiou, 2008; Moore, Ferguson, Edmondson-Jones, Ratib, & Riley, 2010; Rosen, 2005). In addition, APD clinical practice guidelines (American Academy of Audiology, 2010) suggest the use of objective physiological methods to augment behavioral test battery. As seen in Table 1, studies have used a variety of definitions for APD diagnosis, leading to large variability. In addition, deficits that may be revealed when tested using objective methods recommended by ASHA (2005) remain uninvestigated because objective methods are not typically included in the diagnosis process (Allen & Allan, 2014; Moore, Rosen, Bamiou, Campbell, & Sirimanna, 2013). By including children irrespective of their APD diagnosis if the study group, we attempted to mitigate any limitations of the behavioral test battery. However, this approach does not solve the problem of variability in the deficits across children with APD.
In the present study, children in the LiD group failed almost equally across the five behavioral tests administered as part of the APD test battery (SSW, PPT, GDT, DLF, and WIC), with the least number of children failing in the frequency discrimination test (DLF). This variability in auditory processing skills suggests a lack of consistency in deficits among children with LiD. Allen and Allan (2014) also reported that no one objective or behavioral test was abnormal in all children in their APD or LiD group, and objective measures did not always correlate with behavioral test outcomes. How different deficits, while still within the premise of the unitary diagnosis, APD, may be related to MOCR function is complicated by this heterogeneity. It is also possible that auditory processing of children in the present study’s LiD group may have been on par with the TD group, but other nonauditory factors (e.g., attention; Moore et al., 2010, 2013) may have played a predominant role in their listening problems. Such children, at least at a group level, may not be different in behavioral or physiological measures from the TD group. The inability to separately examine such children is a limitation of the current study and the APD diagnosis process. Another potential pitfall of the study is also that the APD tests were not administered on children in the TD group. While it is unlikely that TD children who do not complain of any LiD will fail tests in the APD battery, such a possibility cannot be dismissed. For this reason, the lack of group differences in MOCR function in the present study could also be due to the possibility that TD children were poor performers on par with the LiD group.
Final Remarks and Alternate Approaches
The present study was motivated by the lack of consensus on MOCR function in children with APD. Data from the present study conclusively show that MOCR is unlikely to be a candidate mechanism in LiD, and possibly APD. While it is possible that MOCR function may be reduced or compromised in some children, it certainly is not prevalent in what is considered LiD or APD. It is apparent that differences in findings across studies might have stemmed from multiple reasons discussed earlier and can possibly be distilled down to the variability and reliability of MOCR methods and the heterogeneity in auditory processing deficits that underlie LiD.
Investigators seeking to study the MOCR-APD relationship might follow alternate approaches. From a methodological perspective, robust and repeatable methods must be employed. For instance, a high SNR criterion must be enforced with adequate protection against contamination of MOCR by MEMR effects. For instance, higher click levels could be employed as suggested by Lewis (2019) while lowering the click rate (Boothalingam & Purcell, 2015b). Although we ensured all our stimuli were presented at accurate levels, using calibration techniques that reduce variability in stimulus level at the eardrum, such as forward pressure calibration, may improve test–retest reliability and decrease between-subject variability (Souza, Dhar, Neely, & Siegel, 2014). These new calibration techniques may improve the reliability of both OAE and MOCR measures. Alternatively, MEMR measures may be used in place of MOCR measures. MEMR measures are typically conducted at high stimulus levels; therefore, they inherently offer better SNR and are much faster than current OAE-based MOCR measures. In addition, there is evidence to suggest that the MEMR may be affected in children with LiD (Allen & Allan, 2014; Saxena, Allan, & Allen, 2015, 2017), although these results remain to be replicated. From the perspective of the heterogeneity in processing deficits within APD, it may be more useful for future studies to employ single-subject designs (e.g., Ramus et al., 2003) in children with LiD who do show reduced or absent MOCR activity. That is, in a similar vein to the five APD tests employed to determine APD candidacy in the present study, adding further tests, including electrophysiology, could shed more light on auditory deficits that co-occur with a compromised MOCR. Another option is studying MOCR functioning in targeted deficits rather than an umbrella APD diagnosis (Dillon, 2012). An example of such disorder is the spatial processing disorder where children have been reported to be selectively deficient in taking advantage of spatial release from masking for speech perception (Cameron and Dillon, 2008; but also see Barry, Tomlin, Moore, & Dillon, 2015; Sharma, Dhamani, Leung, & Carlile, 2014).
Conclusion
We used a comprehensive approach to investigate multiple facets of OAE-based MOCR functioning in children with LiD. We investigated group differences in (a) the ipsilateral, contralateral, and bilateral MOCR; (b) the temporal dimension of within- and across epochs in CEOAEs; (c) multiple evoked OAE types (CEOAE, DPOAE, and SFOAE) while including only high-quality data by using low click levels and slow rates as well as low elicitor levels to minimize MEMR activation and by applying high SNR criterion (12 dB SNR). Across all methods and OAE types, we did not find a significant difference in MOCR functioning between LiD and TD groups. Collectively, with all the data safeguards in place across OAE types and methods, the consistency in the lack of a group difference in MOCR activity suggests that the MOCR is unlikely to play a role in LiD or APD. A compromised MOCR would have supported the hypothesis that the MOCR is a candidate mechanism in the speech-in-noise difficulties reported by children referred for APD diagnosis in indeed the MOCR does play a role in speech perception in noise. Results from the present study thus suggest that the MOCR is unlikely to play a role in speech-in-noise difficulties in APD. Future investigations on the MOCR-APD link should be undertaken using alternative approaches that are robust to variability in the MOCR as well as APD.
Footnotes
Acknowledgments
We thank all the children and their families who took part in this study. We also thank Dr. Anders T. Christensen for his help with the DPOAE component separation program and the two anonymous reviewers for their constructive feedback. The violin plots in this work were generated using MATLAB scripts hosted on the GitHub repository: Violinplot–MATLAB.
Declaration of Conflicting Interests
The authors declared no potential conflicts of interest with respect to the research, authorship, and/or publication of this article.
Funding
The authors disclosed receipt of the following financial support for the research, authorship, and/or publication of this article: This work was supported by Western Graduate Research Scholarship to S. B., Natural Sciences and Engineering Research Council of Canada to D. W. P. (RGPIN-05320-2007), Ontario Research Fund (LEF#RE-03009), and Canada Foundation for Innovation (CFI#11419) to the National Centre for Audiology.
Data Sharing
Data from both studies and the script that was used to plot figures (2 through 6) are provided as a single MATLAB script file under Research data.