
Abstract
Assessing effort in speech comprehension for hearing-impaired (HI) listeners is important, as effortful processing of speech can limit their hearing rehabilitation. We examined the measure of pupil dilation in its capacity to accommodate the heterogeneity that is present within clinical populations by studying lexical access in users with sensorineural hearing loss, who perceive speech via cochlear implants (CIs). We compared the pupillary responses of 15 experienced CI users and 14 age-matched normal-hearing (NH) controls during auditory lexical decision. A growth curve analysis was applied to compare the responses between the groups. NH listeners showed a coherent pattern of pupil dilation that reflects the task demands of the experimental manipulation and a homogenous time course of dilation. CI listeners showed more variability in the morphology of pupil dilation curves, potentially reflecting variable sources of effort across individuals. In follow-up analyses, we examined how speech perception, a task that relies on multiple stages of perceptual analyses, poses multiple sources of increased effort for HI listeners, wherefore we might not be measuring the same source of effort for HI as for NH listeners. We argue that interindividual variability among HI listeners can be clinically meaningful in attesting not only the magnitude but also the locus of increased effort. The understanding of individual variations in effort requires experimental paradigms that (a) differentiate the task demands during speech comprehension, (b) capture pupil dilation in its time course per individual listeners, and (c) investigate the range of individual variability present within clinical and NH populations.
Introduction
Pupillometry, as a measure of mental engagement, has the potential to be a valuable tool for the assessment of effort involved in speech processing. Such a tool is especially important for hearing-impaired (HI) individuals because effort can limit hearing rehabilitation (Hornsby, 2013), and effort management could become part of the diagnostic protocol (Chapman & Hallowell, 2015). The heterogeneity within the clinical population of HI individuals, however, is often increased due to factors that relate to severity and type of hearing loss, to individual etiology and resulting physiological changes in the auditory and speech neural systems, as well as to features that relate to hearing devices (Blamey et al., 2013; Killion, Niquette, Gudmundsen, Revit, & Banerjee, 2004). To ensure the external and internal validity of measurements of effort with HI populations, we need to account for higher inter- and intraindividual variability in response to task demands, in particular for tasks that depend on multiple processing stages, as does speech comprehension. Here, we discuss the challenges of applying pupillometry in research on speech perception by HI listeners in a study on lexical access in listeners with cochlear implants (CIs) during auditory lexical decision-making.
Pupillometry has been used as an objective measure of mental effort for decades (Hess & Polt, 1964). The strength of pupillometry is its physiological character, which makes the method objective because pupil dilation is beyond participants’ conscious control. Pupillometry data are often aggregated into measures of central tendency to characterize differences in performance between groups, such as native versus nonnative listeners (Borghini & Hazan, 2018; Schmidtke, 2014), young versus elderly (Piquado, Isaacowitz, & Wingfield, 2010), and healthy versus aphasic (Chapman & Hallowell, 2015), schizophrenic (Minassian, Granholm, Verney, & Perry, 2004), or depressed (Siegle, Steinhauer, & Thase, 2004) populations.
A weakness of pupillometry, however, lies in the fact that changes in pupil size can stem from participants’ responses to different sources of stimuli (tones: Kahneman & Beatty, 1967 or speech: Wright & Kahneman, 1971), or to different task demands (comprehension or detection: Ben-Nun, 1986), as well as from participants’ mental state (intelligence: Ahern & Beatty, 1979 or motivation: Massar, Lim, Sasmita, & Chee, 2016). Pupil dilation reflects cognitive involvement but also emotional processing (Jürgens, Fischer, & Schacht, 2018; Partala & Surraka, 2003), anticipation (Kang et al., 2009), pain (Chapman, Oka, Bradshaw, Jacobson, & Donaldson, 1999), and alertness (Beatty, 1982a). Consequently, pupil dilation is potentially a confounded measure because changes to pupil size can be triggered by various sources independently and simultaneously. For example, during an experiment with mental multiplication, Polt (1970) found a decrease in pupil dilation across consecutive trials for half of the tested population but an increase in pupil dilation for the other half who were threatened with electric shocks in case of erroneous responses. In this respect, a recording of participants’ pupil dilation reflects not only their response to a task but also their attentional and emotional state. A corollary of this confound is that it allows for interpretations based on individual capacities of participant groups. To illustrate this, pupil dilation can be interpreted as increased cognitive load; however, a relatively smaller increase in pupil dilation has been attributed to greater intelligence or to more efficient use of cognitive resources (Ahern & Beatty, 1979), or to fatigue (McGarrigle, Dawes, Stewart, Kuchinsky, & Munro, 2017), or a lack of motivation. The interpretation of the objective measure of pupil dilation is challenging because it can reflect concurrently (a) participants’ response to a task, (b) their momentary state of mind (i.e., their emotional and attentional state), and (c) their cognitive capacity. To separate these potentially confounding sources of pupil dilation, researchers use experiments that carefully control task demands for a preselected population.
Highly controlled experimental conditions intend to ensure the internal validity of experiments using pupillometry. To predefine the locus of mental involvement, researchers often select homogenous populations, such as university students or academics, to warrant that participants are responding to the same task demands. In such controlled experiments, a monotonic relation between task complexity and effort can be found. In fact, since Hess and Polt (1964) recorded pupil dilation as a response to mental arithmetic with various degrees of complexity, an impressive bulk of research has found a monotonic relation, for changes in demands on, among others, memory (Kahneman & Beatty, 1966; Papesh, Goldinger, & Hout, 2012), on concentration (Bradshaw, 1968), on complexity in sentence comprehension (Piquado et al., 2010; Wright & Kahneman, 1971), or the ambiguity of the stimuli used (Ben-Nun, 1986).
The recent years have seen an increase in publications on pupillometry and speech perception. For the normal-hearing (NH) population, we see consistent increase in pupil dilation when processing speech in adverse conditions, due to the need to suppress competing speakers (e.g., Koelewijn, Zekveld, Festen, & Kramer, 2012, 2014) or surrounding noise (Kuchinsky et al., 2013; Zekveld, Kramer, & Festen, 2010), or to accommodate degradations to the signal (e.g., Wagner, Pals, de Blecourt, Sarampalis, & Başkent, 2016a; Winn, Edwards, & Litovsky, 2015). However, increased attentional engagement for NH listeners has also been observed in nonadverse conditions during processing stages that are integral to speech comprehension. The pupil dilates as a response to inhibition of irrelevant signals (Wetzel, Buttelmann, Schieler, & Widmann, 2016), perceptual pitch discrimination (Kahneman & Beatty, 1967), word listening (Kuchinsky et al., 2013), lexical competition (Wagner et al., 2016b), integration of the sentential context (Wagner et al., 2016a; Winn et al., 2015) and reflects frequency and neighborhood density effects during lexical access (Schmidtke, 2014).
When it comes to investigating clinical populations, such as HI individuals, there is a need to account for the limited control in preselecting the population. For HI listeners, compensation for signal degradation is a permanent part of their verbal communication. This leads to individual adaptations of processing (e.g., Moberly, Bhat, & Shahin, 2016) and compensation strategies (Baş kent et al., 2016a), which effectively increase the within-group heterogeneity. A significant factor that contributes to greater heterogeneity within the population is the individually varying durations of sensory deprivation and perceptual reorganization, which result in drastic individual alterations of neural and cognitive mechanisms (Blamey et al., 2013; Dorman, & Spahr, 2002; Giraud, Price, Graham, & Frackowiak, 2001; Moore & Shannon, 2009). Processes that elicit consistent pupillary responses in NH populations, such as lexical access and higher level integration of contextual information, may show varying degrees of difficulty across HI listeners. It follows that if great individual variability in performance is representative for a population, this heterogeneity should be reflected in the data.
In general, clinical populations can display a higher than normal variability in response to task demands. When compared with typical populations in experiments that use complex versus simple tasks, group-averaged responses of aphasic (Chapman & Hallowell, 2015), schizophrenic (Minassian et al., 2004), or depressed patients (Siegle et al., 2004) often show a smaller increase in pupil dilation. These findings show different behavior on the group level, but there are additional questions to consider. Is the smaller response a consequence of task demands or of patients’ mental state? Can it be attributed to the restrictive use of cognitive resources due to illness? How much does the heterogeneity within such populations contribute to the smaller overall response?
To answer these questions, it is important to predefine what is captured in pupil dilation, hence to choose specific tasks that pose well-defined demands for a given population, without losing sight of the external validity for that population. These demands are particularly challenging for heterogeneous populations and complex tasks. For homogenous populations, when responding to the same task demands, increase in pupil size reflects an increase in the allocation of attentional engagement. Attentional engagement is closely linked to effort, motivation, and arousal (Kahneman, 1973), and these factors contribute to pupil dilation as they codefine the subjective demands of the task. When recording task-related pupil responses, we aim to capture changes in the attentional engagement needed to execute a specific task. Attention, however, is not a single concept but describes, since the Principles of Psychology (1890), networks of sensorial and intellectual, active and passive, and external and internal forms of attentional engagement. Attentional networks coordinate listeners’ state of control, their responses to sensory stimulation, as well as the monitoring of performance, which includes switching, inhibiting, and updating cognitive processes (e.g., Van der Wel & van Steenbergen, 2018). These attentional networks (alerting, orienting, and execution) are closely interrelated, and they co-operate in the execution of complex tasks.
How much attention is needed to execute a task has traditionally been seen as depending on automation of processing stages, which in turn is a function of practice (Ackerman, 1988; Shiffrin & Schneider, 1977). By studying tasks that require attention beyond automatic processing, such as complex versus simple mental multiplication (Ahern & Beatty, 1979), or gear-shifting versus traffic decision-making during simultaneous driving and telephoning (Brown, Tickner, & Simmonds, 1969), an increase in controlled attention reflects an increase in mental effort. In ideal conditions, the allocation of attention in a highly practiced task, such as speech perception, takes place automatically (Kahneman, 1973; Lavie & Tsal, 1994), that is, without conscious attention, intention, or effort (e.g., Shiffrin & Schneider, 1977). Processing stages that are not automatic require the input from shared central resources, which are limited. How much central capacity is demanded by a task depends on participants’ capacity and ability to automate processing (Ackerman, 1988; Kahneman, Tursky, Shapiro, & Crider, 1969) based on their practice and experience with the task. For clinical populations in particular, this implies that, without assessing the level of automatic processing, we cannot guarantee that the task poses the same demands on each participant.
In pupil dilation, the involvement of attentional networks can be reflected by different components of the pupil response with different timings of response onsets (Geva, Zivan, Warsha, & Olchik, 2013). Physiologically, pupil dilation reflects the autonomous activity of tonic and phasic receptors (Beatty, 1982b; Gilzenrat, Nieuwenhuis, Jepma, & Cohen, 2010). These two sources are reflected in pupil dilation at different timescales: Tonic responses are characterized as slow changes in pupil baseline and linked to participants’ state of control (Unsworth & Robinson, 2016), and phasic responses are characterized as faster changes in pupil diameter that are locked to the task (Beatty, 1982b; Gilzenrat et al., 2010). The overall dynamics of pupil dilation reflect the tonic and phasic activity and potentially also their interrelation (Gilzenrat et al., 2010). Beatty (1982a) reports no relation between tonic and phasic changes in pupil dilation in a vigilance task, while Gilzenrat et al. (2010) report an inverse relationship between the tonic and phasic pupil dilation with changes to tonic pupil dilation being associated with task engagement. In line with this, Unsworth and Robinson (2016) report that changes in pre-trial baseline pupil size (tonic changes) are reflective of lapses of attention and off-task time, hence reflecting the state of control of the participant. Pupil dilation may thus enable us to differentiate the involvement of attentional subsystems and to study the sources of effort for individuals.
Speech perception requires the swift progression of information from sensory processing, over auditory object formation, to lexical access and integration of information within context. For HI populations, each of these processing stages can pose additional demands. For example, when HI listeners perform mental multiplication of digits presented auditorily, the demands of the task may not be due to the multiplication alone but also to processing or even the detection of the acoustic signal. For HI listeners, increased processing is further determined by an individual’s experience with the task, which might show varying degrees of difficulty, depending on the duration of sensory deprivation and perceptual reorganization (Blamey et al., 2013; Giraud et al., 2001; Moore & Shannon, 2009; Sharma, Dorman, & Spahr, 2002). Foremost, however, if HI listeners need to focus attention on spoken utterances, we might actually not be measuring changes in pupil dilation evoked by the cognitive processes tapped by the experimental conditions but also effects of such a need to sustain attention (see also McGarrigle et al., 2017). Furthermore, the demand of sustaining attention might, on the individual level, be modified by individuals’ adaptation to the cognitive consequences of processing degraded signals (Peelle, 2018).
The increase of studies addressing effort during speech processing in HI populations is accompanied by an increase in the varieties of terms used to describe effort in speech processing, such as “listening effort” (e.g., Pals, Sarampalis, & Başkent, 2013), “processing effort” (Ayasse, Lash, & Wingfield, 2017), or “cognitive effort” (Piquado et al., 2010; for overview of the debate, McGarrigle et al., 2014). A uniform definition of these terms, however, might not be possible, particularly when measured on a task as complex as speech perception in clinical populations. Instead, experimental paradigms that hone in on identifying varieties of effort might be particularly constructive for applications that are consequential for HI listeners.
In line with Kahneman (1973), Pichora-Fuller and colleagues (2016) define listening effort as “the deliberate allocation of mental resources to overcome obstacles in goal pursuit when the task is listening to speech.” This stresses the goal to capture the voluntary processes, as these are engaged in adverse conditions that trigger listening effort. In these conditions, individual variability is more inherent because controlled processes are more dependent on individuals’ cognitive abilities (Davies, Jones, & Taylor, 1984). Variability may be increased even more, if processes automatic for NH, such as orientation and alertness to stimulation, require controlled attention from HI individuals. This may create unbalanced task demands between populations. When testing clinical populations, we have limited control in preselecting the population for homogeneity, but through identifying the task demands on an individual basis, we can strengthen the internal validity of experiments with clinical populations.
In what follows, we address the issues of differing task demands and individual variability and how these interact with the measure of pupil dilation by investigating lexical access for listeners with profound sensorineural hearing loss, who perceive speech by means of a CI. The task at hand is auditory lexical decision, in which listeners are asked to categorize a heard sequence of phonemes as an existing or nonexisting word. The task is considered relatively undemanding for NH listeners in ideal conditions, when lexical access occurs automatically. In contrast, CI users can show varying degrees of effortful processing when perceiving continuous speech (e.g., Noble, Tyler, Dunn, & Bhullar, 2008) due to the spectrotemporal reductions in signal that are inherent to electric hearing, and because of physiological changes as a result of hearing loss (see, e.g., Başkent et al., 2016b for a review). Moreover, CI users might also have different expectations and confidence about their own hearing abilities that can be used as a compensation for degraded speech (Başkent et al., 2016a). Participation in the experiment includes listening to speech via a loud speaker without any additional visual cues. This situation can be challenging and effortful for many CI users. Both listener groups are able to perform the task, but the task likely poses additional attentional demands on the CI group. Our aim is to study the measure of pupillometry in its capacity to inform about the effort involved in speech processing by HI individuals, a population with greater within-variability.
In the current study, we recorded pupil dilation during an auditory lexical decision experiment. Auditory lexical decision is a paradigm that has been widely used to study lexical access and the structure of the mental lexicon in healthy and clinical populations (for a review, see Blumstein, Milberg, Dworetzky, Rosen, & Gershberg, 1991; Edwards & Lahey, 1996; Goldinger, 1996). The effects shown with this paradigm confirm the role of statistical probabilities of words in word retrieval, as well as form priming (Emmorey, 1989) or semantic priming (Moss, Ostrin, Tyler, & Marslen-Wilson, 1995) in lexical access. In HI populations, this method has been used to explain individual variability in speech perception outcomes within the population of CI users (Nagels, Başkent, Bastiaanse, & Wagner, 2019; Vitevitch, Pisoni, Kirk, Hay-McCutcheon, & Yount, 2000). In the present study, we administered the task to a group of NH participants and a group of CI users. Auditory lexical decision requires that participants access their lexicon and decide on the lexical status of the stimuli. These processes involve stages that occur automatically, but for individual CI listeners, some stages of processing may be more demanding. We expected to find indexes of increased processing as a response to the task for both groups but greater demands on the processing for the CI group compared with the NH group.
Method
In auditory lexical decision tasks, participants are presented with words and nonwords, and they categorize these items as existing or nonexisting words. The participants’ decision requires accessing words in their mental lexicon and en passant excluding words that are similar in their phonological form. This experiment focuses on changes in pupil size as they were recorded during the lexical decision task.
Participants
Demographic Characteristics of the Participants.
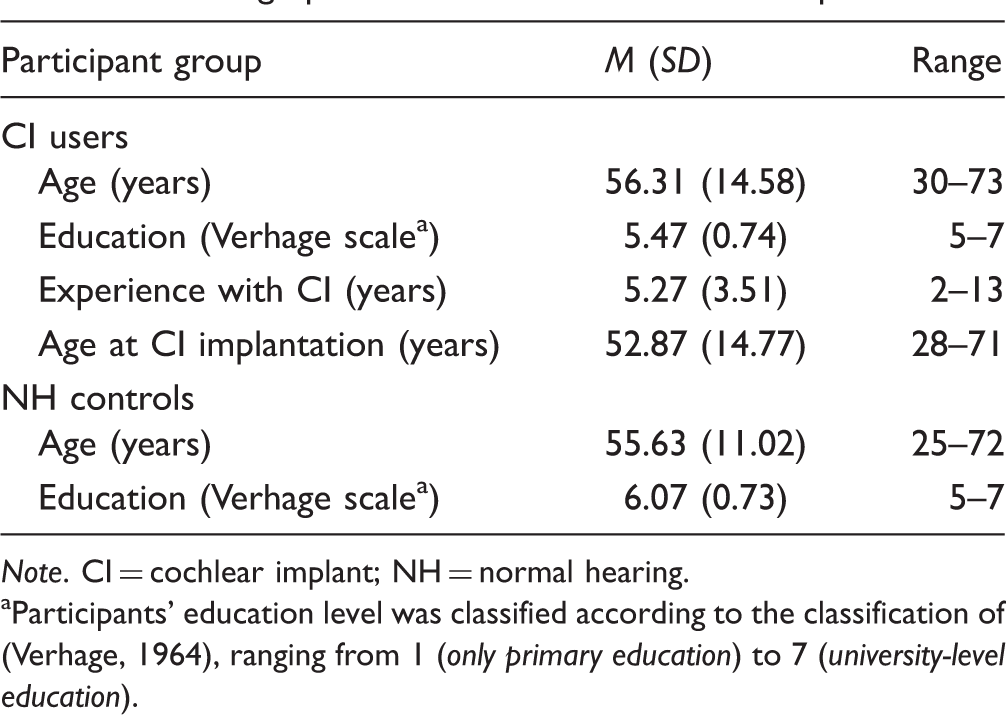
Note. CI = cochlear implant; NH = normal hearing.
Participants’ education level was classified according to the classification of (Verhage, 1964), ranging from 1 (only primary education) to 7 (university-level education).
The CI users were satisfied users who self-reported to wear their CI for at least 10 hr per day. We aimed to recruit CI participants to represent a group who varied in age and duration of CI use; all were able and motivated to participate in the study. Participants were recruited during a routine visit at the University Medical Center Groningen and via an online portal for CI users. NH participants were recruited through advertisement. The task involved presentation of speech stimuli through a loud speaker, which can be a challenging situation for many CI users; therefore, a further selection criterion was the demonstration of relatively good clinical scores (between 65% and 95% on identification of phonemes embedded in meaningful words, based on lists of monosyllabic consonant-vowel-consonant words, by Bosman, 1989). The CI devices were manufactured by three established companies: MED-EL Medical Electronics (Innsbruck, Austria), Advanced Bionics AG (Stäfa, Switzerland), and Cochlear (Sydney, Australia).
For the NH group, NH was defined as audiometric thresholds better than 25 dB HL across audiometric test frequencies 500 to 4000 Hz. This is a relaxed criterion for NH that accounts for minimal age-related hearing loss to achieve age matching between groups, as has been used in previous studies (e.g., Saija, Akyürek, Andringa, & Başkent, 2014).
Materials
Recordings of a set of 50 Dutch words, for example, weken [weeks], and 50 nonwords, for example, saren, were created for this study. The stimuli were balanced in terms of log frequency of occurrence (range: 0.06–5.02), neighborhood density (range: 0–28), and syllable length (one or two syllables) to reduce the effects that are known to influence lexical decision based on statistical probabilities within the mental lexicon (Goldinger, 1996). Frequency of occurrence values were retrieved from the SUBTLEX-NL database (Keuleers, Brysbaert, & New, 2010), and neighborhood density values were extracted from the Dutch CLEARPOND database (Marian, Bartoletti, Chabal, & Shook, 2012). The 50 nonwords were derived from existing words from cohorts of similar frequency and neighborhood density and then created by substituting one phoneme to turn it into a nonword. For instance, the existing word maken [to make] was turned into the nonword saken by substituting the /m/ with a /s/, or the nonword taren was created by substituting the /l/ with /r/ in talen [languages]. A female native speaker of Dutch, who spoke Dutch without any discernible dialectal coloration, produced the stimuli in an anechoic chamber for digital recording at a sampling rate of 44 kHz. The presentation level of the stimuli was equalized to an RMS level of 65 dB sound pressure level.
Apparatus
An Eye-Link II head-mounted eye tracker (SR-research) recorded participants’ ocular responses as time series at a sampling rate of 250 Hz. The presentation of stimuli was controlled with MATLAB (The MathWorks) and the Psychtoolbox (Brainard, 1997; Kleiner, Brainard, & Pelli, 2007; Pelli, 1997). Ocular responses were recorded using the Eyelink Toolbox for MATLAB (Cornelissen, Peters, & Palmer, 2002). Auditory stimuli were presented through an AudioFire4 sound card (Echo Digital Audio Corporation) and played on a Tannoy Precision 8D speaker (Tannoy Ltd) facing the participants from above the computer monitor.
Procedure
Before the experiment started, audiometric screening confirmed NH for NH participants. To ensure stimulus audibility for the CI listeners, participants were familiarized with the sound level within the experimental setup, before the experiment started, by listening to running speech, and they were given the chance to adjust the volume settings of their own device. During the experiment, all participants were seated in a dimly illuminated (the illumination was kept constant throughout the experiment at 145 lux) and soundproof room at a distance of about 50 to 60 cm from a 17-inch LCD computer screen with a screen resolution of 1280 by 1024. The eye tracker was placed on the participant’s head. Before the experiment started, the eye tracker was calibrated and validated to assure the acquisition and recording of valid data.
Before data collection, four practice trials were presented to instruct the participant. During these practice trials, the experimenter was available to answer the participant’s questions. The experimenter left the testing booth when the participant was ready to continue with the experimental session. After the four practice trials, that is, after the participant was familiarized with the task and before the start of the experimental trials, we recorded participant’s pupil size for 1 s in the absence of a task, while the participant fixated on a cross in the middle of the screen. These recordings are used as preexperiment baseline (PEB), to quantify the variation in pupil size baseline due to participation throughout the experiment. Changes in the pupil size baseline in relation to PEB can reflect shifts in participants’ state of control, due to fatigue or familiarization with the experimental situation or lapses in engagement from the task, as these naturally occur during prolonged focus on a task (Gilzenrat et al., 2010; Unsworth & Robinson, 2016). We refer to this measure as tonic changes to pupil baseline.
During the lexical decision task, participants were presented with either a word or a nonword and categorized these as word or nonword by pressing one of two color-coded keyboard keys. Listeners’ ocular responses were recorded throughout each experimental trial, that is, from 500 ms before the auditory stimulus presentation until 1 s after the response. Each trial started by displaying the word “blink” on the screen until the participant pressed the space bar on the keyboard. Asking participants to blink voluntarily a couple of times before the trial starts reduces the chances of blinks occurring later on, therefore reducing the chances of artifacts contaminating the subsequent recording interval. After the keyboard press, a fixation cross was displayed in the center of screen for 500 ms before presenting the auditory stimulus. After that the participant gave their response and the pupil was recorded for another second before the next trial started. No feedback was given to the participants regarding their performance. Eye drift was calculated every five trials to establish that the eye tracker was still tracking the pupil with sufficient accuracy. If necessary, the eye tracker was recalibrated. The experiment lasted about 15 min in total and consisted of 4 practice trials and 100 experimental trials.
Data Analysis
Trials with reaction times shorter than 200 ms or longer than three standard deviations above the mean response time were excluded from further analysis, as they were considered outliers. This procedure was applied separately to each participant’s data and, on average, removed 3.8% and 3% of the total number of trials for NH listeners and CI users, respectively. Moreover, trials with recordings of eye artifacts or eyeblinks that were longer than 300 ms were also excluded from further analysis (on average, 6.7% of the total number of trials). Blinks shorter than 300 ms were linearly interpolated based on the median value of 50 samples (200 ms) preceding and following the blink. The data were initially recorded with a sampling rate of 250 Hz, but we reduced the total number of data points by averaging consecutive samples into bins of 20 ms (i.e., 5 data points per bin). Within each trial, changes in pupil size were calculated as percent change in event-related pupil dilation (ERPD), per each individual trial and participant, according to the following formula:

Using this formula, we computed the phasic ERPD, to quantify the effort invested in the process of lexical decision. Phasic ERPD was computed using pupil size data recorded after the onset of the word until 1 s after participants’ response as “observation” in the earlier formula. The “baseline” values used for the phasic ERPD were the averages of the pupil size data recorded 500 ms before the onset of the sound stimulus. These pretrial baseline values served as a normalizing constant.
In addition, the tonic changes to pupil baseline were computed following the same rationale applied to the earlier equation. However, PEB were used as a constant to normalize the pretrial baseline (i.e., the 500 ms recordings of pupil that precede the onset of the sound stimulus in every trial). The earlier equation was thus adapted to

The tonic changes to pupil baseline quantify the changes in state of control of the participant throughout the experiment (due to, e.g., fatigue or familiarization, see also, Wagner, Toffanin, & Baskent, 2015, 2016a). Note that here they express a single value of change in baseline relative to PEB per trial. Because the tonic changes to pupil baseline might be related to phasic ERPD and reflect lapses of attention due to fluctuations in engagement during prolonged focused attention (Unsworth & Robinson, 2016), the combination of phasic ERPD and tonic changes to pupil baseline will inform us about the attention engaged by the experimental task itself and about the state of the participants throughout the experiment, respectively.
Statistical Analysis
The phasic ERPD was analyzed with growth curves analysis models (Mirman, 2014). We used R (R Core Team, 2013) with the lme4 package (Bates et al., 2014) to model the growth curves as fourth-order polynomials. Data within the time window of 200 ms after word onset until 1 s after individual response was modeled as a fourth-degree polynomial (i.e., the analysis window is adapted in length individually per trial). The choice of a fourth-degree polynomial is justified by the fact that the shape of the ocular responses, as averaged across all participants, was best approximated by a fourth-degree polynomial. The curves were described in four terms: (a) intercept, (b) the overall slope of the curve, (c) the width of the rise and fall around the inflection, and (d) the steepness of the curvature in the tails. Model comparison was used to estimate the contribution of individual predictors to the fit of the model. For this procedure, a full model was estimated, containing all the fixed and random effects informed by the experimental design. Then, individual fixed effects were sequentially removed from the full model, and significant changes in the model fit were evaluated by means of a likelihood ratio test. We compared whether reducing the fixed effects and their interactions on individual terms of the curve led to a significant change or improvement in the model. The fixed effects that did not significantly improve the model fit were excluded from the final model until the best fitting and most parsimonious model was found according to the recommendations by Bates, Kliegl, Vasishth, and Baayen (2015).
Results
Model Estimates of the Full Model. a

Note. ERPD = event-related pupil dilation; NH = normal hearing; CI = cochlear implant.
Full model = lmer (ERPD∼(linear term + quadratic term + cubic term + quartic term) × Accuracy × Lexicality × Group + (linear term + quadratic term | participant).
Figure 1 shows the growth curves of phasic ERPD averaged across participants and items for NH (left panel) and CI (right panel) participants, in line with the generally used protocol to conduct between-group analyses. The figure shows that the functions of the two groups differ in their time course and shape, as well as in the location of the peaks. In fact, the CI group appears to display two peaks instead of one. The inaccurate responses (dashed lines) are displayed for reasons of completeness but are excluded from further analyses. This is mostly due to the fact that NH committed very few errors, in some cases even none. Furthermore, we follow-up with separate models for CI and NH data because the main analyses showed interactions with Group.
The grand mean time course of pupil dilation (shown in %ERPD change) for NH (left panel) and CI (right panel), aligned to word onset. Red lines show responses to nonwords, and black lines show responses to words. Dashed lines show responses for incorrect responses, and solid lines show responses for correct responses.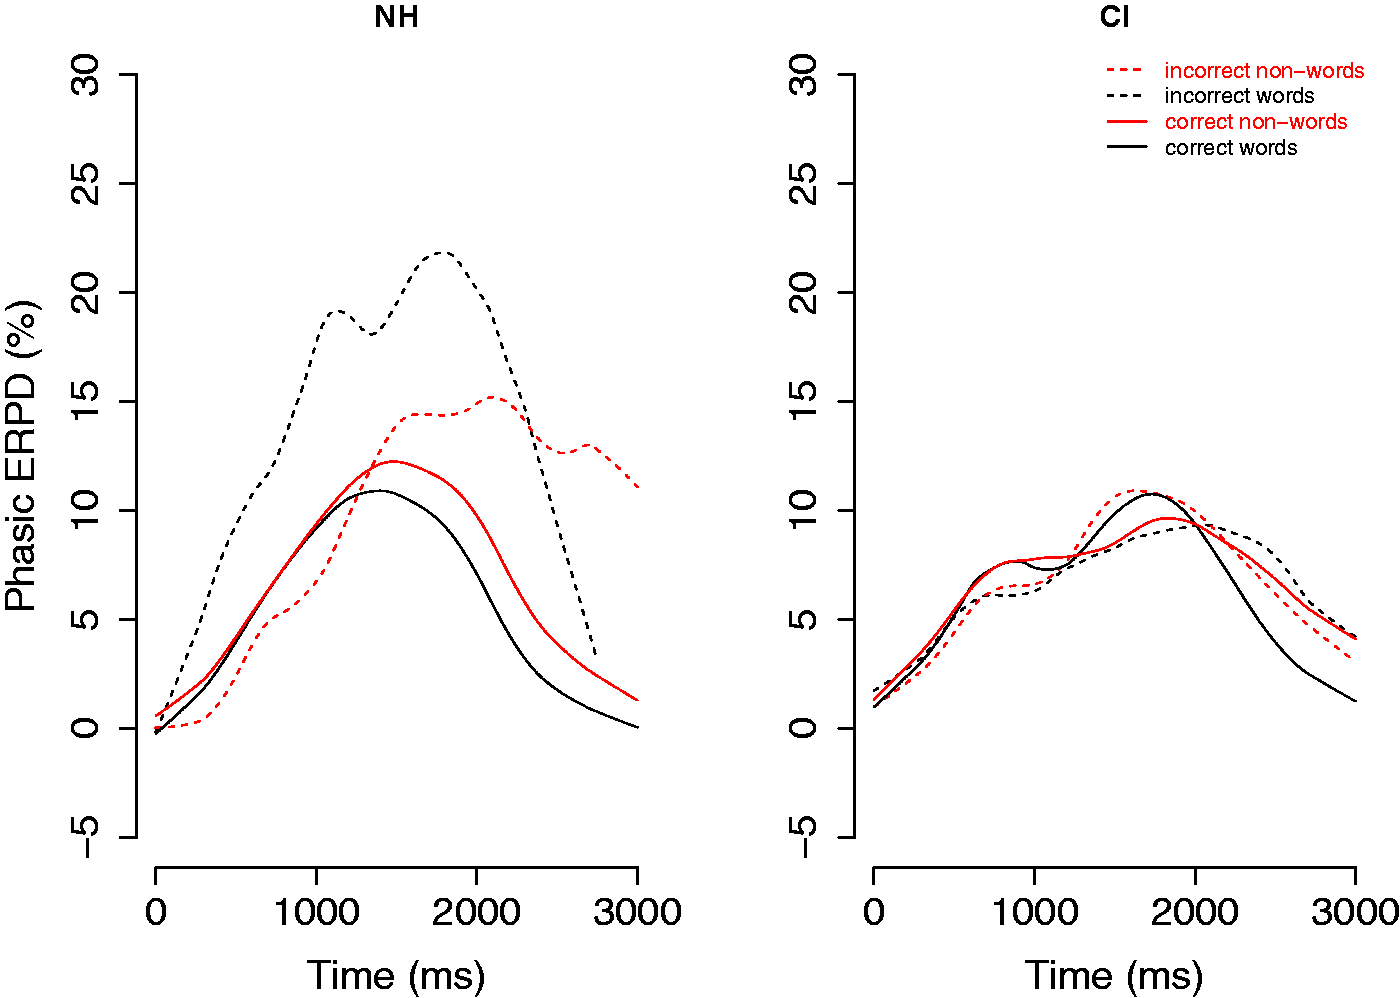
The models for the individual groups were based on the four terms (1:linear, 2:quadratic, 3:cubic, and 4:quartic) describing a fourth-order polynomial function with fixed effect Lexicality (word vs. nonword) and an interaction of Lexicality on all four terms describing the time course of the phasic ERPD. The models per group also included random effects of the linear and quadratic terms per participant.
Model Estimates for the
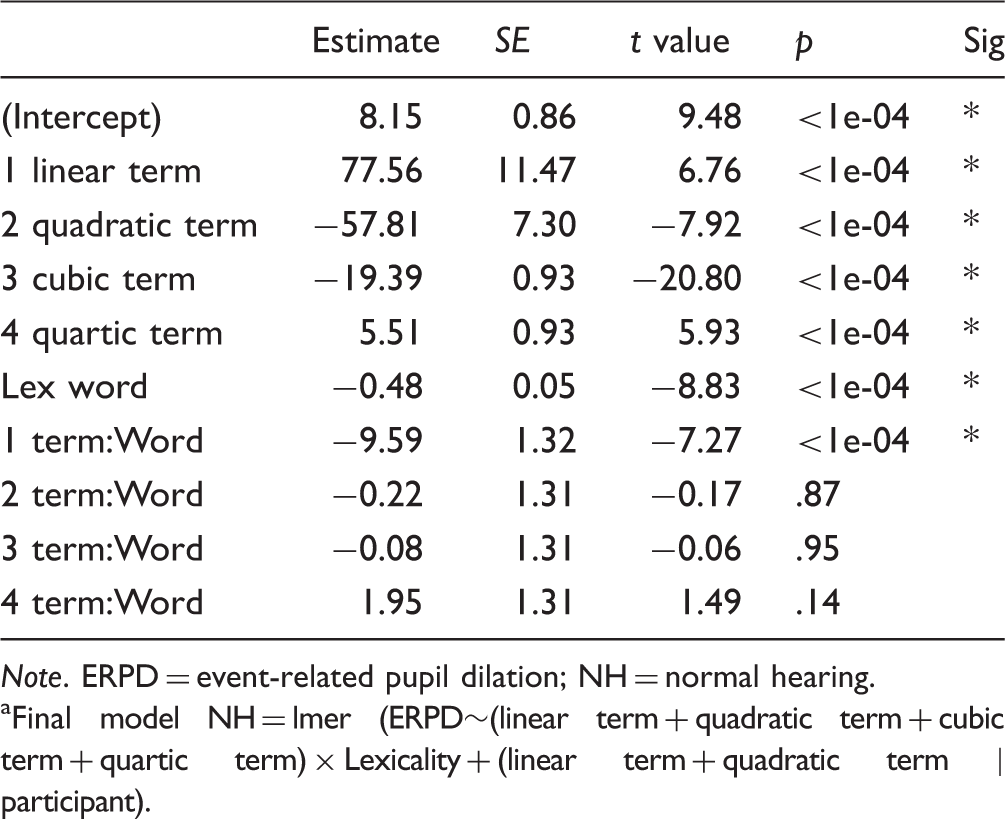
Note. ERPD = event-related pupil dilation; NH = normal hearing.
Final model NH = lmer (ERPD∼(linear term + quadratic term + cubic term + quartic term) × Lexicality + (linear term + quadratic term | participant).
Model Estimates for the CI Group. a

Note. ERPD = event-related pupil dilation; CI = cochlear implant.
Full model CI = lmer (ERPD∼(linear term + quadratic term + cubic term + quartic term) × Lexicality + (linear term + quadratic term | participant).
Further Analyses and Discussion
When inspecting Figure 1, it appears that the overall phasic ERPD is smaller for the CI group than for the NH group. Several factors could contribute to this difference. For example, NH listeners may be exercising more effort than CI users when performing this task. Or, alternatively, are listeners with a CI allocating less attention to the lexical decision task because their attentional resources are allocated to earlier sensory processing stages? Are we measuring different processes due to varying demands of the task on the population and hence, in fact, measuring varieties of effort? To address these issues, we have investigated the phasic ERPD, and how it interacts with the highly heterogeneous population. More specifically, we performed further analyses to investigate what effects can contribute to the differences between groups, such as differences in tonic changes to the pupil size baseline, individual variability, and differences in task demands.
Baseline Differences
Decreasing task-related pupil dilation throughout the course of an experiment has been interpreted as a decrease in participants’ arousal due to increased familiarity with the task, which is visible after just a few trials (Polt, 1970), or as due to fatigue (McGarrigle et al., 2017), which would require prolonged task engagement for healthy individuals. HI listeners often report increased effort when listening to speech (e.g., Downs, 1982), which is likely due to increased demands to sustain attention when listening. This encompasses that the experimental situation and listening to single words over a period of roughly 15 min, as was done in the present experiment, can be demanding and make listeners with a CI more fatigued or disengaged from the task (attentional lapses) than NH listeners. For NH listeners for whom this task is less demanding, we can thus expect a decrease in pupil size throughout the experiment due to familiarization with the task procedure. CI listeners’ pupil size may decrease less when the decrease in arousal due to task familiarity is slowed down by the demand to sustain attention. We investigated this by comparing the changes to tonic pupil dilation in the baseline throughout the experiment (i.e., relation of the ERPD pretrial baseline to the PEB), as well as the size of changes in the phasic ERPD throughout the experiment.
Before investigating potential effects on tonic changes to pupil baseline, we needed to establish that both participant groups started the task investing an equivalent level of effort. Mean PEB for the NH listeners was 688.78 eye tracker camera pixels (SD = 364.47), whereas that of CI users was 941.52 eye tracker camera pixels (SD = 328.39). To compare the two groups, we conducted an equivalence test on the PEB using a Bayesian t test (BayesFactor; as implemented in R by Rouder, Speckman, Sun, Morey, & Iverson, 2009). The test yielded a Bayes factor of 1.42, which, according to the interpretation metric of Jeffreys (1961), is “barely worth mentioning.” (p.432). We therefore concluded that the PEBs were equivalent between the two groups.
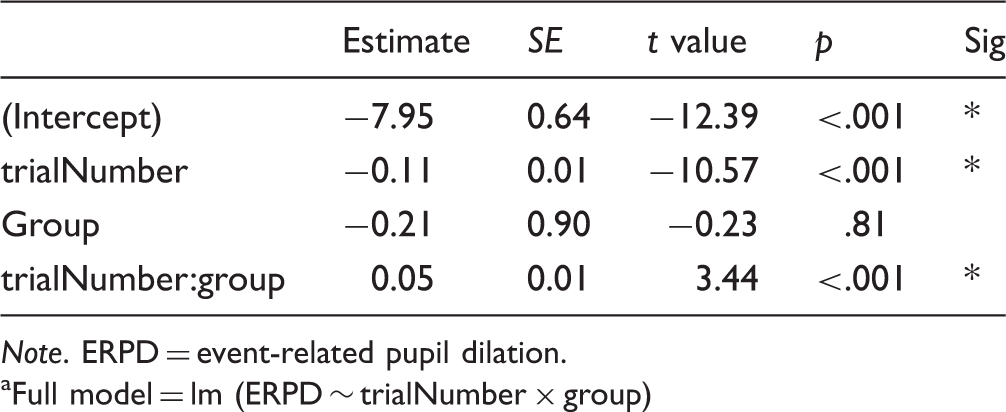
Figure 2 displays the tonic changes to pupil baseline across the trials for CI listeners (red dots) and NH listeners (black dots). The dots represent the percent change in pretrial baseline in relation to PEB as a function of trial, averaged across participants. Figure 2 shows changes in baseline pupil size throughout the experiment, that is, a decrease in baseline pupil size, which, however, was less consistent and slower in progression for the CI group. In fact, a multiple regression model fitted to these data showed that the slope of the function for CI listeners was about half (coefficient for slope −0.06) the slope of NH listeners (coefficient for slope −0.11, see Table 5 for the model’s estimates). In line with previous findings, we can interpret this as familiarization with the task (Polt, 1970), which was faster for NH than for CI participants. Alternatively, we can interpret this as reflecting differing degrees of fatigue (McGarrigle et al., 2017) across the groups. Another interpretation, however, could be that we are not just capturing gradual differences between the groups but different processes per group. The decrease in baseline pupil size in NH listeners may reflect familiarization with the task, which is accompanied by a decrease in the level of arousal. The smaller decrease in baseline pupil size for the CI listeners, on the other hand, may result from the need to sustain attention to process speech, which may individually vary within the heterogeneous population of CI users. The average response may display a mix of changes in the level of arousal due to the need to sustain attention and familiarization with the task. Further research is necessary to corroborate these interpretations, in particular with a greater focus on data from individual participants and their subjective effort evaluation.
Changes relative to the resting state baseline (PEB) throughout the experiment averaged across participants and ordered by experimental trial number (i.e., trials starting after the first four practice trials). Tonic changes in pretrial baseline related to PEB are represented in black (NH) and red (CI). Dots represent trials averaged across participants. The models and their confidence intervals are displayed as lines and areas. Models and confidence intervals for the peak changes in phasic ERPD are displayed in gray (NH) and orange (CI). Model Estimates for State-Related ERPD Changes.
a
Note. ERPD = event-related pupil dilation. Full model = lm (ERPD ∼ trialNumber × group)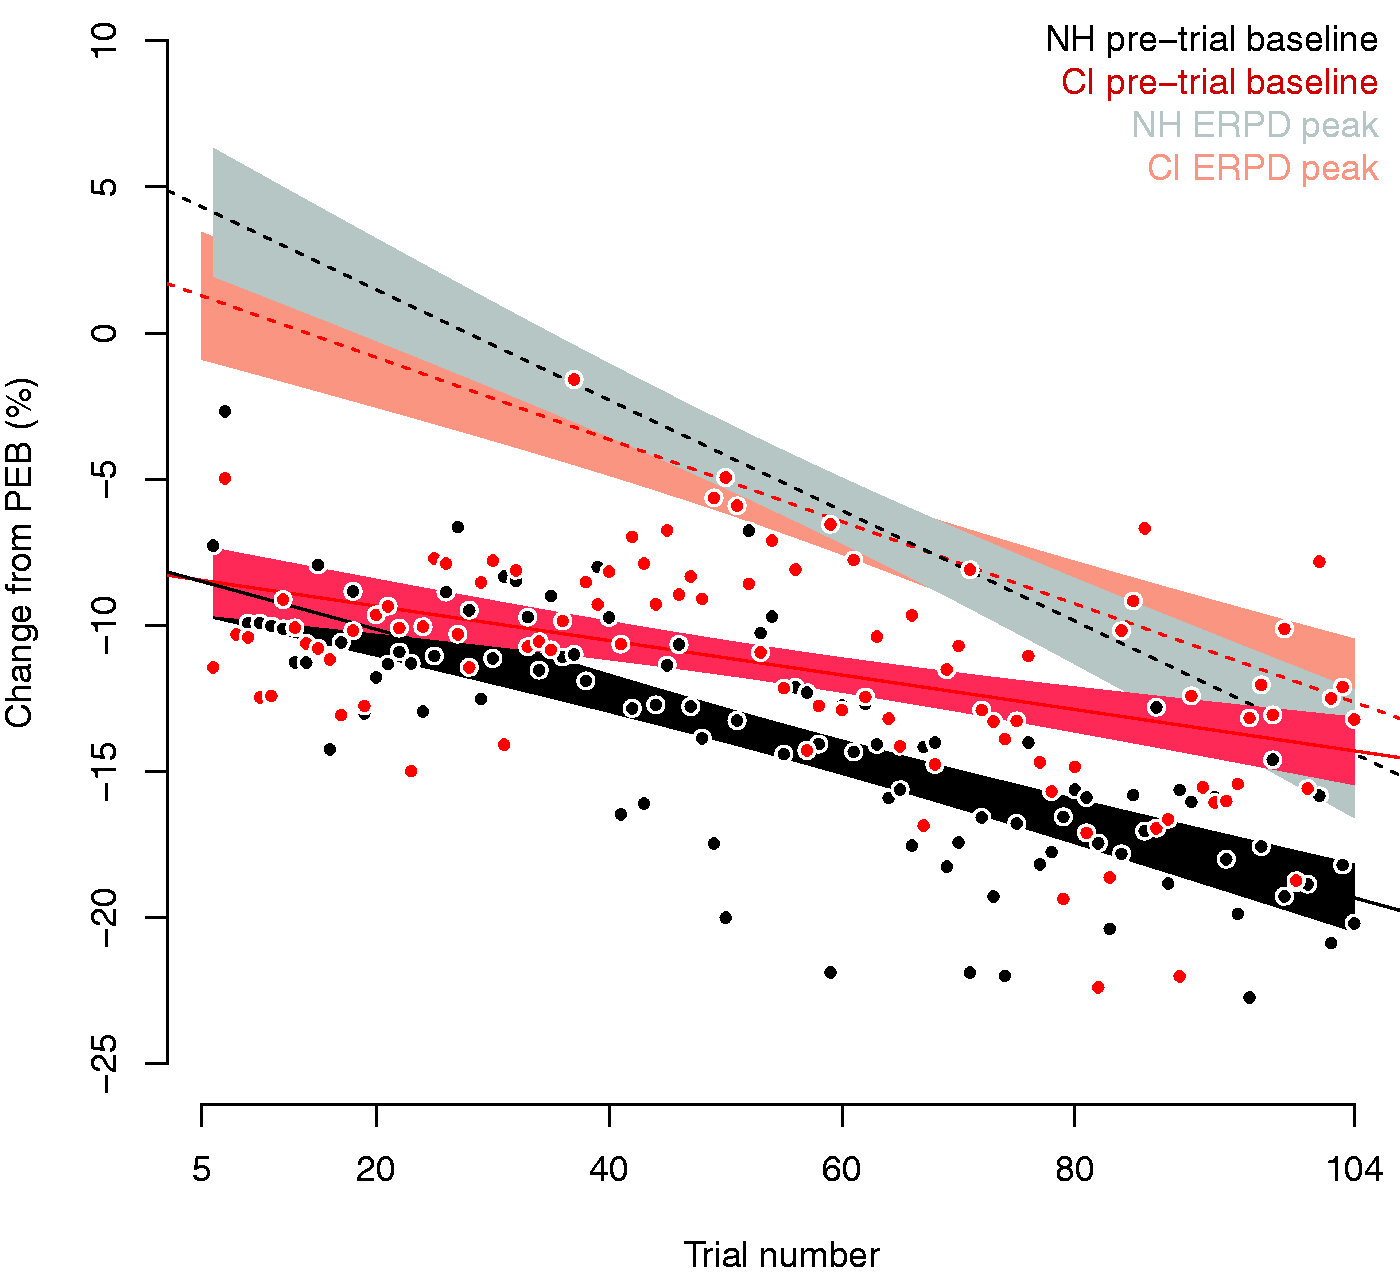
Model Estimates for Changes in the Pretrial Baseline. a
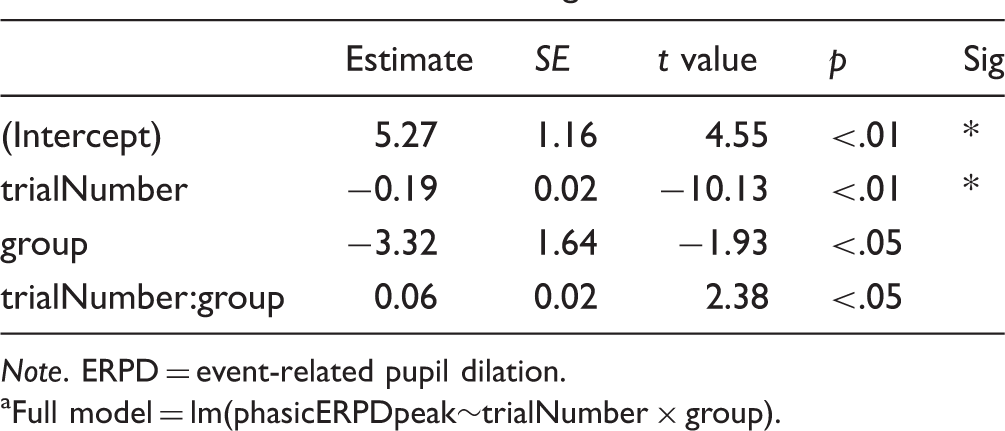
Note. ERPD = event-related pupil dilation.
Full model = lm(phasicERPDpeak∼trialNumber × group).
The differing rates of change in tonic versus phasic dilations between the groups suggest that the participation in the experiment itself—and not only the experimental manipulation—posed different demands on the two populations. Individuals within the CI group might have engaged greater attention to sustain their performance when listening to the stimuli throughout the experiment. This greater demand on their processing, however, is leveled out in the grand mean comparison between the groups, where phasic and tonic changes in pupil dilation contribute differently to the (averaged) responses between groups.
We can speculate that sustained attention limited the decrease in tonic changes to pupil baseline across trials for CI users or potentially led to more frequent lapses of engagement. Peavler’s (1974) observed stagnation of pupillary responses to a task due to information overload, and also Gilzenrat et al. (2010) report an inverse relation between changes in pupil size in the baseline and the task-evoked pupil response. Peavler (1974) and Gilzenrat et al. (2010) report paradigms that required longer on-task times than the present study. A prolonged duration in a task, however, is not necessary for lapses in engagement to occur. Rather, fluctuations in the level of engagement in a task appear to have a functional role in the regulation of participants’ state of control (Lenartowicz, Simpson, & Cohen, 2013). Fluctuations in attention or short-lived lapses of engagement in a task, are (a) related to behavioral performance, (b) reflected in tonic changes in pupil size (Unsworth & Robinson, 2016), and (c) reflective of individuals’ level of arousal and alertness (Murphy, Robertson, Balsters, & O'connell, 2011).
Individual Differences
Traditionally, pupillometry as an aggregated measure reflects the general trend within a population while ignoring the within-group differences. At the same time, this procedure requires that the data be collected from the same pool of participants who possess a similar command of control over the task. Figure 1 shows that the curves of the phasic ERPD for NH listeners appear to not differ as much from the curve for CI users in the overall height of the curve but rather in their morphology. In fact, the curves for CI users display more than one peak. This suggests that either the processing differed between the groups or that the individual CI participants did not show a homogenous pupil response.
To disentangle these options, we consider individual responses. Figure 3 shows the time course of phasic ERPD per individual participant, averaged across items. Note that only correct responses to words contribute to those averaged curves. In practice, the plot displays the individual data, which are contributing to the grand-averaged phasic ERPD curves for the correct word responses (black solid lines plotted in Figure 1), which in Figure 3 are displayed as thick lines (black for the NH group, left panel; red for the CI group, right panel). Gray lines in Figure 3 are single participants’ phasic ERPDs. When compared with Figure 1, Figure 3 shows individual variation in both groups, whose dynamics, however, differ between groups.
Individual variability in phasic ERPD (gray lines) in NH listeners (left panel) and CI listeners (right panel). Displayed are only the correct responses for words, averaged across items. Colored lines display the grand mean for the NH (black) and CI (red).
The variation within the NH group is visible mainly in the magnitude of the response. A few single NH listeners show variation in peak latency, but overall the morphology of the course of pupil dilation is rather coherent. In fact, the great majority of individual functions follow a similar course of a slow rise in pupil dilation that peaks about 1 s after the onset of the stimulus. Based on previous literature (Hoeks & Levelt, 1993; Zekveld et al., 2010), we can attribute this rise time to cognitive demands, and hence to the task at hand.
The variation within the CI group, on the other hand, is visible in the magnitude of the response, as well as in the time course, the morphology of the curves, and the latencies and number of peak dilations. A visual inspection of the right panel shows that some individuals’ functions have more than one peak. This suggests that these pupillary responses may be reflective of the demands of different subtasks posed on individual participants.
As summarized in the Introduction section, pupil dilation can have various sources (emotional, cognitive, alertness, arousal), which lead to comparable peak dilations. However, the sources may be discernible from their timing or rise times. For example, the pupil responds to light within 150 to 400 ms (e.g., Bergamin & Kardon, 2003), to simple auditory signals, such as tones, in around 600 ms (Beatty, 1982b), to unexpected noise stimuli in about 500 ms (Wetzel et al., 2016), to human emotional noises in about 500 ms to 1 s (Wetzel et al., 2016), to social stimuli in about 600 to 800 ms (Harrison, Gray, & Critchley, 2009), and responses to pain evolve within 330 ms and 1 s (Chapman et al., 1999). As for mental arithmetic, the pupil responds within 300 ms and 900 ms (Ahern & Beatty, 1979); however, multiplication is a task composed of several subtasks, and pupil dilation captures the mental activity involved in the subtasks: There is a response to the perception of the multiplicand, as well as the multiplier, and to the solution.
If we further inspect Figure 3, we see that the auditory lexical decision task in our experiment likely contained several demanding subtasks for a number of CI users. The time courses of pupil dilation for these participants show different morphologies, peak latencies, and even number of peaks, suggesting individually differing responses to the task demands. Further research is necessary to investigate, in greater detail, the demands of specific processes on the time course of pupil dilation, in particular while taking into account individual variability in command of the processes that are underlying lexical access. Such studies are particularly relevant for HI listeners, but there is also a lack of understanding of such variability among NH listeners. Importantly, however, when averaging the more homogenous responses of NH listeners, the grand average function will level out the magnitude across individual participants but will not fundamentally change the morphology of the individual functions. The amount of different morphologies within the CI population, however, will consequently tone down the grand average response to the experimental manipulation and display rather a mixture of responses to varying subtasks involved in the experimental condition.
Different Task Demands Between the Populations and Individuals
Automatic processing of a task can lead to more coherent responses in a population (e.g., Ackerman, 1988), and speech perception can lead to consistent functions of pupil dilation when the task poses the same demands within a population (such as in ideal listening conditions, with no internal or external degrading factors). Reduction in automatic processing, however, can be observed when processing degraded speech, which increases the recruitment of attention (Wild et al., 2012), draws more strongly on central resources (Peelle, 2018), and hence increases individual variability due to potential differences in cognitive capacities. Even greater heterogeneity can be found among HI listeners, who regularly deal with increased uncertainty about their interpretation of speech due to the processing of degraded signals. In heterogeneous populations, different subtasks recruit attention to different degrees. When testing HI populations on a task as complex as speech perception, we cannot, ab initio, estimate the demands that the task will pose on a given participant. The variability in tonic changes in the baseline and in the phasic ERPD, as shown in Figure 2, together with the varying morphology of the dilation curves, indicate that our clinical population has variable loci of increased effort. The variability within the group itself can lead to differing responses to the task demands within the group, as well as between the groups.
Differing task demands within a group imply that listeners recruit central resources to differing degrees and lead to individual variability in task-related effort. In the present study, we speculate that the smaller increase in phasic ERPD for CI users can partly be explained by the leveling of responses to the auditory lexical decision due to the greater demands to sustain attention. Increased attention sustained for a longer period of time will, in turn, lead to an increased frequency of lapses in engagement and potentially also to participants’ increased need for self-monitoring of their performance. During lapses of engagement, listeners from different groups will fall back into different default modes of control of attention. The default modes of control are more homogenous within a group that performs a task in an automatic manner, because automatic processing, levels out individual variability.
General Discussion and Conclusions
We examined pupil dilation recordings during an auditory lexical decision task with the aim to elucidate some of the challenges in using pupillometry for assessing effort in speech comprehension by HI individuals. We addressed the complications that relate to the measure, to the operationalization of the task demands, and to the greater, though representative, heterogeneity within the population. Pupillometry, traditionally interpreted in terms of group grand means, provides estimates of general trends within a population by reducing the noise resulting from individual variability. This characteristic of the measure, however, can reduce the external validity and fail to capture the aspects that are consequential for the HI population, namely that there may be varieties of effort. However, what appears as a weakness of the measure could become its strength for individualized diagnostics and rehabilitation, if we examine pupil dilation in its time course and focus on individual sources of effort rather than group differences.
Pupil dilation reflects a tight link between attention, effort (Kahneman, 1973; Strauss & Francis, 2017), arousal, and participants’ state of control. For the interpretation of pupillometry with HI listeners, the current study reveals the demand for a more detailed analysis of the time course of pupil dilation within a trial, as well as a more comprehensive analysis that inspects the tonic changes, in addition to the phasic throughout an experiment and on an individual basis. The focus on single features, such as peak dilation, may fail to capture the aspects that are representative for more heterogeneous populations. In the present study, we found differences between the groups in the rate of change in their tonic to phasic responses. This evidence supports the conclusion that the participation in the experiment itself—and not only the experimental manipulation—posed different demands on the two populations.
For NH listeners, we measure a short-timed, targeted engagement of attentional resources that is necessary to execute the task. For this group of listeners, the modality (reading vs. hearing) of the task may not play a role (Klingner, Tversky, & Hanrahan, 2011). For CI listeners, the modality, namely auditory presentation, plays an important role. Listening to speech can become not only challenging but also stressful (Alhanbali, Dawes, Lloyd, & Munro, 2018) for these listeners. In this, it will affect their level of arousal and alertness (Beatty, 1982a), increase effort, lead to fatigue (McGarrigle et al., 2017), and alter their emotional state. This implies that the participation in the experiment affects participants’ mode of control (Gilzenrat et al., 2010) and may lead to reduced responses evoked by the experimental task itself.
HI listeners experience varying degrees of difficulty during speech comprehension. These individual differences are one of the main challenges for future research on hearing with HI individuals (e.g., Pisoni, Kronenberger, Harris, & Moberly, 2018). To make research on effort in speech comprehension consequential for these listeners, we need to focus on the sources of effort and their possible remedies. Speech perception involves multiple processing stages, which offers ample space for sources of effort. Individual differences in attention engaged in processing speech in HI individuals are susceptible to listeners’ capacity to process individual stages in an automatic way and their capacity to compensate for adverse conditions. These various underlying sources might be based on “varieties of attention” (Parasuraman & Davies, 1984), reflecting effort as the adaptation to subjective task demands, and hence reflecting varieties of effort.
Individual processes underlying speech perception recruit additional attention even for NH listeners, such as signal detection (Beatty, 1982a), suppression of surrounding noise (Zekveld et al., 2010), or lexical access (Kuchinsky et al., 2013; Wagner et al., 2016b). For individual CI users, the demands of the task might differ based on individual consequences of deafness, the etiology of their hearing impairment, their hearing loss history, past and present exposure to speech, motivation, and perceptual reorganization (e.g., Baş kent et al., 2016a; Blamey et al., 2013; Giraud et al., 2001). To gain a better understanding of the task demands for individual HI listeners, we need to study the range of attentional control over processing stages in speech comprehension. This requires experiments designed to single out the demands of individual subtasks (e.g., Kuchinsky et al., 2013; Mattys, Brooks, & Cooke, 2009; McGarrigle et al., 2017; Wagner et al., 2015, 2016a).
The comparison of variability and effort in speech processing between HI and NH listeners raises the question about the need for an appropriate control group. An often chosen approach is to match performance between groups by introducing more demanding conditions (e.g., signal degradations) for the better performing group of NH listeners. Lowering the performance of a control group facilitates the statistical comparison in grand-averaged responses. A challenge to such an approach is the underlying assumption that leveling performance will also level the effort involved in executing a task. Yet, lowering performance by changing task demands does not necessarily lead to leveled cognitive demands between NH and HI listeners, because long-term sensory degradation leads to structural and functional reorganization of speech processing (Blamey et al., 2013; Giraud et al., 2001; Moore & Shannon, 2009; Sharma et al., 2002). A more consequential approach for applications with HI individuals might rather be a more in-detail investigation of individual differences, as well as longitudinal studies, in which each individual is their own control and reference. Ideally, future experimental designs will investigate individual processing stages within participants, based on within-participant comparison, to establish individual listening profiles, analyze individual trajectories, and evaluate data on case-by-case basis (Curran, Edwards, Wirth, Hussong, & Chassin, 2007; Curran & Wirth, 2004).
A comprehensive and individualized approach, as suggested here, that takes specific speech perception subtasks and individual differences into account by studying pupil dilation in its time course could make a substantial positive contribution to the clinical care for HI listeners and to individualized fitting of hearing aids and CIs. Profiling HI listeners based on their effort recruited by single processing stages, from detection of the signal up to the integration of meaning within the context of a sentence, would provide information about listener’s performance on the task of speech perception itself. This would be of value for diagnostic protocols and for the choice of intervention, and it could add information about the state of the speech processing system to the protocol for preimplantation candidacy. Furthermore, such an approach could lead to rehabilitation that follows an individuals’ progress to reduce early fossilization in their speech perception performance (Vigil & Oller, 1976). Using effort to guide rehabilitation would instantiate a diagnostic approach that is based on bottlenecks in individual’s speech processing instead of dividing diagnostics and interventions into cognitive versus listening-based.
Such an approach would also contribute to our theoretical knowledge of cognitive systems and attention, as even highly automatic tasks will show increased individual variability when executed under suboptimal conditions. Which subtasks require attention, and how resources are shared when perceptual stages work in concert on a complex task, has been reason for debate for decades (e.g., Lavie, Beck, & Konstantinou, 2014; Logan, 1978). Pupillometry studies with clinical populations can contribute to this debate, as they depict cases that challenge our existing models of attention. Furthermore, clinical populations, more than others, form crucial support for the call to acknowledge rather than reduce individual differences within experimental designs and analyses (e.g., Molenaar, 2004; Pisoni et al., 2018). Taking individual differences into account is necessary to establish external and internal validity of experiments in hearing science and psychology, and in the clinic.
Footnotes
Acknowledgments
We would like to thank Prof. Frans Cornelissen (University Medical Centre Groningen) for providing the eye tracker for this study and the Center for Information Technology of the University of Groningen for their support and for providing access to the Peregrine high-performance computing cluster.
Author Note
The study is part of the research program of our department: Healthy Aging and Communication.
Declaration of Conflicting Interests
The authors declared no potential conflicts of interest with respect to the research, authorship, and/or publication of this article.
Funding
The authors disclosed receipt of the following financial support for the research, authorship, and/or publication of this article: This research work was supported by a Marie Curie Intra-European Fellowship (FP7-PEOPLE-2012-IEF 332402) and by a MED-EL research grant, a VIDI grant from the Netherlands Organization for Scientific Research (NWO), the Netherlands Organization for Health Research and Development (ZonMw) grant no. 016.093.397, and funds by the Heinsius Houbolt Foundation.