
Abstract
The purpose of this study was to evaluate the relationship between emotional responses to sounds, hearing acuity, and isolation, specifically objective isolation (social disconnectedness) and subjective isolation (loneliness). It was predicted that ratings of valence in response to pleasant and unpleasant stimuli would influence the relationship between hearing loss and isolation. Participants included 83 adults, without depression, who were categorized into three groups (young with normal hearing, older with normal hearing, and adults with mild-to-moderately severe hearing loss). Participants made ratings of valence in response to pleasant and unpleasant nonspeech sounds, presented at a moderate overall level in the laboratory. Participants also completed questionnaires related to social disconnectedness and loneliness. Data were analyzed using multiple regression with questionnaire scores as dependent variables. Independent variables were age, gender, degree of hearing loss, perceived hearing handicap, number of depressive symptoms, mean valence rating in response to unpleasant sounds, and mean valence rating in response to pleasant sounds. Emotional responses to pleasant sounds explained significant variability in scores of both social disconnectedness and loneliness. Depressive symptoms also explained variability in loneliness scores. Hearing loss was not significantly related to social disconnectedness or loneliness, although it was the only variable significantly related to ratings of valence in response to pleasant sounds. Emotional responses to pleasant sounds are related to disconnectedness and loneliness. Although not related to isolation in this study, hearing loss was related to emotional responses. Thus, emotional responses should be considered in future models of isolation and hearing loss.
Introduction
Isolation represents a significant challenge for clinicians because it is a clear and chronic threat to physical and mental health. Isolation has been linked to a myriad of health consequences, such as poor cardiovascular health, increased susceptibility to disease and increased mortality risk (Berkman & Syme, 1979; Gopinath, Rochtchina, Anstey, & Mitchell, 2013; Perissinotto, Cenzer, & Covinsky, 2012; Tomaka, Thompson, & Palacios, 2006; Uchino, Cacioppo, & Kiecolt-Glaser, 1996; Zhang, Norris, Gregg, & Beckles, 2007), as well as increased risk of dementia and cognitive decline (Bassuk, Glass, & Berkman, 1999; Wang, Karp, Winblad, & Fratiglioni, 2002; Wilson et al., 2007). In addition, social networks facilitate in-home rehabilitation and reduce the risk of long stays in extended care facilities and hospitals (Anderson et al., 2000; Boaz & Muller, 1994; Skinner, Tennstedt, & Crawford, 1994). Consequently, it is of considerable interest to identify and mitigate factors that increase isolation.
One common distinction in the literature is difference between objective and subjective isolation (e.g., Rook, 1984; Steptoe, Shankar, Demakakos, & Wardle, 2013). Objective isolation has been described as a lack of social networks or social engagement; objective isolation has also been termed social disconnectedness (Cornwell & Waite, 2009) or social isolation (Weiss, 1973). Subjective isolation has been described as a sense of lack of belonging or a dissatisfaction with one’s social network (Dahlberg & McKee, 2014); subjective isolation has also been termed loneliness (Steptoe et al., 2013) or emotional isolation (Weiss, 1973). Subjective and objective isolation have been shown to differentially affect mortality (Steptoe et al., 2013) and health outcomes (Cornwell & Waite, 2009) and are typically only moderately correlated (Tomaka et al., 2006; Van Baarsen, Snijders, Smit, & Van Duijn, 2001). For the remainder of the article, “disconnectedness” will be used to indicate objective isolation, and “loneliness” will be used to indicate subjective isolation.
Hearing loss is one factor that has received considerable research attention as a potential risk factor for isolation, which is not surprising given its high prevalence, particularly among the aging population (e.g., Lin, Thorpe, Gordon-Salant, & Ferrucci, 2011). In situations where hearing is difficult and greater cognitive resources are necessary for communication (e.g., Murphy, Craik, Li, & Schneider, 2000; Picou & Ricketts, 2014), it might be expected that adults with hearing loss would socially withdraw or avoid social encounters. For example, if communication is difficult, a person might choose to simply skip an event when motivation for attending is not high enough (Matthen, 2016). The consequences of this type of withdrawal could be significant. Monzani, Galeazzi, Genovese, Marrara, and Martini (2008) suggest that limited social engagement secondary to hearing loss leads to depressive symptoms and irritability, both of which compound the problem of isolation.
Indeed, researchers have confirmed a relationship between hearing loss using measures that evaluate disconnectedness and loneliness (Chia et al., 2007; Mick, Kawachi, & Lin, 2014; Perissinotto et al., 2012; Sung, Li, Blake, Betz, & Lin, 2016). For example, in a large scale population study, Hawthorne (2008) found that self-reported hearing loss was the second strongest predictor of loneliness behind depression. Similarly, Weinstein and Ventry (1982) reported that among United States military veterans, perceived hearing difficulties accounted for the greatest proportion of variance in loneliness scores. The relationship was related to degree of hearing loss; individuals with more perceived hearing difficulties were likely to report more loneliness.
However, not all studies have confirmed a consistent association between hearing loss and isolation. Several investigators have reported that the association is limited to certain subgroups. For example, Mick et al. (2014) found a significant relationship between hearing loss and isolation, but only for women aged 60 to 69 years. Conversely, Pronk et al. (2011) have reported associations between hearing loss and isolation for men who were non-hearing aid users, men who deny their hearing loss, those with chronic health conditions, and people with higher socioeconomic status (Pronk, Deeg, & Kramer, 2013). Furthermore, Stam et al. (2016) reported that the relationship between hearing-in-noise ability was significantly related to isolation, but only for participants with a higher educational level.
One of the themes in the literature that can explain the apparent inconsistencies in the findings is advanced age, which could have a complex effect on the interaction between hearing loss and isolation. Specifically, the prevalence of hearing loss increases with age (e.g., Lin et al., 2011). However, the overall prevalence of isolation might actually decrease with age due to unbalanced samples resulting from the increased mortality rate associated with isolation (e.g., Mick et al., 2014). Furthermore, older adults tend to have lifestyles which put fewer demands on hearing (Wu & Bentler, 2012), so hearing loss might have a smaller psychosocial effect for an older adult than a younger one. These factors might explain some of the inconsistent findings, particularly in studies where specific age-related subgroups demonstrated a significant relationship between hearing loss and isolation.
Emotional Responses
One factor not previously investigated as affecting the relationship between hearing loss and isolation is auditory emotion perception. There are at least two general facets related to auditory emotion, emotion recognition, and elicited emotion (Picou et al., 2018). For this article, emotion recognition is defined as a listener’s ability to identify or recognize the emotional content in a message. Emotion recognition is often measured as a listener’s ability to perceive emotion in others. Conversely, elicited emotion is defined here as the degree to which someone is affected by emotional stimuli. That is, elicited emotion is measured as a listener’s own emotional response to a stimulus. Both emotion recognition and elicited emotion have the potential to affect isolation. However, the focus of this article is on elicited emotion, specifically in response to sounds.
Most of the variability in emotional responses can be captured with two dimensions: valence (pleasant vs. unpleasant) and arousal (exciting vs. calming; Bradley & Lang, 1994; Osgood, Suci, & Tannenbaum, 1957; Russell, 1980; Russell & Mehrabian, 1977; Watson & Tellegen, 1985). According to this dimensional view, emotions can be high or low on either dimension. Bradley, Codispoti, Cuthbert, and Lang (2001) propose that the two dimensions reflect the underlying organization of human behavior. The authors argue that the arousal dimension reflects the intensity of an experienced emotion, whereas the valence dimension reflects direction. Unpleasant or aversive stimuli serve to prepare a body for action (e.g., tending to a crying baby), while pleasant or appetitive stimuli serve to motivate a person to move toward them to enhance a person’s well-being (e.g., listening to music; Lang, 1995).
Based on this theory of behavioral organization, one might expect that factors which limit pleasant or appetitive responses to situations would reduce the likelihood that a person would approach a situation. Within the context of social function, if responses to pleasantly valenced stimuli were more neutral, it would be reasonable to expect a person to be less likely to approach or engage in pleasant social situations, especially under less than optimal circumstances. In other words, without the reward of pleasant emotions, the cost of participating might outweigh the reward, which would lead to increased motivation to perform alternative tasks, such as watching television alone. Although not the only factor, reduced pleasant emotional responses might limit motivation for leaving the house, which might eventually lead to isolation.
If a listener’s emotional responses to unpleasant or aversive stimuli are somehow heightened, they might also be less likely to approach or engage in social activities if they find sounds they encounter to be aversive. Consistent with this hypothesis, Cacioppo, Norris, Decety, Monteleone, and Nusbaum (2009) found that people who are lonely are less rewarded by visual social stimuli compared to people who are not lonely. The authors also reported that people who are lonely were more sensitive to unpleasant social pictures than their nonlonely counterparts.
Emotional Responses and Hearing Loss
One factor that has recently been shown to affect ratings of valence in response to pleasant and unpleasant auditory stimuli in laboratory settings is hearing loss. To date, two studies have documented effects of hearing loss on elicited emotion. Husain, Carpenter-Thompson, and Schmidt (2014) used a combination of imaging and behavioral tasks to evaluate responses to emotional stimuli for middle-aged listeners with normal hearing or mild-to-moderate hearing loss. Results indicated that listeners with hearing loss were less affected by both pleasant and unpleasant emotional stimuli than their peers with normal hearing. The behavioral results were also reflected by differences in cortical activation between groups. These findings are consistent with those reported by Picou (2016), which indicated listeners with mild-to-moderate hearing loss demonstrated a reduced range of ratings of valence in response to nonspeech sounds compared to similarly aged listeners with normal hearing. Although hearing loss disrupts ratings of valence and hearing loss increases the risk of isolation, the relationship between ratings of valence and isolation has not been previously evaluated.
Purpose
The purpose of this project was to evaluate the relationship between emotional responses measured in the laboratory, isolation, and hearing acuity. The Social Disconnectedness and Perceived Isolation scales (Cornwell & Waite, 2009) were used to measure objective and subjective isolation, respectively. It was expected that hearing loss would explain some of the variability in isolation. In addition, based on the dimensional view of human behavior organization proposed by Bradley et al. (2001), it was expected that ratings of valence in response to pleasant and unpleasant sounds would explain additional variability in isolation. Specifically, it was expected that people with hearing loss who rated pleasant and unpleasant sounds as neutral would be more likely to exhibit isolation than their peers who rated pleasant sounds as pleasant and unpleasant sounds as unpleasant.
Materials and Methods
Participants
Participants included 83 native English-speaking adults (51 females), all of whom participated in this study as part of one of two larger study protocols. Forty participants were included in a previous study investigating the effects of hearing loss on emotional responses to sounds (Picou, 2016). The remainder participated in a study related to hearing aids and emotional responses (unpublished data). Both studies included groups of listeners with normal hearing. Participants with normal hearing were identified via word of mouth in the Department of Hearing and Speech Sciences and also via e-mail blast to Vanderbilt University Medical Center affiliates who have opted in to research recruitment notifications. Participants with hearing loss were recruited via the Vanderbilt Bill Wilkerson Center hearing clinic; potential participants were identified via chart review and were mailed a letter inviting them to participate in the study. Scheduling was accomplished via follow-up phone calls or e-mail exchanges.
Participant Demographics for the Three Types of Participants.

Note. Numbers reflect means, numbers in parentheses reflect standard deviations, and ranges are displayed in the row below each demographic.
Demographic variables included in multiple linear regression analyses. HADS = Hospital Anxiety and Depression Scale; HHIA = Hearing Handicap Inventory for Adults total score.
Participants’ better ear, pure-tone average (PTA) thresholds were calculated based on air conduction audiometric hearing thresholds of 0.5, 1.0, 2.0, and 4.0 Hz. Participants with normal hearing who were young did not undergo full audiometric evaluation and were instead screened at 20 dB HL as part of the procedures outlined in Picou (2016). For the purpose of this study, they were each assigned PTA values of 20 dB as a conservative estimate of their hearing thresholds. Measured hearing thresholds for the remainder of the participants are shown in Figure 1.
Mean right and left pure-tone, air conduction audiometric thresholds for study participants with normal or near normal hearing (left panel) and with hearing loss (right panel). Light gray lines indicate individual participants and black lines indicate mean data for the group.
Participants exhibited a range of perceived hearing handicap, as evidenced by their scores on the Hearing Handicap Inventory for Adults (HHIA; Newman, Weinstein, Jacobson, & Hug, 1990), shown in Table 1. The HHIA consists of 25 questions related to social (12 questions) or emotional (13 questions) effects of hearing loss. For each question, response options are yes (4 points), sometimes (2 points), and no (0 points). Thus, the range of possible total scores (combined across social and emotional scales) is 0 to 100. Participants were instructed to complete the HHIA and HADS scales based on their perception during every day activities with or without hearing aids, whichever was most common. All study recruitment and data collection procedures were conducted with approval from Vanderbilt University Medical Center’s Institutional Review Board (#140837 and #150523). Study procedures were explained to the participants, who provided written consent prior to testing. Participants were compensated for their time.
Isolation
Participants completed the Social Disconnectedness and Perceived Isolation Scales (Cornwell & Waite, 2009). All participants completed the scales in a “paper and pencil” format. Cornwell and Waite’s (2009) Social Disconnectedness scale consists of 11 questions related to social isolation. Six of the 11 questions are related to the size of the respondent’s social network (marriage status, number of cohabitants, number of friends, and number of children). The remaining five questions are related to the frequency of social activity. For each activity, participants indicate on a scale of 0 to 7 how often they engage in an activity, where 0 indicates “never” and 7 indicates “every day of the week.”
Central Tendencies for Each Group of Listeners on the Disconnectedness Scale.

Note. Unless otherwise indicated, values reflect median, with the range in parentheses. Responses to questions related to frequency are on a scale of 0 to 7 where 0 indicates every day of the week and 7 indicates never. Standardized z-scores in the bottom row were used for multiple regression analysis.
Total score reflects the sum of questions.
Cornwell and Waite’s (2009) Perceived Isolation scale consists of nine questions. Three questions in this scale relate to how often a respondent feels they can talk about worries with their family, friends, and spouse (if applicable). Three questions related to how often a respondent feels they can rely on their family, friends, and spouse (if applicable) if they have a problem. Response options were 1—often, 2—some of the time, or 3—hardly ever or never. Analysis of responses to these six questions revealed poor internal consistency for the young listeners with normal hearing (Cronbach’s α = .28), although higher internal consistency for the older listeners with normal hearing and the listeners with hearing loss (Cronbach’s α = .66 and .87, respectively). Consequently, the responses to these six questions were not analyzed further.
Central Tendencies for Each Group of Listeners on the Loneliness Scale.

Note. For each question, values of 1, 2, and 3 indicate “hardly ever,” “some of the time,” and “often,” respectively. Unless otherwise indicated, values reflect median, with the range in parentheses. Standardized z-scores in the bottom row were used for analysis.
Total score reflects the sum of questions.
Emotional Responses
Laboratory testing included a hearing evaluation (or hearing screening) and responding to emotionally evocative nonspeech sounds. The nonspeech sounds used were 61 tokens from the International Affective Digitized Sounds (IADS) Corpus (Bradley & Lang, 2007), a large corpus of nonspeech sounds which elicit a range of valence and arousal responses (Bradley & Lang, 2000). Participants rated 26 tokens expected to elicit pleasant responses (e.g., applause, laughter, birds chirping) and 35 tokens expected to elicit unpleasant responses (e.g., dentist drill, crying, vomiting). See the Appendix for the list of sounds and their expected valence category. The sounds were 1.5 s in length and matched for peak level.
The Self-Assessment Manikin (SAM; Bradley & Lang, 1994) was used to assist participants in rating their emotional responses. The SAM includes figures representing the valence and arousal dimensions of emotion. For each dimension, the SAM has five cartoons illustrating the range of the dimension (e.g., for valence, the pictures range from a smiling face to a frowning face with a neutral face in the middle). Possible scores range from 1 to 9, where 9 indicates a high score on a dimension (very pleasant or very exciting) and 1 indicates a low score on the dimension (very unpleasant or very calming).
During testing in the laboratory, a participant was seated in the center of a sound-attenuating, audiometric test booth (4.0 × 4.3 × 2.7 m) while facing a computer screen (21.5-in. Dell S2240T) and holding a universal serial bus (USB) keypad (Targus). Stimuli were presented from a computer (Dell) outside the test booth via custom programming (Neurobehavioral Systems Presentation v 14) to an audiometer (Madsen Orbiter 922 v.2) for level control and then to a transducer (see later for transducer details). During stimulus presentation, a black cross was displayed on a white background. After each sound finished playing, the SAM valence scale was displayed with the numbers 9 through 1 marked under the figures. A participant was expected to make a numerical response using the keypad. Following the valence rating, the SAM arousal figures were displayed with the numbers 9 through 1 indicated under the figures. A participant was expected to make another rating using the computer keypad. Testing was self-paced, although participants were instructed not to spend too long on any single item.
Stimuli were presented in a random order at a moderate input level. Because participants were tested as part of one of two larger study protocols, the presentation level was 50 dBA for 25 participants, 60 dBA for 40 participants, and 65 dBA for 18 participants. In addition, the transducer was either headphones (Sennheiser HDA 200; n = 42) or a loudspeaker (Tannoy Series 600; n = 41). Because previous work suggests that presentation level does not affect emotional responses to sounds across input levels between 50 and 65 dBA (Picou, 2016), the difference in level was not expected to affect the results (confirmed statistically for the current data set later).
Mean Rating of Valence for Each Group of Listeners.

Note. Numbers in parentheses reflect standard deviation. Ratings of valence range from 1 (most unpleasant) to 9 (most pleasant), with 5 indicating neutrality.
Data Analysis
Multiple regression analyses were conducted with social disconnectedness or loneliness scores as dependent variables. To facilitate data interpretation and analysis, scores for each scale were converted to z-scores based on the sample mean and standard deviation, where positive values reflect more disconnectedness or loneliness. These converted scores were used in all analyses. Each analysis included six independent variables: (1) gender (male and female), (2) age (in years), (3) better ear PTA (average of 0.5, 1.0, 2.0, 4.0 kHz in dB HL), (4) perceived handicap (total HHIA score; higher value indicates higher perceived handicap), (5) depressive symptoms (HADS-D scale, higher value indicates more depressive symptoms), (6) mean valence ratings of unpleasant IADS stimuli (lower value indicates higher perceived unpleasantness), and (7) mean valence rating of pleasant IADS stimuli (higher value indicates higher perceived pleasantness).
Prior to multiple regression analyses, cases with leverage values greater or equal to 0.5 and studentized residuals of greater than three standard deviations were excluded. As a result, three data points were removed, leaving a sample size of 81 for both social disconnectedness and loneliness. Although the responses to individual items on the scales and during the emotional response task are Likert-like and ordinal (e.g., rank ordered), the data entered into regression analyses reflect overall scores based on a combination of scale items or ratings. Thus, the overall scores, which reflect the summing or averaging across individual items, are interval in nature and are appropriate for parametric analysis, such as multiple linear regression (for summary of this argument, see Carifio & Perla, 2008). Importantly, empirical work demonstrates that satisfying the assumptions of normality is more important than the type of measurement scale type for parametric analyses (e.g., Armstrong, 1981; Baker, Hardyck, & Petrinovich, 1966; Kim, 1975; Sullivan & Artino, 2013). Data in this study were normally distributed and met all assumptions necessary for multiple linear regression analysis.
Results
Isolation Scores
Regression Coefficients and Standard Errors of the Model of Disconnectedness.

Note. B = unstandardized regression coefficient; SEB = Standard error of the coefficient; β = standardized coefficient; p = significance value.
p < .05.
Regression Coefficients and Standard Errors of the Regression Model of Loneliness.

Note. B = unstandardized regression coefficient; SEB = Standard error of the coefficient; β = standardized coefficient; p = significance value.
p < .05. **p < .01.
Exploratory Analyses of Isolation
Note that the regression analyses did not include all potentially relevant dependent variables. For example, a person’s experience with hearing loss, as indicated by duration of loss, might affect isolation. However, in this study population, duration of hearing loss and PTA were significantly correlated (r = .75, p < .001). Thus, the collinearity of degree and duration of hearing loss would have confounded the multiple regression analyses.
Excluded from original analyses were two variables that have been related to isolation, including socioeconomic status (e.g., Perissinotto et al., 2012), and hearing aid use (Joore, Brunenberg, Chenault, & Anteunis, 2003; Pronk et al., 2013; Stam et al., 2016; Tesch-Römer, 1997; Weinstein, Sirow, & Moser, 2016). It is also possible that the assignment of 20 dB HL thresholds for younger participants with normal hearing affected the regression results. However, the inclusion of socioeconomic status (as indicated by median income for a participant’s zip code) and hearing aid use (as indicated by the length of hearing aid experience) did not affect the results of the regression analyses, neither did changing the threshold assignment for younger listeners with normal hearing to a more conservative estimate of 10 dB HL.
Finally, sound stimuli in the study included a mixture of nonspeech sounds, some of which convey social information (e.g., laughter, crying) and some of which do not (e.g., carousel, hiccup). Previous work demonstrates that lonely and nonlonely participants are evident in responses to social stimuli, but not nonsocial stimuli (Cacioppo et al., 2009; Silva et al., 2017). To explore the possibility that the nature of the sounds influenced the relationship between emotional responses and isolation, emotional responses were calculated separately for responses to social and nonsocial sounds (see Appendix for indication of which sounds were labeled “social”). Emotional responses to both social and nonsocial sounds were highly correlated (r = .70, p < .001 for pleasant and r = .54, p < .001 for unpleasant). In addition, both exhibit high internal reliability (Cronbach’s α = .81 and .70 for pleasant and unpleasant sounds, respectively). These data indicate that responses to social and nonsocial sounds used in this study were quite similar, but not identical. Exploratory multiple regression analyses using responses to social and nonsocial sounds separately revealed responses to pleasant social sounds might be more strongly related to disconnectedness (β = − 0.31) and loneliness (β = −0.33) than nonsocial sounds (β = −0.20 and β = −0.22 for disconnectedness and loneliness, respectively), supporting the distinction in future investigations.
Ratings of Valence
As a result of the significant contribution of ratings of valence to isolation, it was of interest to evaluate variables that have the potential to explain some of the variability in emotional responses. The independent variables evaluated were gender (male and female), age (in years), PTA (0.5, 1.0, 2.0, 4.0 kHz in dB HL), and depressive symptoms (HADS-D score). It was also of interest to include variables that were inherent to the data set and could affect emotional responses, notably transducer (headphones and loudspeaker) and stimulus level used for testing (50, 60, or 65 dBA).
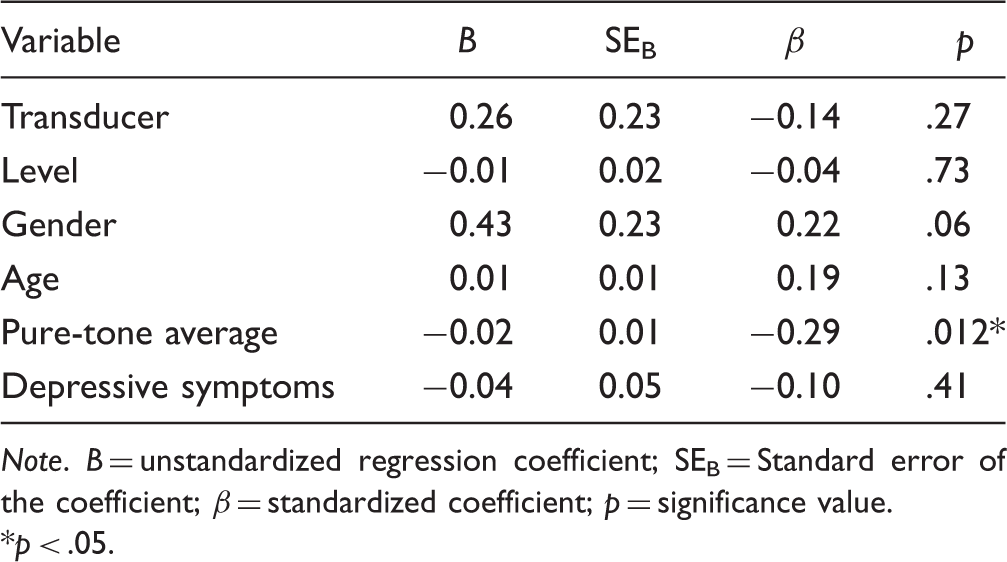
Table 7 shows the results of the regression analysis with valence ratings in response to pleasant sounds as the dependent variable. The overall regression model was significant, F(6, 73) = 2.97, p < .05, 1 − β = 0.84, adj R2 = .13). Only PTA explained significant portion of variance in ratings of valence (p < .05); higher degree of hearing loss was associated with less pleasant ratings of pleasant sounds (see Figure 2).
Relationship between degree of hearing loss and emotional responses to pleasant (+) and unpleasant (−) sounds. Linear equations are displayed for each relationship. The relationship between pure-tone average and emotional responses are significant for the pleasant sounds (p < .05). Regression Coefficients and Standard Errors of the Regression Model of Ratings of Valence in Response to Pleasant Sounds. Note. B = unstandardized regression coefficient; SEB = Standard error of the coefficient; β = standardized coefficient; p = significance value. p < .05.
Regression Coefficients and Standard Errors of the Regression Model of Ratings of Valence in Response to Unpleasant Sounds.

Note. B = unstandardized regression coefficient; SEB = Standard error of the coefficient; β = standardized coefficient; p = significance value.
p < .05.
Discussion
Isolation is a threat to physical and mental well-being. Previous work suggests that people with hearing loss, especially older adults, are at increased risk of isolation (Chia et al., 2007; Hawthorne, 2008; Sung et al., 2016; Weinstein & Ventry, 1982). However, the relationship has not been clearly established and is not consistent across studies or populations (Mick et al., 2014; Pronk et al., 2011, 2013; Stam et al., 2016; Weinstein et al., 2016). The purpose of this project was to evaluate the relationship between emotional responses measured in the laboratory, isolation, and hearing acuity. Based on previous work, it was expected that a combination of age, degree of hearing loss, and ratings of valence in response to sounds (both pleasant and unpleasant) would explain significant variability in disconnectedness and loneliness scores.
However, the results of this study suggest that valence ratings of pleasant sounds were the only factor that was significantly related to both disconnectedness and loneliness. Depressive symptoms also explained significant variability in loneliness, consistent with previous findings (e.g., Nolen-Hoeksema & Ahrens, 2002). Age, gender, perceived hearing handicap, PTA, and responses to unpleasant sounds did not significantly explain variability in disconnectedness or loneliness scores. This finding highlights the importance of emotional responses to sounds for disconnectedness and loneliness and also suggests that emotional responses should be considered in future models of isolation and hearing loss. Although the relationships between emotional responses and disconnectedness and loneliness are significant, this study does not answer the question of causality. At least three plausible competing explanations could explain the relationship between ratings of valence and isolation. These are the (1) isolation explanation, (2) common cause explanation, and (3) hearing loss explanation.
Isolation explanation
One possible explanation is that isolation colors emotional responses to sounds measured in the laboratory. Decades of previous literature has documented the significant negative consequences of isolation on coping, cognition, and health (Cacioppo & Hawkley, 2009). Emotional responses to sounds may be one of these secondary consequences of isolation. People who are disconnected might provide responses that are less positive than their nonisolated peers because they have fewer social experiences. If they have limited social encounters or spend most of their time isolated at home, short audio clips of music, laughter, or birds chirping might not conjure pleasant memories of similar experiences in the real world. Furthermore, people who are lonely are less likely to expect positive social interactions (e.g., Gable, 2006). Previous investigations reveal that lonely participants respond less positively to pleasant social images than their nonlonely peers (Cacioppo et al., 2009), although the effect might not generalize to nonsocial, pleasant pictures (Cacioppo et al., 2009; Silva et al., 2017).
Common cause explanation
An alternative hypothesis is that the relationships between emotional responses and disconnectedness or loneliness are driven by a third factor that influences both emotional responses and isolation, but was not measured in this study. For both social disconnectedness and loneliness, the independent variables only explained a small percentage of the variability, 7% and 19%, respectively. An example third factor could be a personality aspect, such as extraversion. Extraversion could simultaneously predispose people to respond positively to pleasant sounds (e.g., Costa & McCrae, 1980; Larsen & Ketelaar, 1989) and to engage in social activities that strengthen their social networks.
Hearing loss explanation
If hearing loss disrupts the way listeners feel about sound in their lives, it might change the likelihood people approach or engage in situations where sounds are typically perceived as pleasant (e.g., cocktail party with music and laughter). This might be especially true if communication in the situations is difficult, perhaps as a result of hearing loss. This hypothesis is partially supported by the finding that well fit hearing aids reduce subjective isolation (Weinstein et al., 2016), suggesting that improving communication in social situations encourages patients to interact socially. However, the role of hearing aids on emotional responses to sound has not yet been reported in the literature and warrants further investigation.
Factors Associated With Emotional Responses
Based on the significant role of ratings of valence in response to pleasant sounds in the statistical models of perceived social function, the variables associated with ratings of valence were evaluated. The data revealed only one factor, degree of hearing loss, was significantly related to emotional responses to pleasant sounds (see Table 7). This finding is consistent with previous work, which identified the negative effect of hearing loss on ratings of valence in response to nonspeech sounds (Picou, 2016) and documented cortical changes associated with hearing loss when listening to non-neutral stimuli (Husain et al., 2014). This study extends the previous findings to demonstrate a relationship between degree of hearing loss and ratings of valence in response to pleasant, nonspeech sounds.
Unlike pleasant sounds, emotional responses to unpleasant sounds were not related to hearing loss and instead were related to gender (see Table 8). Females rated unpleasant sounds as more unpleasant than males. Previous work suggests that gender can play a role in emotional responses to stimuli (Kamenetsky, Hill, & Trehub, 1997; Lang, Greenwald, Bradley, & Hamm, 1993; Vrana & Rollock, 2002), although previous investigations with the IADS (Bradley & Lang, 2000) and some music samples (Lundqvist, Carlsson, Hilmersson, & Juslin, 2009) have not confirmed gender effects. The present results extend previous findings by demonstrating that gender has an asymmetric effect on emotional responses to nonspeech sounds; women rated unpleasant sounds as more unpleasant than men, whereas gender differences were not apparent in response to pleasant sounds.
Importantly, two factors identified as potentially affecting emotional responses were not associated with ratings of valence. First, two methodological variables were introduced as a result of study design. Specifically, participants were tested as part of two larger study protocols, which employed different stimuli levels and transducers. To ensure stimulus level and transducer did not contribute to the variability associated with responses to pleasant stimuli, they were included in the regression models of ratings of valence. However, as indicated in Tables 7 and 8, neither level nor transducer explained significant variability in emotional responses to sounds.
Finally, age did not explain variability in ratings of valence in response to pleasant or unpleasant stimuli (Tables 7 and 8, respectively). Although there is a positivity bias associated with age reported for some methodologies (Carstensen, Pasupathi, Mayr, & Nesselroade, 2000; Mather & Carstensen, 2005; Mather & Knight, 2005), the results of this study did not support an age effect in emotional responses. This finding is consistent with previous findings reported by (Picou, 2016), who reported no group differences between younger and older listeners with normal hearing. These data are also consistent with the broader literature regarding emotional responses, which suggests that effects of age tend to be small and difficult to measure, particularly with a small set of stimuli (e.g., Mather & Carstensen, 2005; Mikels, Larkin, Reuter-Lorenz, & Carstensen, 2005; Wieser, Mühlberger, Kenntner-Mabiala, & Pauli, 2006).
Future Directions
The study has some limitations that should be acknowledged. Each limitation represents an area where future research is warranted to fully understand the complex interplay between hearing loss, emotional responses to sound, and isolation.
Participants
One primary limitation of the study was related to the voluntary, laboratory-based nature of the procedures. Because a visit to the laboratory was necessary, only people who were willing to make a trip to the laboratory participated. Consequently, the results do not reflect a population of participants who are most at risk for isolation. Similarly, the exclusion of people at risk for depression limited the number of participants who were isolated, because people depressed people tend to be isolated (Hawthorne, 2008; Perissinotto et al., 2012). Therefore, the results of the study are only generalizable to people who are not depressed and who are socially engaged enough to voluntarily choose study participation in a laboratory.
Hearing loss configuration
PTA was used as an indication of hearing loss. It is not clear how hearing loss configuration interacts with the spectral content of the stimuli to affect ratings of valence. One might expect the effects of hearing loss to be related to high frequency audibility because most participants exhibited sloping hearing loss (see Figure 1). However, existing models have not successfully identified acoustic cues that encode valence (Banse & Scherer, 1996; Goudbeek & Scherer, 2010; Juslin & Laukka, 2001; Laukka, Juslin, & Bresin, 2005; Picou, 2016). It is possible that degree of low- or high-frequency hearing loss could independently contribute to emotional responses to sounds.
Sample size
This study is limited by the relatively small sample size. Many previous investigations into the relationship between hearing loss and included participants in large-scale, population based samples, such as the Blue Mountain Hearing Study (Chia et al., 2007) and the Health and Retirement Study (Perissinotto et al., 2012), with 2,965 and 1,604 participants, respectively. However, these sample sizes would be difficult to achieve within the context of emotional responses measured in the laboratory, since participants must visit the laboratory to participate. Consequently, the sample size in this study is considerably smaller than other isolation studies.
Conclusions
Stimulus Tokens From the International Affective Digitized Sounds (Bradley & Lang, 2007) and Their Descriptions for Pleasant, and Unpleasant Stimuli.

Stimuli categorized as “social” for exploratory analyses.
Stimuli categorized as “nonsocial” for exploratory analyses.
Stimuli not included in the exploratory analyses.
Footnotes
Acknowledgments
The authors would like to thank Sarah Alfieri, Anna Allen, Sunaina Sherchan, Claire Umeda, and Maddox Myers for their assistance with participant recruitment and data collection. The authors would also like to thank Drs. Jeff Crukley, Travis Moore, and Todd Ricketts for their feedback on early versions of this manuscript. Portions of this project were presented at the Scientific and Technical Conference of the American Auditory Society (March 2017, Scottsdale AZ).
Declaration of Competing Interests
The authors declared no potential conflicts of interest with respect to the research, authorship, and/or publication of this article.
Funding
The authors disclosed receipt of the following financial support for the research, authorship, and/or publication of this article: This work was supported in part by the American Speech-Language Hearing Association, Sonova AG, and the Dan and Margaret Maddox Charitable Trust.