
Abstract
The perception of simple auditory mixtures is known to evolve over time. For instance, a common example of this is the “buildup” of stream segregation that is observed for sequences of tones alternating in pitch. Yet very little is known about how the perception of more complicated auditory scenes, such as multitalker mixtures, changes over time. Previous data are consistent with the idea that the ability to segregate a target talker from competing sounds improves rapidly when stable cues are available, which leads to improvements in speech intelligibility. This study examined the time course of this buildup in listeners with normal and impaired hearing. Five simultaneous sequences of digits, varying in length from three to six digits, were presented from five locations in the horizontal plane. A synchronized visual cue at one location indicated which sequence was the target on each trial. We observed a buildup in digit identification performance, driven primarily by reductions in confusions between the target and the maskers, that occurred over the course of three to four digits. Performance tended to be poorer in listeners with hearing loss; however, there was only weak evidence that the buildup was diminished or slowed in this group.
Introduction
Auditory scene analysis describes the process by which listeners decode a complex acoustic mixture to determine what sound sources are present. This process involves both the grouping of sound elements to form auditory objects (integration) and the sorting of elements into distinct objects (segregation). Integration and segregation take place both simultaneously and sequentially, based on spectrotemporal cues such as frequency, onset time, and spatial location. The sequential organization of auditory scenes appears to evolve over time. Bregman (1978, 1990) put forward the influential idea that perception tends to progress from integrated to segregated as evidence is accumulated for the presence of more than one object, while other researchers have viewed the progression over time in terms of adaptation (e.g., Anstis & Saida, 1985). In either account, the rate of this process depends on the similarity of the competing objects. For interleaved pairs of tone sequences, which have been most well studied, this “buildup” of the perception of two sounds emerges over the course of seconds to tens of seconds, depending on the frequency separation between the tones. Beyond this initial phase, the percept can alternate between integration and segregation in a bistable manner. The buildup effect is somewhat fragile; it can be disrupted by brief gaps in the sequences (e.g., Bregman, 1978), by sudden changes in the acoustical parameters of the stimuli (e.g., Rogers & Bregman, 1998) and by switches of attention away from the tone stimuli (Cusack, Deeks, Aikman, & Carlyon, 2004). Moreover, recent data have challenged the idea that the initial state is always integrated, particularly for very dissimilar pairs of stimuli (Deike, Heil, Böckmann-Barthel, & Brechmann, 2012).
Surprisingly little is known about how the perception of more complex stimuli (such as speech) evolves over time. There have been a few attempts to adapt the traditional streaming paradigm to speech stimuli (e.g., David, Lavandier, Grimault, & Oxenham, 2017; Gaudrain, Grimault, Healy, & Béra, 2007) by taking simple speech sounds and presenting them in regular interleaved sequences. These studies suggest that the traditional principles of perceptual organization generalize to speech sounds, although we know of no study that has demonstrated a buildup of streaming akin to that seen with tonal sequences.
Arguably, the ability to organize the acoustic world is especially critical in complex listening situations such as those that listeners encounter everyday, where multiple objects are present simultaneously and compete for attention. A typical example of this is in social settings where a listener is confronted with multiple talkers and must segregate the different voices and distribute attention appropriately. Although the time course of perception in these situations has not been studied extensively, there are some examples in the literature suggesting that speech intelligibility in multitalker mixtures improves when some defining feature of the target talker remains fixed. For example, several studies have reported a buildup in intelligibility from digit to digit when a listener attends to one stream of spoken digits embedded in multiple other streams of confusable digits at different locations (Best, Ozmeral, Kopčo, & Shinn-Cunningham, 2008; Best, Shinn-Cunningham, Ozmeral, & Kopčo, 2010; Ruggles, Bharadwaj, & Shinn-Cunningham, 2011). There are also examples showing modest improvements in intelligibility across keywords for open-set sentences presented against competing speech babble (Calandruccio, Buss, & Bowdrie, 2017; Ezzatian, Li, Pichora-Fuller, & Schneider, 2012; Wang, Kong, Zhang, Wu, & Li, 2018) which are not apparent when the speech is presented in unstructured noise. Moreover, consistency in target features can continue to improve performance from trial to trial, over timescales on the order of tens of minutes (Brungart & Simpson, 2007). Broadly, these results are consistent with the idea that the extraction of relevant speech from a mixture improves over time when stable segregation cues are available.
There is a scarcity of data in the literature addressing the time-course of speech perception in listeners with hearing loss (as discussed by Shinn-Cunningham & Best, 2008). However, in anecdotal reports and quantitative survey data collected from hearing-impaired (HI) listeners, it is common to encounter issues such as “keeping up” or “following conversations without missing the start of a new talker” (e.g., Gatehouse & Noble, 2004) that certainly have a temporal flavor. The results of one previous study (Best, Marrone, Mason, Kidd, & Shinn-Cunningham, 2008) provide a hint that the buildup of speech intelligibility based on location is disrupted by hearing loss. In that study, listeners were presented with a naturally spoken sequence of five digits presented against four speech maskers at different locations. Acoustic analysis showed a gradual drop in level across time in the target sequences, reflective of the dynamics of naturally spoken speech, which was not present in the masker sequences. Listeners with normal hearing (NH) were somehow able to counteract this decrease in level, presumably by improving their segregation over time, resulting in performance that was roughly constant across the five digits. The performance of HI listeners, on the other hand, decreased across time, suggesting that they were unable to compensate for the decrease in level over the course of the digit stream.
In their open-set sentence paradigm with speech-babble maskers, Ezzatian, Li, Pichora-Fuller, and Schneider (2015) found evidence for delayed segregation by voice in older listeners compared with younger listeners. They concluded that “age-related reductions in auditory processing that render the target and competing speech less distinctive likely slow stream segregation.” Yet it is unclear from this study what the role of hearing loss was in the observed effects. Moreover, if segregation is delayed, it suggests that performance may improve in these listeners if they are given a longer exposure time.
In this study, we adapted the paradigm of Best, Ozmeral, et al. (2008) to examine the buildup of speech intelligibility in healthy young listeners with NH and with HI. By focusing on these two populations, we were able to reveal any effects of hearing loss in the absence of any other factors (such as advanced age) that might affect performance. Five sequences of digits were presented from five locations distributed in the horizontal plane. The digits in each sequence were synchronized at their onsets, while a visual cue indicated which location contained the to-be-identified target sequence. Although the original paradigm used four-digit sequences, we extended it to include three-, four-, five-, and six-digit sequences. This enabled us to examine the time course of the buildup and to ensure that the effect generalizes to stimuli of various lengths.
Methods
Participants
Sixteen young adults participated in the study: eight with NH (ages 18–39 years, mean age 23) and eight with bilateral sensorineural hearing loss (ages 20–42 years, mean age 27). The HI listeners had losses that varied in severity, with pure-tone averages (mean threshold across both ears at 0.5, 1, and 2 kHz) ranging from 19 to 68 dB HL (mean 44 dB HL). The losses were relatively symmetric (mean difference in pure-tone audiometry (PTA) between the ears of less than 10 dB). Pure-tone averages ranged from 0 to 15 dB HL in the NH group (mean 5 dB HL). Audiograms for both groups are shown in Figure 1. The participants in both groups had various levels of previous experience doing psychoacoustic experiments in the laboratory, with some recruited newly for this experiment and some having extensive experience (including the first author who participated as a NH listener). External participants were paid for their participation and gave informed consent. All procedures were approved by the Boston University Institutional Review Board.
Individual audiograms (averaged over left and right ears) for NH and HI listeners (solid and dashed lines, respectively). Black and white symbols with error bars show group means and across-subject standard deviations. NH = normal hearing; HI = hearing-impaired.
Stimuli
Stimuli were individually recorded digits from the set 1 to 9, recorded by each of 12 male talkers. Digits in the set had an average duration of 593 ms. On each trial, a target sequence was generated by concatenating three, four, five, or six randomly selected digits spoken by a single talker. Longer sequences were not included, as pilot testing indicated that performance would plateau by around six digits. Four masker sequences were created in a similar way but with the voice chosen randomly from digit to digit within a sequence from the 11 remaining voices in the set. The five digits in each temporal position were time aligned at their onsets and then zero padded such that the duration of each set of digits was determined by the longest of the target and masker digits for that position. In any particular temporal position, all of the five digits and voices were forced to be different.
Each digit in each sequence was presented at a level of 65 dB SPL (such that all talkers were equal in level). In addition, for HI listeners, individualized linear amplification was provided according to the National Acoustic Laboratories' Revised, Profound (NAL-RP) prescription (Byrne, Parkinson, & Newall, 1991; Dillon, 2012), which is a modified half-gain rule that can be used for mild to profound losses. A single set of NAL-RP gains were calculated based on the average audiogram across the two ears and used to create a digital filter that was applied identically to the stimuli going to the two ears. After amplification, two of the HI listeners requested a lower level, and thus the preamplification level was dropped to 60 and 55 dB SPL for them.
Target and masker sequences were spatialized by processing with generic head-related transfer functions measured on a KEMAR manikin in an anechoic room (Brungart & Rabinowitz, 1999). Five locations in the horizontal plane, all at a distance of 1 m, were simulated: −30 °, −15 °, 0 °, + 15 °, and +30 ° azimuth. On each trial, the target was presented from one location and the maskers occupied the remaining four locations. The five locations were depicted on a visual display in front of the listener. On each trial, synchronous with the onset of the auditory stimulus, the target location was clearly illuminated (by a color change from black to red) to indicate to which spatial stream the listener should direct their attention. The color change persisted until the offset of the auditory stimulus. The target location was chosen randomly on each trial from three possible locations (−30 °, 0 °, and +30 °). Pilot testing indicated that it was particularly difficult to direct attention to −15 ° and +15 ° and so to ensure that the listener's task was always clear, these locations were not used for targets.
Procedures
Stimuli were controlled in MATLAB (MathWorks Inc., Natick, MA) and presented via a 24-bit soundcard (RME HDSP 9632, Haimhausen, Germany) through a pair of headphones (Sennheiser HD280 Pro, Wedemark, Germany). The listener was seated in a double-walled sound-treated booth in front of a computer monitor and provided responses by typing on the number pad of a standard keyboard. To minimize memory effects for the longer sequences, listeners were encouraged to enter their responses after each digit rather than waiting until the end of the stimulus.
Each listener completed one experimental session of approximately 2 h. The session began with two brief training blocks, followed by four blocks of testing. Each training block consisted of 60 trials (15 trials each at a sequence length of 3, 4, 5, and 6, blocked by sequence length and presented in that order). In the first training block, target stimuli were presented in the absence of any maskers. This enabled listeners to get familiar with the visual display and to practice typing in their responses. In the second training block, the targets were presented in the presence of maskers but with the target level increased by 5 dB to help it stand out. Feedback was given in both training blocks by displaying the number of digits identified correctly after each trial. Testing blocks consisted of 240 trials (60 trials each at a sequence length of 3, 4, 5, and 6, blocked by sequence length but presented in a random order). No feedback was provided during testing. Percent correct scores were calculated for each digit position in each sequence and were converted to rationalized arcsine units (Studebaker, 1985) for the purposes of statistical analysis.
Results
Performance and Buildup
The top row of Figure 2 shows performance (in percent correct) as a function of digit position. The four panels show data for the four different sequence lengths. The black and white symbols show mean performance for the NH and HI groups, respectively, and the error bars show across-subject standard deviations. To examine the buildup across time, the bottom row of Figure 2 shows the same data normalized on an individual basis by subtracting performance on the first digit. This figure demonstrates the tendency for scores to be lower for listeners with HI than those with NH, as well as a tendency for scores to improve across time.
Top row: Group mean performance as a function of digit position for NH and HI groups (black and white symbols, respectively). Bottom row: Group mean performance for NH and HI groups (black and white symbols, respectively) as a function of digit position normalized by performance on the first digit. Error bars show across-subject standard deviations. Each panel shows a different sequence length. NH = normal hearing; HI = hearing-impaired.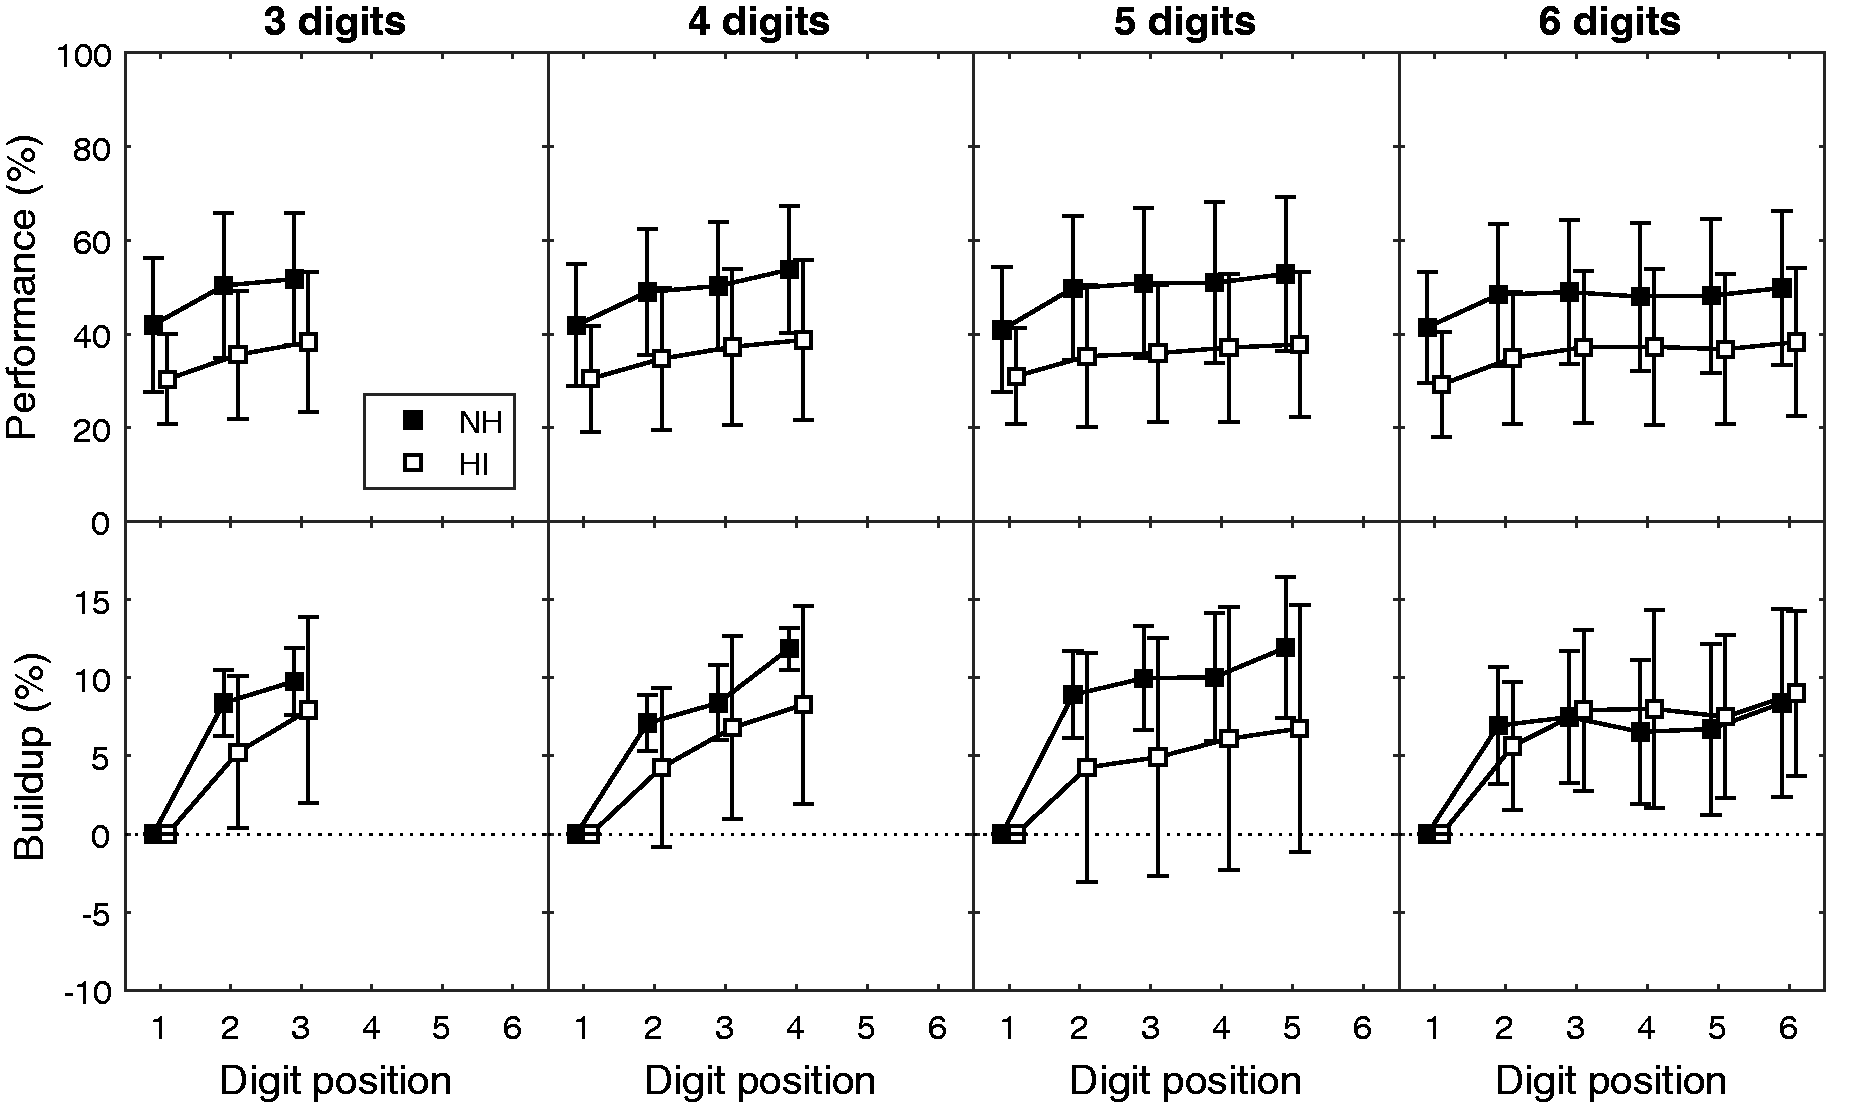
Results of a Three-Way Mixed ANOVA Conducted on Performance Scores With Factors of Sequence Length (3, 4, 5, and 6), Digit Position (1, 2, and 3), and Group (NH and HI).
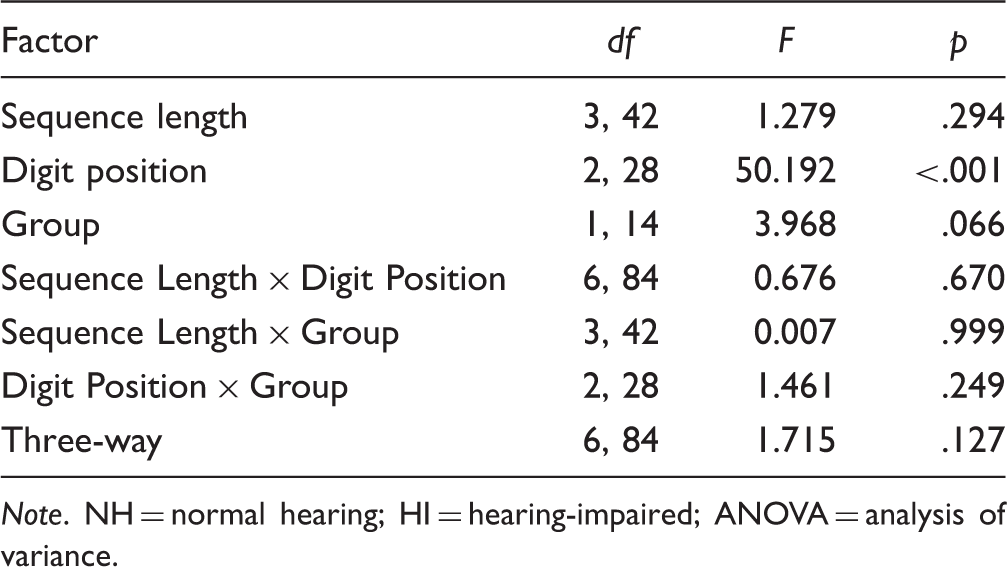
Note. NH = normal hearing; HI = hearing-impaired; ANOVA = analysis of variance.
The fact that the overall group difference in performance did not reach significance in any of our analyses is likely related to the large variability in performance across subjects (as well as the relatively small number of subjects). Some of this variability can be attributed to variability in hearing status, particularly within the HI group. Thus, to examine the effect of hearing loss in more detail, overall performance for each individual was calculated as the mean across Digits 1 to 3 for all sequences. This value was negatively correlated with PTA in our sample of 16 subjects, r(14) = −0.61, p = .01. Similarly, a measure of buildup was calculated for each individual by subtracting average performance on Digit 1 from average performance on Digit 3. This value was also negatively correlated with PTA, r(14) = −0.58, p = .02. This latter correlation, however, may arise as a result of the former correlation (i.e., because listeners with poorer hearing tended to have poorer performance). The correlation between buildup and mean performance on Digits 1 to 3 was indeed highly significant, r(14) = 0.79, p<.001.
Error Patterns
In our previous study (Best, Ozmeral, et al., 2008; see also Ruggles et al., 2011), we found that the improvement in performance across time for four-digit sequences was primarily due to decreases in “masker errors,” or errors in which the listener's response corresponded to one of the masker digits presented in the same temporal position. “Random errors,” in which the response digit matched none of the presented digits, were rarer and did not appear to vary systematically across time. This result was taken as evidence that the buildup reflects a refinement of selectivity, rather than just a general improvement in intelligibility of the target digits. A similar error analysis was conducted for the different sequence lengths tested in this study.
Figure 3 shows error rates (in percentage of total trials) as a function of digit position. Masker errors and random errors are shown in the top and bottom rows, respectively, and the four panels within a row show data for the four different sequence lengths. Means (and across-subject standard deviations) are shown for the NH and HI groups. Note that within each group, the two error rates, plus the correct performance rate shown in Figure 2, sum to 100%.
Top row: Masker error rates (in percentage of total trials) as a function of digit position for NH and HI groups (black and white symbols, respectively). Bottom row: Random error rates (in percentage of total trials) as a function of digit position for NH and HI groups (black and white symbols, respectively). Error bars show across-subject standard deviations. Each panel shows a different sequence length. NH = normal hearing; HI = hearing-impaired.
Results of a Three-Way Mixed ANOVA Conducted on Masker Error Rates With Factors of Sequence Length (3, 4, 5, and 6), Digit Position (1, 2, and 3), and Group (NH and HI).

Note. NH = normal hearing; HI = hearing-impaired; ANOVA = analysis of variance.
Once again, the fact that the group difference did not reach significance is likely related to the large variability in error rates across subjects, particularly in the HI group. When examined on an individual basis across our sample of 16 subjects, masker error rates (collapsed across sequence lengths and digit positions 1–3) were correlated with PTA, r(14) = 0.64, p = .008. The drop in masker errors between Digits 1 and 3 was also correlated (negatively) with PTA, although this relationship did not reach significance, r(14) = −0.45, p = .08. The drop in masker errors was not significantly correlated with the mean masker error rate for Digits 1 to 3, r(14) = −0.37, p = .16.
Results of a Three-Way Mixed ANOVA Conducted on Random Error Rates With Factors of Sequence Length (3, 4, 5, and 6), Digit Position (1, 2, and 3), and Group (NH and HI).

Note. NH = normal hearing; HI = hearing-impaired; ANOVA = analysis of variance.
The patterns of random errors are likely related to listening strategies and might be expected to vary with the details of the task and response method. For example, we speculate that performance for the middle digits might be negatively affected by the requirement to keep listening while responding, which would not be the case if listeners waited until the end to respond. On the other hand, this pattern might represent primacy and recency effects, common in recall tasks, which would presumably be exaggerated if listeners were required to hold all of the digits in memory. In this experiment, while listeners were instructed to respond in an ongoing way, it is possible that some listeners used a strategy that involved trying to remember some or all of the digits during the longer sequences. Future work comparing different response methods will be needed to understand these patterns fully.
Masker errors were further analyzed to determine whether they followed any particular spatial distribution. For each target location, all responses (pooled across listeners, sequence lengths, and digit positions) that did not correspond to random errors were sorted according to the location of the talker that uttered the responded digit. This analysis (Figure 4, top row) showed that confusions involving the maskers nearest to the target were more common than confusions with masker talkers that were further in azimuth from the target. When responses were examined separately for the first three digit positions in any sequence (Figure 4, bottom row), it was apparent that while responses to the target talker increased over time, responses to masker talkers decreased over time. This provides further support for the idea that improved performance over time on this task reflects improved selectivity for the target location.
Top row: Distribution of responses (for all digits in all sequences, pooled across NH and HI listeners) according to the location of the responded digit. Bottom row: Distribution of responses plotted as per the top row, but shown separately for the first three digit positions in any sequence. The three panels in each row show data for the three target locations (−30 °: left, 0 °: middle, and 30 °: right).
Performance as a Function of Target Location
The top row of Figure 5 shows mean performance (collapsed across NH and HI listeners) broken down by whether the target was located in the center (0 °) or to one of the sides (−30 ° or + 30 °). Clearly, overall performance was poorer for the central location. This likely reflects the fact that this location is acoustically less favorable than the lateral locations (which have one ear, the nearer one, in which the signal-to-noise ratio is improved). Moreover, it may be harder to focus attention when there are maskers on either side (vs. on only one side for the lateral locations) as has been described in other studies (e.g., Dai, Best, & Shinn-Cunningham, 2018).
Top row: Mean performance (collapsed across NH and HI groups) as a function of digit position for the different target locations (center: black symbols; sides: white symbols). Bottom row: Mean performance (collapsed across NH and HI groups) as a function of digit position for trials in which the target remained at the same position (stay: black symbols) or changed location (switch: white symbols). Error bars show across-subject standard deviations. Each panel shows a different sequence length.
Results of a Three-Way Repeated Measures ANOVA Conducted on Performance Scores With Factors of Sequence Length (3, 4, 5, and 6), Digit Position (1, 2, and 3), and Target Location (Center and Sides).

Note. NH = normal hearing; HI = hearing-impaired; ANOVA = analysis of variance.
Performance as a Function of Location Consistency
Because the target location was chosen randomly on every trial, the target remained in the same location as on the previous trial on approximately one third of trials. To investigate whether this had an effect on the buildup, the data were broken down on this basis (results shown in the bottom panel of Figure 5, collapsed across NH and HI listeners). Performance was better and showed less buildup on trials in which the target stayed at the same location as the previous trial (stay) compared to trials in which the target moved to a new location (switch).
Results of a Three-Way Repeated Measures ANOVA Conducted on Performance Scores With Factors of Sequence Length (3, 4, 5, and 6), Digit Position (1, 2, and 3), and Transition Condition (Switch and Stay).

Note. NH = normal hearing; HI = hearing-impaired; ANOVA = analysis of variance.
Discussion
In this study, we employed a digit sequence identification task that enabled us to observe how performance in challenging speech mixtures varies over time. Consistent with previous studies, we observed a buildup in performance over time. Here, we also showed that the buildup took place within the first few digits regardless of overall sequence length, and that it unfolded similarly for listeners with normal and impaired hearing.
In the introduction, we drew an analogy between the buildup in stream segregation observed for tone sequences and the buildup observed for the competing-talker paradigm used here. However, there are clear differences between our stimuli and those traditionally used to study buildup that warrant some consideration. First, the repeating units in our stimuli are longer than those typically used in studies of stream segregation, and the items in each stream are not identical, both of which could work against the perception of coherent streams. However, common spatial location and continuity of voice in the case of the target seem to support the perception of coherent streams of speech. Second, unlike for the case of alternating tones, there are a myriad of cues that should promote the segregation of competing streams in our paradigm (differences in spatial location, differences in voice, differences in temporal envelope). Thus, it is very likely that the competing streams in this paradigm are well segregated from the start, and that the observed buildup is related primarily to a refinement of the listener's ability to select the correct stream and maintain their attention to it. In line with this idea, it has been shown that the buildup is stronger for rhythmically spoken speech which enables attention to be focused appropriately in time (Wang et al., 2018).
As we have shown previously (Best, Ozmeral, et al., 2008), the buildup in performance in this task was primarily driven by reductions in confusions between the target and the maskers. Note that masker errors represent the incorrect selection of properly formed streams, supporting the idea that the buildup reflects an improvement in selective attention rather than segregation. The rate of these errors dropped systematically for about three to four digits (on the order of two seconds) and then appeared to plateau. Of course, this time course may be dependent on many parameters, including the nature of the interference, the spacing of the competing sounds, and their similarity along other dimensions. Nevertheless, the rapidity with which listeners seem to adapt in this challenging situation might begin to explain how listeners cope with the dynamic changes in talker and location that are inherent to many conversations in everyday life. Performance was also influenced by random errors, in which listeners responded with a digit that was not presented. The time course of these errors varied with sequence length, showing an increase for digits toward the middle of the sequence. This may reflect increased memory demands for longer sequences, which typically influence interior items in an ordered list more than initial and final items, or it may reflect a change in the strategy adopted by listeners for the more challenging, longer sequences.
Theories of auditory object formation, segregation, and selection have been used to argue that hearing loss could lead to a slowing of attentional processing in complex mixtures (e.g., see Shinn-Cunningham & Best, 2008). Consistent with this, one study found that older listeners with hearing loss were slower to extract target speech from a background of competing speech (Ezzatian et al., 2015). In contrast, in this study, we found only weak evidence that the time course of attention was altered in our young listeners with hearing loss. The ANOVAs found no interactions suggesting that the buildup in performance (nor the reduction in masker errors) differed between groups. On an individual level, while there was a correlation between performance buildup and hearing status, this may have been driven more by the overall low scores of listeners with poorer hearing than by hearing loss per se. Moreover, the reduction in masker errors was not reliably related to hearing status. This apparent discrepancy between studies may indicate that age, more than hearing loss, affects speech perception via a slowing of selective attention. On the other hand, another recent study reported a neural correlate of spatial attentional selectivity measured using simple melodic stimuli and electroencephalography in young adult listeners (Dai et al., 2018) and found that this selectivity increased over the course of several seconds in NH but not in HI listeners. They also reported an association between their attentional measures and a basic measure of spatial sensitivity, suggesting that the deficiency in HI listeners might be related to the availability of low-level segregation cues. Further investigations are needed to build a more complete picture of the effects of hearing loss on segregation and attention in complex mixtures.
Footnotes
Acknowledgments
The authors would like to thank Lorraine Delhorne for help with subject recruitment and Todd Jennings for technical support.
Declaration of Conflicting Interests
The authors declared no potential conflicts of interest with respect to the research, authorship, and/or publication of this article.
Funding
The authors disclosed receipt of the following financial support for the research, authorship, and/or publication of this article: This work was supported by NIH-NIDCD award DC015760 to VB. NK was supported by EU H2020-MSCA-RISE-2015 grant no. 691229 and VEGA 1/1011/16.