
Abstract
Individuals with sensorineural hearing loss (SNHL) often experience more difficulty with listening in multisource environments than do normal-hearing (NH) listeners. While the peripheral effects of sensorineural hearing loss certainly contribute to this difficulty, differences in central processing of auditory information may also contribute. To explore this issue, it is important to account for peripheral differences between NH and these hearing-impaired (HI) listeners so that central effects in multisource listening can be examined. In the present study, NH and HI listeners performed a tonal pattern identification task at two distant center frequencies (CFs), 850 and 3500 Hz. In an attempt to control for differences in the peripheral representations of the stimuli, the patterns were presented at the same sensation level (15 dB SL), and the frequency deviation of the tones comprising the patterns was adjusted to obtain equal quiet pattern identification performance across all listeners at both CFs. Tonal sequences were then presented at both CFs simultaneously (informational masking conditions), and listeners were asked either to selectively attend to a source (CF) or to divide attention between CFs and identify the pattern at a CF designated after each trial. There were large differences between groups in the frequency deviations necessary to perform the pattern identification task. After compensating for these differences, there were small differences between NH and HI listeners in the informational masking conditions. HI listeners showed slightly greater performance asymmetry between the low and high CFs than did NH listeners, possibly due to central differences in frequency weighting between groups.
Introduction
Previous studies have demonstrated that listeners with sensorineural hearing loss (SNHL) experience greater difficulty understanding speech in multisource environments than normal-hearing (NH) listeners. This observation is based both on subjective ratings (Gatehouse & Noble, 2004) and on empirical studies in laboratory settings measuring masked speech reception thresholds in spatialized mixtures of competing talkers (e.g., Arbogast, Mason, & Kidd, 2005; Best, Marrone, Mason, & Kidd, 2012; Dawes, Munro, Kalluri, & Edwards, 2013; Gallun, Diedesch, Kampel, & Jakien, 2013; Glyde, Cameron, Dillon, Hickson, & Seeto, 2012; Marrone, Mason, & Kidd, 2008). Although the origin of most SNHL is known to be peripheral (cf. Moore, 2007, p. 28), it is not clear whether the performance deficits and difficulties experienced by listeners with SNHL arise solely and directly from peripheral degradations, or also from additional central processing differences that may arise with prolonged SNHL (e.g., Dietrich, Nieschalk, Stoll, Rajan, & Pantev, 2001; Doherty & Lutfi, 1999). Part of the reason for the difficulty in making this determination is that the two processes are linked. Errors in sound segregation and misdirected attention are usually thought to result from errors in higher level processes. However, degradation in the representation of sounds in the auditory periphery due to SNHL can also have effects on higher level processes (Shinn-Cunningham, 2008; Shinn-Cunningham & Best, 2008).
To distinguish between peripheral and central factors in listeners with SNHL and to draw comparisons to listeners with NH, it thus is desirable for experiments to account for changes in the peripheral representations of the sounds due to SNHL prior to the processing that occurs more centrally. However, controlling for all peripheral differences between listeners with NH and listeners with SNHL is quite challenging. In addition to elevated thresholds, listeners with SNHL often exhibit abnormal loudness perception including loudness recruitment (Buus & Florentine, 2001; Fowler, 1936; Scharf & Hellman, 1966) and impaired temporal resolution (e.g., Fitzgibbons & Wightman, 1982; Nelson & Freyman, 1987). They also demonstrate poorer frequency selectivity (e.g., Kidd, Mason, & Feth, 1984; Moore & Glasberg, 1986) and tend to show poorer frequency discrimination abilities (McDermott, Lech, Kornblum, & Irvine, 1998; Moore & Peters, 1992; Nelson & Freyman, 1986).
To solve the task of hearing out a “target” sound in multisource listening environments, the listener must first perceptually segregate the sources and then selectively attend to one particular source. In selective listening, the presence of the nontarget sound(s) may interfere with solving the task, causing “masking.” Current theory distinguishes between masking that is due primarily to peripheral processes such as the overlap in the representations of the sounds in the auditory nerve (e.g., “energetic masking,” EM) and to masking that is due to central processes affected by the similarity of the sounds or listener uncertainty (e.g., “informational masking,” IM; cf. review in Kidd, Mason, Richards, Gallun, & Durlach, 2008a, and theory relating similarity and uncertainty proposed by Lutfi, Gilbertson, Heo, Chang, & Stamas, 2013). Studies of IM have relevance to the issue of untangling central and peripheral factors because they assess the ability of the listener to selectively attend to a target when the peripheral interactions of the target and masking sources are intentionally minimized or controlled. Previous IM studies have found differences between NH listeners and listeners with SNHL in their susceptibility to masking in pure-tone detection tasks (Alexander & Lutfi, 2004; Kidd, Arbogast, Mason, & Walsh, 2001; Micheyl, Arthaud, Reinhart, & Collet, 2000). However, whether the results reflect increased susceptibility solely to IM in these hearing-impaired (HI) listeners, or to peripheral differences that could not be adequately controlled for in the task, is a matter of some debate. Specifically, some studies have concluded that HI listeners experienced more difficulty with selective attention and were more susceptible to IM (Kidd et al., 2001), while others have concluded that the differences between NH and HI listeners in tasks related to selective attention were due primarily to remaining peripheral differences in stimulus representations for the two groups (Alexander & Lutfi, 2004; Micheyl et al., 2000).
A handful of studies have suggested that there are differences between NH and HI listeners in their perceptual weighting of information in different frequency regions in sound mixtures. Although exactly what is meant by assigning weights to different frequencies based on observed performance varies according to the underlying assumptions and procedures used, it is generally intended that weights reflect central processes such as the allocation of attention (e.g., Doherty & Lutfi, 1999; Stelmachowicz, Lewis, Kelly, & Jesteadt, 1990). Stelmachowicz et al. (1990) compared NH listeners and listeners with relatively flat SNHL in a phoneme recognition task where the cutoff frequency of a lowpass noise masker was varied. NH listeners showed continued degradation in signal-to-noise ratio at threshold with increasing cutoff frequency, whereas the HI listeners showed a plateau in signal-to-noise ratio for cutoff frequencies above about 2000 Hz. The authors concluded that the HI listeners may have relied more on low-frequency prosodic information than NH listeners. Doherty and Lutfi (1999) calculated perceptual weights from a task involving tone detection in a masker with uncertain frequency components (an IM task) in NH listeners and listeners with primarily sloping, high-frequency SNHL. Their results were consistent with the idea that the HI listeners placed greater perceptual weight on high-frequency regions with greater hearing loss. The apparently discrepant findings between these studies are perhaps explained by the different hearing loss configurations used in those studies and also by the different experimental tasks—a speech recognition task was used by Stelmachowicz et al. (1990), and a tone-detection task was used by Doherty and Lutfi (1999). However, it should be noted that a later study by Alexander and Lutfi (2004) that calculated frequency weights like Doherty and Lutfi (1999) found that the differences between the NH and HI groups were primarily explained by differences in sensation levels (SLs) of the components between the groups, and not necessarily by differences in frequency weighting. Thus, there remains some uncertainty regarding the direction of frequency weighting differences between NH and HI listeners as well as whether these apparent frequency weighting differences truly are due to central factors.
While tone-detection studies (like the IM studies discussed earlier) offer relatively precise stimulus control (i.e., control over peripheral stimulus interactions), they typically do not probe the more complex, higher level judgments involved in multiple-talker listening situations (e.g., recognition and identification). Furthermore, the tone-detection IM studies discussed earlier were designed to measure selective attention but did not assess divided attention. In multisource environments, it is also important, at times, for the listener to simultaneously monitor more than one source by dividing attention. Selective and divided attention may not be entirely distinct, as some studies have shown that general aspects of the “unattended” stream are processed to some extent in selective attention conditions (e.g., Cherry, 1953), and others have suggested that listeners may be unable to process more than one stream simultaneously in divided attention conditions (cf., Treisman, 1969; but see Demany, Erviti, & Semal, 2015). Nevertheless, it is important to examine both tasks to obtain a more complete picture of multisource listening. There has been a substantial amount of work on selective attention and divided attention employing speech stimuli (e.g., Best, Gallun, Ihlefeld, & Shinn-Cunningham, 2006; Gallun, Mason, & Kidd, 2007; McCloy & Lee, 2015). However, the complexity of the speech stimulus and the multiple cues that can be used to selectively attend to a source (e.g., talker-specific characteristics, talker familiarity, semantic content, linguistic factors, etc.) make it difficult to distinguish peripheral and central influences on results. There are other studies that have examined selective and divided (or broad) attention across the frequency domain by varying frequency uncertainty of pure-tone stimuli in detection tasks (Green, 1961; Kidd, Richards, Mason, Gallun, & Huang, 2008b; Macmillan & Schwartz, 1975) and pattern identification tasks (Kidd, Richards, Streeter, Mason, & Huang, 2011). By using pure-tone stimuli, these studies achieve fairly precise stimulus control, although only Kidd et al. (2011) used a task more complex than tone detection, and none of these studies have compared NH and HI listeners. Overall, it would be desirable for a study to compare NH listeners and listeners with SNHL under selective and divided listening conditions using a task that requires more sophisticated identification judgments than pure-tone detection while retaining a higher degree of stimulus control than is possible with multitalker speech stimuli.
In the present study, we adopted a multisource stimulus paradigm that overcomes some of the limitations of previous studies discussed earlier. Using this paradigm, comparisons were made between listeners with NH and listeners with SNHL under conditions in which multiple sounds are presented concurrently, and the listener must attend selectively to one source or divide attention among two sources. Listeners performed a nonspeech tonal pattern identification task at two center frequencies (CFs; sources), 850 Hz and 3500 Hz, which were frequency regions where the HI listeners had lower and higher degrees of hearing loss, respectively. Examining the allocation of attention in different frequency regions—inside and outside of the region of greater hearing loss within the same listeners—may provide some insight into how HI listeners weight frequency information for complex auditory judgments. One benefit of using the nonspeech pattern identification task is that it is more demanding than simple detection of tones (e.g., Kidd, Mason, & Rohtla, 1995; Weber, 1989) and is well suited for varying the degree of IM that is present (e.g., Kidd, Mason, & Arbogast, 2002; Kidd, Mason, Rohtla, & Deliwala, 1998a; Kidd et al., 2011). A second benefit of this task is that it does not convey linguistic information inherent to speech, and thus avoids possible confounds due to the degree of linguistic processing required of the subject. A third important benefit of using the nonspeech pattern identification task is that it allows for a high degree of stimulus control to be used to equate performance across listeners at each frequency region tested. This is important for compensating for the reduction in frequency discriminability known to affect listeners with SNHL and for compensating for the large intersubject differences often found for both NH and SNHL listeners in complex discrimination tasks (potentially comprising both peripheral and central factors). In this study, the patterns were presented at the same SL at both CFs and across listeners to account for changes in audibility with SNHL. Furthermore, the variation in frequency of the elements comprising the patterns was adjusted for each listener and at each CF separately so that all listeners achieved the same performance level for pattern identification in quiet. This adjustment in frequency deviation of the elements was intended to account for changes in frequency discriminability with SNHL. Once these stimulus adjustments were made to ensure equal performance for each source/CF in quiet, performance in selective and divided attention tasks was measured with tonal sequences presented at both CFs concurrently. As the two CFs were distant in frequency, it was assumed that decrements in performance with two simultaneous CFs (masking conditions) would be due primarily to IM rather than to EM. The content of the nontarget stream was manipulated to vary target-masker similarity, and therefore amount of IM.
Methods
Listeners
Seven young adults with NH and seven young adults with SNHL participated in the study. Characteristics of these participants are shown in Table 1. The left-ear audiograms of these participants are shown in Figure 1. HI participants all had long-standing, stable, symmetrical SNHL. In the experiments described later, the left ear of each listener was tested. The institutional review board at Boston University approved these procedures (protocols 2633E, 2670E), and informed consent was obtained from all participants.
Left-ear audiograms in dB HL for HI listeners (filled symbols) and averaged for NH listeners (open circles). The right-pointing arrow indicates no response at the highest level tested. Characteristics of Participants in the Study. Note. The detection thresholds tabulated here were measured separately from the audiometric thresholds in Figure 1 (see text). NH = normal-hearing; HI = hearing-impaired.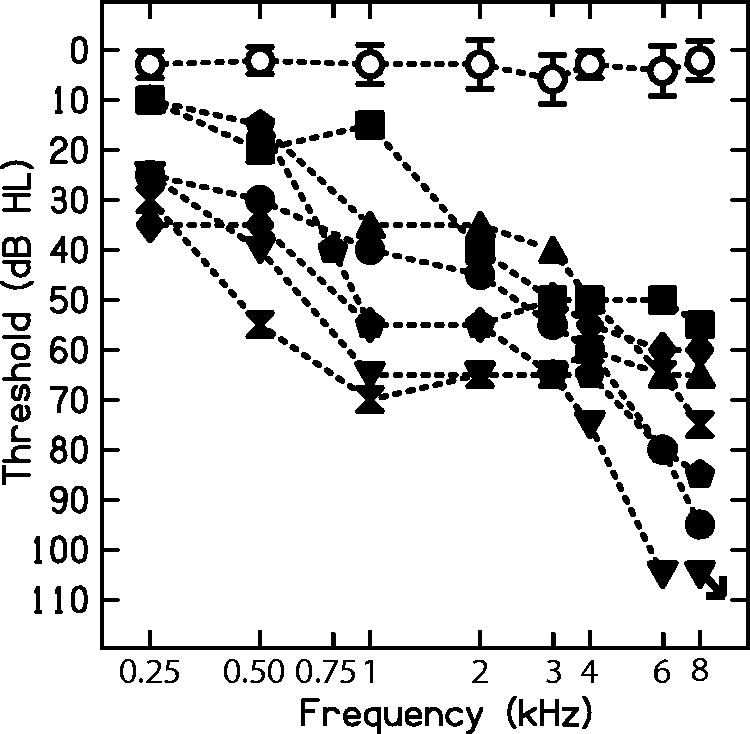

Stimuli
In measuring quiet threshold and frequency discrimination limens (DLFs), the stimulus was a 60-ms pure tone with 5-ms cos2 onset–offset ramps. The target (for quiet threshold) or referent (for DLFs) was 850 or 3500 Hz. In all pattern identification experiments, the tonal sequences were made up of eight contiguous pure tones, each 60-ms in duration with 5-ms cos2 ramps. These pure tones formed four “target” spectro-temporal patterns (depicted in Figure 2). The patterns and tones for DLFs were presented at 15 dB SL.
The four tonal patterns used. The tonal elements were always lower (FeL) and higher (FeH) than the center frequency (CF).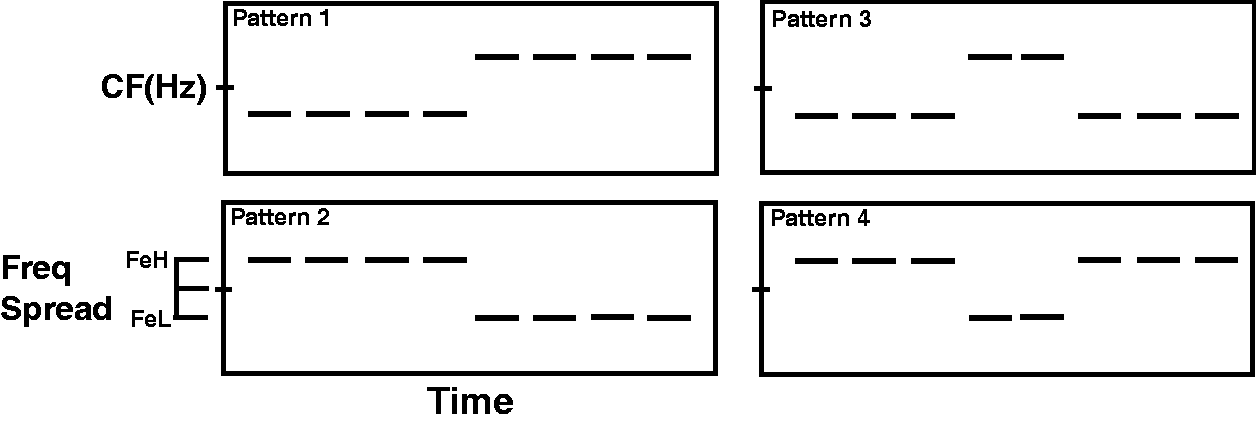
There were two CFs of the tonal sequences, 850 and 3500 Hz. As shown in Figure 2, none of the tonal elements comprising the patterns occurred at the CFs but rather symmetrically surrounded the CFs. That is, the frequencies of the tonal elements were either higher than CF (FeH) or lower than CF (FeL). The precise frequencies of FeH and FeL were determined by the frequency spread, set for each listener and CF separately (see Procedures section). In the masking conditions, tonal sequences were presented at both CFs simultaneously. One of the four patterns (Figure 2) was presented at the designated “target” CF, and a tonal sequence was presented at the other “masker” CF. In the “pattern masker” condition, the masker was one of the other patterns shown in Figure 2 (excluding the target pattern). In the “random masker” condition, the masker was a random tone sequence generated independently for each presentation, where the frequency of each tonal element at each temporal position, Ei (where E1 is the element at temporal position 1, and E2 is the element at temporal position 2, etc.), was randomly selected from the two possible values (FeH or FeL). Both random and pattern masker types were examined in an attempt to vary the amount of IM present. The pattern masker was assumed to have higher IM than the random tone sequence masker due to greater target similarity (Durlach et al., 2003). This assumption was based on findings from a previous nonspeech pattern identification study by Kidd et al. (2002), which showed that more “pattern-like” maskers tended to produce greater IM compared with random tone maskers that were less similar to the target.
Equipment
Listeners were seated in front of a computer in a double-walled sound-attenuating booth while wearing Sennheiser HD280 Pro headphones. The stimuli were generated at a sampling rate of 44.1 kHz using a MATLAB program, delivered to a RME HDSP 9632 24-bit soundcard (ASIO), and presented through the left headphone.
Procedures
Quiet threshold
Quiet thresholds were measured for both CFs (850 and 3500 Hz). An adaptive three-interval, three-alternative forced-choice procedure was used. Each interval was marked visually on a computer screen. On each trial, the target was presented in one randomly selected interval. The other two intervals contained silence. The listener selected the interval judged to contain the target and was provided with feedback as to whether the response was correct or incorrect. A two-down, one-up tracking procedure was used to estimate 70.7% correct (Levitt, 1971). The target step size was 5 dB for the first two reversals and was 3 dB for the subsequent reversals. The tracking program terminated after eight reversals at the smaller step size, and threshold for that run was the average of the last eight reversals. The program was run twice for each CF, and threshold was the average of the two separate runs. Thresholds for all listeners at both CFs are shown in Table 1.
For all pattern identification experiments and DLFs (described later), the level of each tonal element was equal to the threshold for the relevant CF plus 15 dB. In the interest of time, and given the relatively narrow range of frequency elements used throughout the experiments (see Results section), it was assumed that threshold at each CF (850 or 3500 Hz) would be representative of threshold within the narrow frequency region of the tonal elements around that CF. The resulting pattern and DLF presentation levels were not uncomfortably loud for any listeners.
Adaptive tracking of frequency spread, pattern identification with fixed frequency spread
The frequency spread yielding 79% correct performance in a pattern identification task was determined. This was done so that pattern identification performance in quiet could be equated for both CFs independently across NH and HI listeners. It has been demonstrated previously that nonspeech pattern identification performance decreases as the frequency spread around the CF decreases (Kidd, Mason, & Chiu, 1998b).
To familiarize the listeners with the patterns, each pattern at each CF was presented with a suitably wide frequency spread and highlighted on the screen prior to the experimental block. In the experimental run, an adaptive one-interval, four-alternative forced-choice procedure was used. Throughout the experiment, the graphical representations of each of the four patterns were displayed in a grid (much like Figure 2 without text). On each trial, a pattern (randomly selected from the four possibilities) was presented, and the subject selected the graphical representation of the pattern that was perceived. The correct pattern was highlighted after each trial. As shown in Figure 2, the patterns were made up of FeH and FeL, where FeH = (CF + [.5 × frequency spread]) and FeL = (CF − [.5 × frequency spread]). A three-down, one-up adaptive procedure was used (estimating 79% correct), which adaptively tracked the frequency spread. The frequency spread step size was 0.005 × CF (4.25 Hz for 850-Hz CF; 17.5 Hz for 3500-Hz CF) for the first two reversals and was 0.001 × CF (.85 Hz for 850-Hz CF; 3.5 Hz for 3500-Hz CF) for the subsequent eight reversals. The tracking program terminated after the eighth reversal at the smaller step size. The average of the last eight reversals defined frequency spread for that track. Four adaptive tracks were run for each CF, and frequency spread for each CF was averaged from the four tracks. To verify the accuracy of the tracking, this finalized frequency spread was fixed for each CF, and 60 trials of patterns were presented to determine percent correct.
Masking conditions
Using the individually determined frequency spreads, listeners performed a pattern identification task with tonal sequences at both CFs simultaneously (pattern identification in the presence of a masker) in two contexts: selective attention and divided attention. There were two selective attention blocks and two divided attention blocks in each session. The order of these blocks was randomized. Prior to an experimental block in the masking conditions, listeners were reminded of each of the patterns. Each pattern was presented at each CF in isolation (with the presented pattern highlighted on the screen) and again with a masker pattern presented simultaneously at the other frequency. In all experimental tasks, feedback was presented after each trial indicating whether the pattern selected was correct or incorrect. Within each block, a score was displayed after every 45 trials to break up the blocks and to allow subjects to take a break if needed.
In the selective attention task, listeners were instructed to attend to a particular frequency (or pitch) and to ignore any content at the other frequency. The target CF was blocked across a series of trials. The order of which frequency was attended to first (whether an 850-Hz target block occurred first or second) was randomized. On a given trial, the target pattern was randomly selected. The masker stream could contain a pattern masker, a random masker, or nothing (pattern identification in quiet). Each of these three masker content options occurred 30 times in randomized order throughout that block of trials. As a result, one target-CF block contained 90 trials, and one selective attention block contained 180 trials (90 trials × 2 target CFs). Because the selective attention block was run twice in the session, each condition (target CF × masker content) was repeated 60 times. Percent correct for each condition (out of 60 trials) was calculated.
The divided attention task was identical to the selective attention task except for the instructions and trial blocking. Listeners were instructed to attend to both CFs. Immediately following each presentation, listeners were instructed via text on the computer screen to report either the low-pitch or high-pitch pattern. Each of the three masker content options × each target CF (850 or 3500 Hz) occurred 30 times in randomized order throughout a divided attention block. Thus, each divided attention block contained 180 trials, as was the case in the selective attention task block (except target frequency was not blocked in the divided attention task). The divided attention block occurred twice in a session, and thus, each condition (target CF × masker content) was repeated 60 times. Percent correct out of 60 trials was calculated for each condition.
Frequency discrimination limens
DLFs for 850 Hz and 3500 Hz were measured for all listeners in a separate session. It was hypothesized that frequency spread for pattern identification would be related to (or limited by) the discriminability of the frequency elements. Each CF served as the referent frequency in separate tracks (CF was fixed within a block of trials). Four DLFs were obtained for each listener—one above and one below both CF referents in separate blocks. Because the patterns were made up of tones both above and below the CF, it was thought that the average of the DLFs above and below CF would be the most relevant metric to correlate with the frequency spread of the tones required for pattern identification. Each DLF was measured using a three-interval, three-alternative force choice procedure. On each trial, the test tone was presented in one randomly selected interval, and the referent tone (at CF) was presented in the other two intervals. The interstimulus interval was 500 ms. The test tone was higher in frequency than the referent in the above-CF block and lower in frequency than the referent in the below-CF block. The listener selected the interval that was perceived to have a higher frequency (or “pitch”) for the above-CF trials or the lower frequency for the below-CF trials. The frequency difference between the test and referent frequency was varied adaptively in a three-down, one-up procedure to estimate 79% correct. The step size was 0.005 × CF for the first two reversals and was 0.001 × CF for the final eight reversals. The tracking program terminated after the eighth reversal at the smaller step size, and the DLF for that track was the average of the final eight reversals. Each DLF was the average of two separate adaptive tracks.
Session schedule
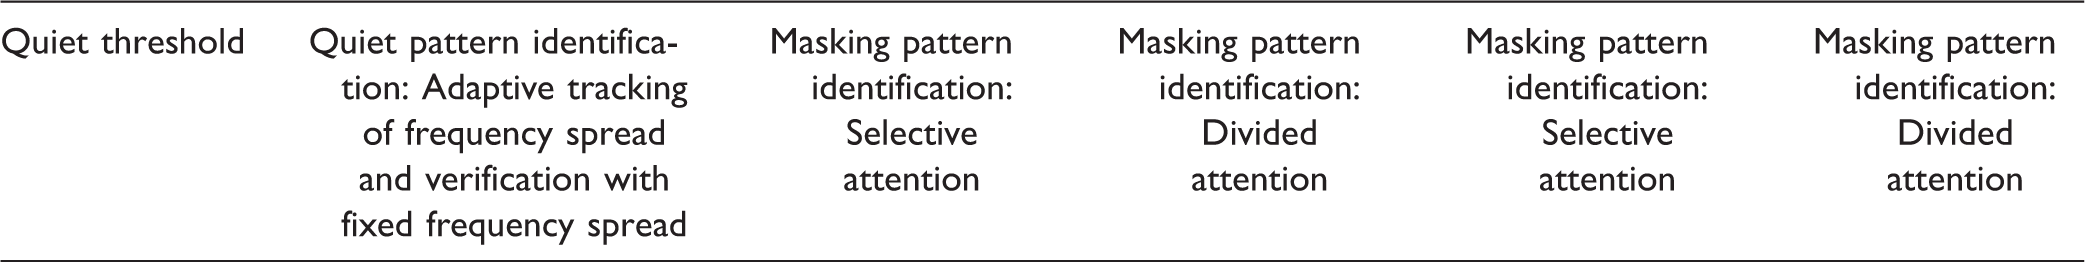
An Example Schedule for One Pattern Identification Session.
Results
Relationship Between Threshold, Frequency Spread, and Frequency Discrimination Limens
Figure 3(a) shows the relationship between quiet threshold (in dB SPL) and frequency spread around CF yielding 79% correct in the adaptive tracking pattern identification task across listeners. This relationship was statistically significant at both CFs (850 Hz: r = .66, p = .011; 3500 Hz: r = .66, p = .010) but appears to be driven primarily by the HI listeners.1
Panel A—The relationship between quiet threshold and frequency spread of the patterns as determined by adaptive tracking for NH (open symbols) and HI (filled symbols) listeners for both CFs. Panel B—The relationship between quiet threshold and DLFs (average of “below” and “above” DLFs) for NH (open symbols) and HI (filled symbols) listeners for both CFs. Dashed horizontal lines and solid vertical lines show the expected mean and 95% confidence interval range of NH DLFs (Micheyl et al., 2012) for these stimuli (850 Hz range on right-hand side, 3500 Hz range on left-hand side for clarity of presentation).
DLFs were measured in the present study (for d′ = 1.61), both for tones below and tones above the two CFs. The above and below DLFs for a given CF were averaged, and the relationship between quiet threshold and these averaged DLFs is shown in Figure 3(b). For reference, the expected DLFs for NH listeners for the two frequencies, 15 dB SL, 60 ms, and a d′of 1.61 (cf. Micheyl, Xiao, & Oxenham, 2012, mode ML params in Table 2) are shown as the dashed horizontal lines. The vertical solid lines show the expected 95% confidence interval range of DLFs for NH (Micheyl et al., 2012, params in last two columns in Table 2). There was one apparent NH outlier at 3500 Hz (open pentagon symbol), whose DLF was far outside of the expected 95% confidence interval range for unknown reasons. However, substantial training effects have been observed for DLFs in some listeners (e.g., nonmusicians; Micheyl, Delhommeau, Perrot, & Oxenham, 2006), and the listeners in the present study did not undergo a training regimen for DLFs. There was a significant relationship between quiet threshold and DLF for 850 Hz (r = .62, p = .018) but not for 3500 Hz (r = .40, p = .158). When the apparent NH outlier at 3500 Hz was excluded, the relationship between quiet threshold and DLF at 3500 Hz was significant (r = .63, p = .024). Just as for the pattern identification frequency spread, the relationship between quiet threshold and DLFs appears to be driven primarily by the HI listeners.2
Figure 4 shows the relationship between DLFs and frequency spread for pattern identification for both CFs. The DLFs shown in Figure 4 were corrected to a d′ of 1.79 (see Micheyl et al., 2012) because this was the d′ tracked in the 4-AFC pattern identification task. The dashed line shows, for reference, perfect correspondence between the two measures. The correlation between the two measures was significant for 850 Hz (r = .95, p < .001) and for 3500 Hz (r = .68, p = .008). The significant relationship between the DLFs and frequency spread for pattern identification supports the hypothesis that the frequency spread for pattern identification performance is related to the frequency discriminability of the tones making up the patterns. Somewhat puzzling, however, is that some listeners required wider frequency separation for DLFs than for pattern identification (symbols below the referent line in Figure 4). If these listeners could not discriminate two frequencies at a particular frequency spacing, then they should not have been able to identify a pattern based on this frequency separation. There are a few possible reasons for this seemingly impossible discrepancy. First, there can be considerable training effects in measuring DLFs (Micheyl et al., 2006; Turner & Nelson, 1982). The listeners in the present study did not undergo a training regimen for these DLFs, but there was effectively some training in the pattern identification task because only results from the second pattern identification session are reported. Second, the pattern identification task involved frequencies spanning the CF, but no frequency actually occurred at the CF. In contrast, in the DLF task, the referent tone was always at the CF. By averaging above and below DLFs, it was hoped this discrepancy would be minimized, but there was not a perfect frequency correspondence between the two tasks. Third, there were important differences in the two tasks and procedures. In the pattern identification (frequency spread) task, only one pattern was presented on each trial. However, for a trial in the DLF task, three individual tones separated by 500 ms were presented, and the subjects were required to hold the representations of the tones in memory to discriminate them. As a result, the memory requirements were different for the two tasks. However, despite the few discrepant points, there still was a near-perfect correspondence between these two measures. This result does not necessarily fit with results reported by Cousineau, Demany, and Pressnitzer (2009). They compared sensitivity (d′) of a fixed frequency difference in a binary tonal pattern discrimination task for randomly generated complex tonal sequences as a function of the tonal sequence length. In that study, d′ dropped significantly from N = 1 (akin to the DLF task in the present study) to N = 8 (the length of the patterns in the present study). This suggests that the frequency separation required for equal performance would need to be wider for a longer tonal sequence than for individual tones. This did not appear to be the case in the present study comparing DLFs to identification of well-learned patterns, although we were comparing discrimination and identification results, and it may have become the case had subjects received more DLF training.
The relationship between DLFs and frequency spread for the nonspeech patterns in NH listeners (open symbols) and HI listeners (filled symbols). As the frequency spread tracked a d’ of 1.79, DLFs have been corrected to a d’ of 1.79. The dashed line shows, for reference, perfect correspondence between the two measures.
Pattern Identification in Quiet
As described in the Methods section, pattern identification was measured in a block of quiet trials to verify that the frequency spread determined by adaptive tracking yielded 79% correct. Quiet trials were also presented throughout the masking conditions in the selective attention and divided attention blocks. Pattern identification performance in these quiet trials across these different context conditions is shown in Figure 5. For the blocked quiet trials, both groups on average achieved the targeted 79% correct performance. However, when the quiet trials were mixed with masker trials in selective and divided attention blocks, there was a tendency for performance to fall below the targeted 79% correct in both groups. A repeated-measures mixed model analysis of variance (ANOVA) was performed for the data in Figure 5, with within-subject factors of condition context and frequency, and a between-subject factor of group. Frequency (F(1,12) = .55, p = .470) and group (F(1,12) = .98, p = .341) were not significant, nor was any interaction. Only condition context was statistically significant, F(2,24) = 13.4, p < .001, reflecting the drop in performance in the masking contexts. This result may indicate that there was a cost associated with uncertainty as to whether a masker would be present on a given trial in the selective and divided attention blocks. A similar finding (IM on trials without a masker mixed in a block of masker trials) has been reported in Lutfi and Alexander (2005). Performance decrements of this type may fall in the category of IM due to masker uncertainty (e.g., Durlach et al., 2003; Spiegel, Picardi, & Green, 1981; Watson, 2005) even though maskers were not present on these trials. Even though performance tended to decrease in the masker contexts, performance across conditions was equal for NH and HI listeners, as was the goal.
Pattern identification performance in quiet trials (no masker) at both CFs across the different condition contexts for NH and HI listeners. Small symbols show individual data. Large bold symbols depict averaged data, with error bars showing standard deviations. The dashed line shows the targeted 79% correct, and the dotted line shows chance performance at 25% correct.
Pattern Identification in Masking
Effect of masking
The top row of Figure 6 shows the change in percent correct (from quiet) when a random or pattern masker was present in the selective attention condition at both CFs for NH and HI listeners. The quiet reference (which was subtracted from the percent correct values with the random or pattern masker) was each subject’s own performance on the quiet trials in the selective attention blocks. These quiet references were shown in Figure 5 (each individual symbol in the selective attention condition in the left and right panels). Larger decrements in performance in the presence of a masker relative to quiet are shown as larger negative values in Figure 6. The bottom row of Figure 6 shows the change in percent correct (from quiet) when a random or pattern masker was present in the divided attention condition for both CFs for NH and HI listeners. The quiet reference was each subject’s performance for the quiet trials in the divided attention blocks. Recall from Figure 5 that quiet performance in the selective and divided attention conditions tended to fall below the targeted 79% correct (more so for the divided attention condition), and individual variability increased. It was thought that this decrement in quiet performance reflected the cost of uncertainty from trial to trial. By using each individual’s quiet performance from the selective and divided attention blocks, the effects of uncertainty should be factored out, leaving only the effect of masker presence or content. It was assumed that the performance decrement due to masking reflected primarily IM, where IM was due to target-masker similarity (Durlach et al., 2003; Watson, 2005). Even after factoring out the variability present in quiet performance in the selective and divided attention contexts due to uncertainty, both NH and HI groups show fairly large intersubject variability in performance changes with the masker (amount of IM) across conditions and CFs in Figure 6.
Change in pattern identification performance in the presence of a masker (amount of IM) relative to individual condition-specific pattern identification performance in quiet (from Figure 5). Results with a random masker (left two panels) or a pattern masker (right panels) are shown for both NH and HI groups and both CFs. The top two panels show the change in performance in the selective attention condition. The bottom two panels show the change in performance in the divided attention condition. The individual data in each condition are shown as small symbols underlying the larger symbols (averaged data). The average symbols are connected by dashed lines to assist comparison of frequency within groups. Error bars are standard deviations.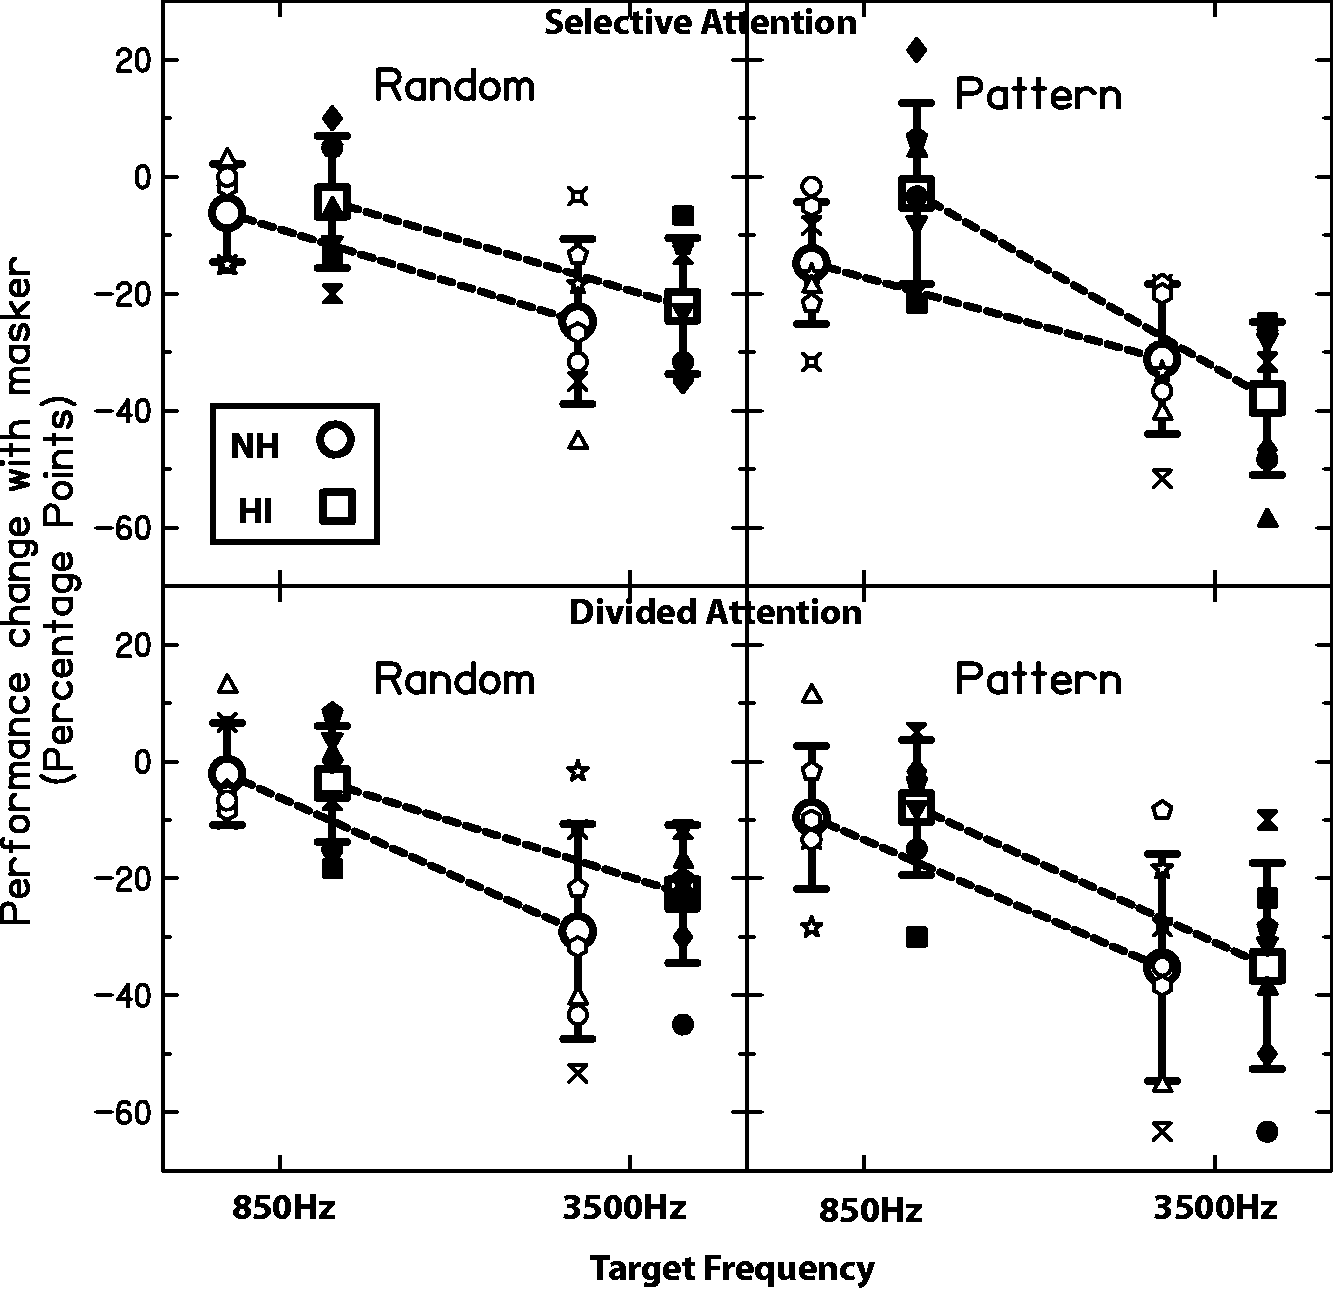
A repeated-measures ANOVA was performed for all data in Figure 6, with within-subject effects of attention condition, frequency, and masker type and a between-subject factor of group. Main effects of frequency and masker type were statistically significant (F(1,12) = 21.3, p = .001; F(1,12) = 25.6, p < .001), but attention (F(1,12) = .003, p = .956) and group (F(1,12) = .476, p = .503) were not. The interaction of frequency × masker was significant (F(1,12) = 7.48, p = .018), as was the interaction of frequency × masker × group (F(1,12) = 12.7, p = .004).
As may be seen in Figure 6, and as is supported by the significant main effect of frequency, there was a greater amount of masking when subjects were asked to attend to/report the high CF in the presence of the low CF than vice versa. The significant main effect of masker type highlights that there tended to be more masking with the pattern masker than with the random masker. This is consistent with target-masker similarity-based IM because the pattern masker inherently has greater similarity to the target than the random tone masker and could lead to target-masker confusions (e.g., Kidd et al., 2002). The lack of a significant main effect or interaction involving attention condition indicates that there was no apparent difference in performance when subjects were told to selectively attend to a single frequency stream or were told to divide attention between both streams, reporting the target stream after the stimulus presentation.
Overall, listeners tended to show a greater amount of masking when attending to/reporting the patterns at the high CF than at the low CF. The significant interaction of frequency × masker indicates that there was a difference in this frequency asymmetry depending on whether the masker was a random tone sequence or a pattern. Finally, the significant three-way interaction of frequency × masker × group indicates that this masker type × frequency interaction also differed by group. The size of the frequency asymmetry can be gleaned from the slope of the line drawn between the 850 Hz and 3500 Hz data points for each group. It can be seen in Figure 6 that the steepest line occurs for the HI group in the selective attention, pattern masker condition—the HI group shows less IM at the low CF and slightly more IM at the high CF in this condition relative to the NH group. Exploring the significant three-way interaction further, Figure 7 shows the data collapsed across attention condition. Again, it can be seen that the steepest line (greatest frequency asymmetry) occurs for the HI group in the pattern masker condition. Thus, the HI group showed a slightly greater frequency asymmetry than the NH group in the amount of IM for the confusable (pattern) masker.
Averaged change in pattern identification performance in the presence of a masker (from Figure 6) collapsed across selective and divided attention conditions. The symbols are connected by dashed lines to assist comparison across frequency.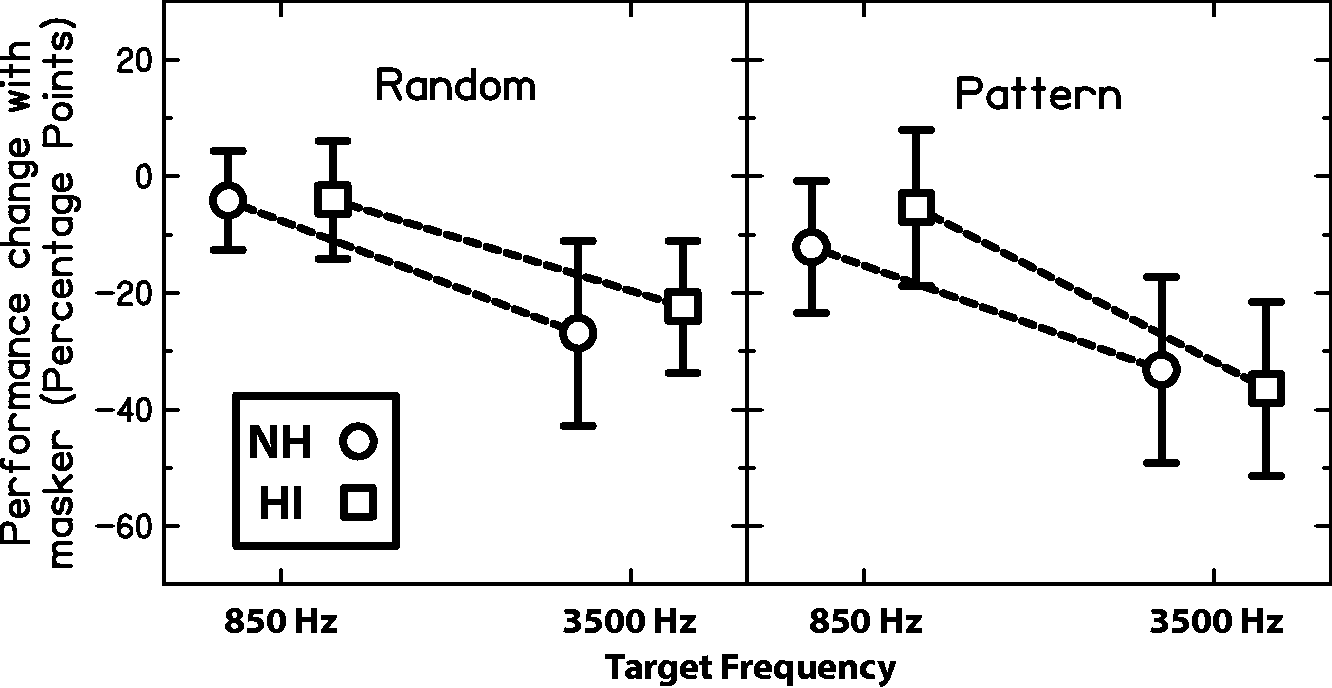
Masker confusion errors
Figure 8 shows the percentage of total errors in the pattern masker condition that were a result of masker confusions. In the error trials (where the target pattern was not selected), there were three remaining possible pattern choices. If all patterns remaining were equally likely to be selected (e.g., by random guessing among these three), the masker confusion errors would be 33%. As can be seen in Figure 8, masker confusion errors tended to be greater than 33% across conditions. The highest percentage of masker confusion errors occurred for the HI group when attending to/reporting the high CF. Planned comparisons of NH and HI averages in each condition and of low and high CF averages within groups revealed the groups were statistically significantly different for the high CF selective attention condition (p = .025) and divided attention condition (p = .025) and that only the HI group showed differences in masker errors between the low and high CF in the selective (p = .044) and divided (p = .010) conditions. Thus, the HI group made a greater proportion of masker confusion errors than the NH group when the target was at the high CF in both selective and divided conditions and showed a greater frequency asymmetry in proportion of masker errors, as well. These results are consistent with higher IM in HI listeners when attending to/reporting the high CF. Furthermore, these results may be evidence of an increased weighting of low CF information in HI listeners because they showed a significantly greater proportion of low-frequency masker intrusions when performing at the high CF than vice versa. In contrast, the NH listeners showed no frequency asymmetry in masker intrusions.
A comparison of the NH and HI groups in their masker confusion errors in the pattern masker condition across CFs and attention conditions. The height of the bars shows the percentage of errors that were a result of subjects erroneously selecting the presented masker pattern. If the nontarget patterns were selected at random in the error trials, the masker patterns should make up 33% of the errors (dashed line). The asterisks show the comparisons that were significantly different.
Discussion
Summary of Differences Between NH and HI Groups
There were differences in results between the NH and HI groups throughout the study. One expected difference was that the HI listeners with poorer detection thresholds in quiet required broader frequency spread in the patterns to achieve the same level of performance as the NH listeners in quiet. Specifically, frequency spread required for 79% correct pattern identification performance in quiet was correlated with quiet threshold. It was assumed that the pattern identification frequency spread would be limited by the discriminability of the tones making up the patterns. Previous studies have demonstrated that DLFs are somewhat poorer with SNHL (McDermott et al., 1998; Moore & Peters, 1992). Thus, it was expected that the same would hold for frequency spread in pattern identification. Indeed, the frequency spread was significantly correlated with quiet threshold and with the measured DLFs, as predicted.
Both NH and HI groups showed a drop in pattern identification performance in quiet when in the context of selective and divided attention masker tasks relative to a block of quiet trials (Figure 5). This result is very similar to that reported by Lutfi and Alexander (2005) for pure-tone detection on quiet trials mixed randomly with masked trials and indicates that across-trial uncertainty may produce a significant IM effect. Both NH and HI groups also showed an asymmetry in amount of IM (drop in performance with a masker re: quiet) at the two CFs (850 and 3500 Hz). There was more IM for the high CF in the presence of the low CF than vice versa. However, the asymmetry was slightly greater for the HI group than for the NH group in the case with a pattern masker. This result is supported by the significant three-way ANOVA interaction of frequency × pattern × group. A perhaps related finding was that, in the pattern masker condition, the HI group had significantly higher proportions of masker confusion errors when attending to/reporting the high CF than the NH group and showed a frequency asymmetry in masker confusion errors (whereas NH listeners did not). If the HI listeners were truly more susceptible to IM by the low CF when attending to/reporting the high CF, then it makes sense that they would make proportionally more masker confusion errors in this condition.
The present study attempted to equate performance across groups and listeners for pattern identification in quiet to highlight differences originating in the IM conditions. It is important to note that, although the differences in the masking conditions between NH and HI groups were only slight, this was likely because of all of the controls and corrections made in the stimuli. Had frequency spread been fixed or sound level been fixed at the same level in absolute terms for all listeners, there likely would have been much larger performance differences between NH and HI groups (including poorer performance in HI overall) in the IM conditions. It was assumed that the initial adjustment phase of the experiment compensated for the relevant peripheral differences among listeners. Furthermore, we conclude that the performance differences in IM conditions between groups after this compensation reflect central differences. Support and caveats for this assumption and conclusion are discussed later.
Peripheral or Central Effects?
As discussed in the Introduction section, some well-known differences in performance between NH and HI groups that are attributed primarily to the peripheral pathology causing hearing loss include differences in quiet thresholds, loudness perception, temporal resolution, frequency resolution, and frequency discriminability. By presenting the two streams at equal SLs and by adjusting the frequency spread of the tones making up the patterns to produce equal performance in quiet, it was hoped that the peripheral differences in audibility and frequency discriminability across CFs and listeners would be minimized. The equal SL method for equating audibility was used in lieu of presenting equal absolute levels (SPL) due to the large range of thresholds across frequencies and listeners. An equal SPL method would have meant that potentially uncomfortably loud levels would be presented to listeners with lower thresholds to ensure sufficient audibility for all. Even so, there are issues with the equal SL method of equating audibility due to the higher overall presentation levels for the HI listeners (cf. Gregan, Nelson, & Oxenham, 2010); one of these issues is discussed later. Possible temporal resolution differences between the groups were not explicitly controlled because it was assumed that timing information would not directly impact success in the current task. The issues of differences in loudness perception were explored, but these results were not reported in this study, as they did not appear to explain the primary findings observed (i.e., differences in masking results between NH and HI listeners; see note 2 and Roverud, Best, Mason, & Kidd, 2015).
It is unclear whether frequency resolution differences between the NH and HI groups posed a problem in the present study. Frequency resolution refers to the resolvability of components of a complex sound, which is relevant for the question of whether there was peripheral interaction of the two simultaneously presented streams or patterns in the masking conditions. This is a somewhat separate issue from the frequency spread of the tonal elements making up each individual stream, as the tones occurred sequentially within a stream. It was thought that the frequency separation of the two streams (CFs of 3500 Hz–850 Hz = 2650 Hz) was sufficient to rule out peripheral interaction between them, particularly at the SL used. However, because 15 dB SL corresponds to a higher absolute level for the HI listeners, there would have been broader excitation of the tones on the basilar membrane and more risk for peripheral interaction in the HI listeners. In addition, with the wider frequency spread required for some HI listeners for tonal elements within a stream, the high-frequency component (FeH) of the 850-Hz stream and the low-frequency component (FeL) of the 3500-Hz stream would have been closer in frequency and at greater risk for peripheral interaction. For the HI listener with the widest frequency spread, the frequency separation of the two streams for the closest tones was 2240 Hz (3159 Hz–919 Hz); for the NH listener with the narrowest frequency spread, the frequency separation of the closest tones was 2636 Hz (3488 Hz–853 Hz).
Previous studies indicate that this frequency separation of streams was likely sufficient to rule out peripheral interaction of target and masker and that differences between groups in the IM conditions may indeed be attributed to more central factors. Both de Laat and Plomp (1985) and Grose and Hall (1996) measured melody recognition in the presence of two other competing melodies in NH and HI listeners. Those studies adaptively varied the frequency separation of the melody streams (instead of the tonal elements making up those streams) to achieve 79% correct melody recognition. de Laat and Plomp (1985) reported that NH listeners required, on average, a 5 semitone difference between streams, whereas HI listeners required, on average, a 27 semitone difference to achieve criterion performance. For comparison, in the present study, the equivalent frequency difference of nearest tones of the two streams or CFs for the HI listener with the widest frequency spread was about 21.4 semitones; for the NH listener with the narrowest frequency spread, it was 24.4 semitones. However, de Laat and Plomp (1985) found no relationship between the difference in frequency required to perform the task and the estimates of auditory bandwidth. Grose and Hall (1996) reported findings similar to those of de Laat and Plomp (1985) with respect to greater difference in frequency needed by HI listeners relative to NH listeners to perform a melody recognition task. They also found no significant correlation of the semitone differences needed for the task with estimates of auditory bandwidths or with quiet threshold. Given the lack of a consistent relationship between these frequency differences and quiet thresholds or auditory bandwidths, the greater susceptibility to interference by the masking streams in HI listeners was likely due to central, rather than peripheral, factors (de Laat & Plomp, 1985). This conclusion is consistent with the idea that the HI listeners required wider frequency separation between streams because they were more susceptible to informational rather than energetic masking. Thus, the frequency separation of the streams in the present study was perhaps sufficient to avoid peripheral interaction even for the HI listeners.
It appears that the peripheral differences among listeners were compensated for in the present study, at least with respect to the common effects of SNHL discussed earlier. It should be noted that the frequency spread required for equal pattern identification performance may also have been influenced by any across-subject differences in central processing abilities and not just peripheral factors. Such putative differences in central processing could contribute to the individual variability in the frequency spread even for NH listeners (Figure 3). Thus, the initial adjustment phase in the study may have compensated for this source of variability, as well. If true, the differences (between subjects and groups) present in the IM conditions are assumed to reflect the remaining or additional central differences in IM.
There was a frequency asymmetry in IM that favored the low frequencies in nearly all listeners, both NH and HI. However, it is not immediately clear why this occurred. It has been suggested that attention to auditory objects or streams can be influenced by both volitional, top-down control and by the inherent salience of the objects (Shinn-Cunningham, 2008). In some cases, the more salient source can win out over top-down control (Shinn-Cunningham, 2008). Following this line of reasoning, it may be that differences in salience of pitch percepts of the two frequencies in the present study (pitch being a relevant dimension in the task used in this study) resulted in a dominant frequency when presented concurrently. Pitch, at least for complex tones, tends to be more robust at lower frequencies than at higher frequencies (cf. Oxenham, 2012) and is influenced a great deal more by the lower harmonics than by the higher harmonics (Dai, 2000; Moore, Glasberg, & Peters, 1985; Plomp, 1964; Ritsma, 1967). Furthermore, there is evidence that frequency discriminability of pure tones is determined more by temporal information than place information (Sek & Moore, 1995), and temporal information (phase locking) becomes less precise above about 1 to 2 kHz (Johnson, 1980; Joris & Verschooten, 2013). If the low CF (850 Hz) evoked a more salient or potent perception of pitch than the high CF (3500 Hz), it may have been involuntarily weighted more in a mixture of low and high CFs. A similar interpretation has been used to explain the frequency asymmetry of binaural interference, as well (Best, Gallun, Carlile, & Shinn-Cunningham, 2007). Binaural interference refers to the worsening of high-frequency binaural judgments (interaural time difference [ITD] just-noticeable differences) when made in the presence of a low-frequency interferer, but there is far less binaural interference when low-frequency judgments are made in the presence of a high-frequency interferer (e.g., McFadden & Pasanen, 1976). Best et al. (2007) suggested that this direction of frequency asymmetry was a reflection of the fact that low-frequency ITDs are more salient than high-frequency ITDs.
In the same vein, this “salience overriding top-down selection” argument may also explain the even greater frequency asymmetry in HI listeners than in NH listeners. However, this is a more peripherally based explanation. Despite all of the controls in place to compensate for peripheral processing differences, some unaccounted-for differences may have remained at the high CF of the HI listeners—possibly some type of distortion or even “dead regions” leading to distorted pitch perception (e.g., Huss & Moore, 2005). So, in addition to the involuntary differential frequency weighting due to pitch salience in all listeners, the HI listeners may have placed even less weight on the high CF stimulus due to further reduced salience in regions with poorer hearing.
An alternative explanation is that the greater frequency asymmetry in HI listeners had a more central origin. It has been suggested that peripheral hearing loss can elicit central changes in how listeners process auditory information, which can manifest as a difference in frequency weighting of information with SNHL (Doherty & Lutfi, 1999; Stelmachowicz et al., 1990). For a sound mixture composed of multiple frequencies, HI listeners may be less likely (when compared with NH listeners) to make use of certain frequencies and instead rely more on other frequencies when performing an auditory task. Although Stelmachowicz et al. (1990) suggested that HI listeners may place greater weight in the low-frequency regions of a speech stimulus, Doherty and Lutfi (1999) suggested that HI listeners may actually place greater weight on the frequency regions corresponding to hearing loss (high frequencies in that case). As mentioned in the Introduction section, these discrepant findings are perhaps explained by methodological differences in those studies. Furthermore, the Doherty and Lutfi (1999) findings may have been influenced by SL differences between the NH and HI groups (see Alexander & Lutfi, 2004). In the present study, relative to NH listeners, HI listener performance with the pattern masker was worse in the frequency region of greater overall hearing loss (high CF) and was better in the frequency region with better overall hearing sensitivity (low CF; Figures 6 and 7), even though the same SLs were used within and across listeners, and the frequency spread was chosen to equate quiet performance at the two frequencies. Furthermore, the HI group showed a significantly higher proportion of masker confusion errors when attending to/reporting the high CF. Thus, the results suggest that HI listeners placed greater weight on the low frequencies, where hearing thresholds were better. This conclusion is at least superficially consistent with the findings of Stelmachowicz et al. (1990) and with physiological studies showing cortical reorganization favoring frequency regions with better hearing (e.g., Dietrich et al., 2001). Whether the exaggerated frequency asymmetry in HI listeners was a consequence of central changes in weighting or cortical reorganization or was due to peripherally related salience reduction cannot be definitively resolved based on the present results. However, the fact that the greater asymmetry occurred only for the pattern masker with greater target-masker similarity lends support to the central-origin argument.
Implications for Selective and Divided Listening
Performance was similar in selective and divided attention conditions in the present study. It is possible that this was because the two simultaneously presented streams were grouped into a single auditory object—akin to a failure in formation of auditory objects (Shinn-Cunningham & Best, 2008). If this were the case, the results may indicate that listeners were unable to listen truly selectively in the selective attention case and instead were forced to work with a single fused auditory object (comprising the two CF regions) in all conditions. In support of this idea, masker confusion error rates were similar in divided and selective attention conditions (Figure 8). Current theories propose that tone pulses with two simultaneous frequencies, like those in the present study, form separate perceptual streams based on the neural separation of activated frequency channels (“population separation theory”) or by the similarity or coherence in their responses over time (“temporal coherence theory”; cf. Shamma, Elhilali, & Micheyl, 2011). The CFs used in the present study had a large separation (more than a 21 semitone separation), and no two simultaneously presented sequences consisted of the same changes in frequency over time. Thus, both theories would predict that the two CFs should form separate streams. However, empirical studies of stream separation report results (including subjective judgments) that vary considerably within and across listeners depending on frequency separation and onset synchrony (Micheyl, Hanson, Demany, Shamma, & Oxenham, 2013). Subjective impressions of the present stimuli were also fairly ambiguous. Subjects reported difficulty with perceiving two separate streams when they were presented simultaneously, possibly because one of the frequencies (typically the low CF) always dominated the percept.
A large majority of studies on selective and divided auditory attention have used speech stimuli, distinguishing sources in the spatial domain (e.g., Best et al., 2006; McCloy & Lee, 2015) or by ear (e.g., Gallun et al., 2007). In each of these studies, poorer performance in the divided task relative to the selective task was reported. In contrast, the present study made use of nonspeech tonal patterns, presented monaurally, with the sources distinguished by frequency. Although perhaps less ecologically relevant than speech stimuli, using pure-tone stimuli allowed for more precise stimulus control—it was possible to control for peripheral interactions, as well as other top-down factors (e.g., linguistic factors). However, unlike the previous speech studies, listeners in the present study performed similarly in the divided attention and selective attention tasks. This similar selective and divided task performance is consistent with results from a few other nonspeech studies examining effects of target frequency uncertainty. Demany et al. (2015), although not comparing selective and divided attention tasks, demonstrated that listeners could successfully monitor two concurrent pure-tone melodies separated in frequency with fairly high sensitivity and accuracy. Kidd et al. (2008b) compared tone-detection thresholds in conditions where subjects monitored a single frequency channel and those in which subjects monitored two frequency channels, akin to the selective and divided attention conditions of the present study. Their findings did show a cost in the divided attention condition relative to the single-channel condition but only when there were maskers surrounding the target frequencies. Without these intervening maskers, as was the case in the present study, there was no difference between divided attention and single-channel conditions. In addition, Kidd et al. (2011) showed no difference between fixed target frequency (selective attention) conditions and random target frequency (presumably broad attention) conditions in a suprathreshold pattern identification task in the presence of informational maskers. What the present study adds is that this similar performance in selective and divided attention tasks in the frequency domain for nonspeech pattern identification appears to hold for both NH and HI listeners.
Summary and Conclusions
The present study aimed to equate performance among listeners in quiet to home in on central differences in the IM conditions between NH and HI groups. There were two ways that the stimulus was altered for the HI listeners in an attempt to equate performance with NH listeners in quiet. First, the stimuli were presented at the same SL for all listeners, which meant higher absolute stimulus levels for the HI listeners. Second, the frequency spread of the elements comprising the patterns was adjusted so that identification performance in quiet was equal across all individual subjects, which meant generally greater frequency spread for the HI listeners. Previous work has established that loss of sensitivity to auditory stimuli and increased pure-tone frequency difference limens are characteristic manifestations of cochlear pathology. To that extent, these stimulus alterations may be considered as partial compensation for the consequences of the peripheral pathology with the caveat that they are intended only to equate performance in those two domains. It should be noted that performance on the pattern identification task, even in unmasked or quiet conditions, may be influenced by across-trial uncertainty as seen clearly in Figure 5 (pattern identification performance in quiet drops in masked contexts). Thus, both peripheral and central factors may—and almost certainly do—determine performance in this task. However, within these limitations, the differences in performance between groups observed under masked conditions after incorporating these compensations—the greater frequency asymmetry in performance and masker confusion errors for HI listeners with the pattern masker—seem most likely to originate central to the cochlear pathology responsible for the hearing loss.
These results indicate that there may be subtle central differences in how listeners with SNHL process simultaneously presented sounds across frequency regions—they may rely more on frequencies where thresholds are better and less on frequencies in the region of more hearing loss. This finding could have broader implications than just for the conditions examined here. Outside of the laboratory setting, correcting for all peripheral differences in ecologically relevant stimuli such as speech is not feasible. Even with hearing aids to assist with audibility, other peripheral differences between NH and HI listeners remain. The small (presumably) central differences observed in the present study may compound with the peripheral differences, contributing to the difficulty that HI listeners experience in multisource environments.
Footnotes
Acknowledgments
The authors would like to thank Lorraine Delhorne for help with subject recruitment and Timothy Streeter for technical support.
Declaration of Conflicting Interests
The authors declared no potential conflicts of interest with respect to the research, authorship, and/or publication of this article.
Funding
The authors disclosed receipt of the following financial support for the research, authorship, and/or publication of this article: This work was supported by National Institutes of Health, National Institutes on Deafness and Other Communication Disorders (grant numbers: R01DC04545 and P30-DC04663), and by the Air Force Office of Scientific Research (grant number FA9550-12-1-0171).