
Abstract
Sexual minorities are a rapidly growing population, with recent estimates showing a two-fold increase in the percentage of sexual minorities over the past decade. Working with relatively few measures to identify sexual minorities, social scientists have amassed an impressive amount of evidence on inequality by sexuality. Despite this remarkable work, I argue that it is important to take a step back analytically and re-assess sexual minorities from a descriptive standpoint. Using population-level data from the CDC’s Behavioral Risk Factor Surveillance System, I provide unadjusted estimates of sociodemographic, socioeconomic, and family characteristics by sexual identity. Results reveal that sexual minorities are younger, are more racially diverse, and concentrate in different parts of the country than heterosexuals. Similarly, sexual minorities have remarkably different socioeconomic lives than heterosexuals, who enjoy higher annual household incomes, achieve higher educational attainment, and are more likely to be homeowners. Sexual minorities are also less likely to be married than heterosexuals. I conclude by highlighting that descriptive research can illuminate compositional differences between sexual minorities and heterosexuals; provide rationales for adjusting for certain characteristics that might confound relationships between sexual identity and numerous outcomes; and highlight potential explanatory mechanisms to make better sense of well-established findings regarding sexual minority disadvantage.
Sexual and gender minorities are a growing population. In 2012, only 3.5 percent of Americans identified as lesbian, gay, bisexual, or transgender (LGBT). By 2022, 7.2 percent of Americans identified as LGBT (Jones 2022), implying the existence of about 20 million LGBT people. Dramatic increases in the share of sexual and gender minorities in recent years raise questions about the sociodemographic, socioeconomic, and family characteristics of this population in the contemporary United States. Evidence across the social sciences, amassed by sociologists, demographers, economists, and psychologists, shows immense inequality by sexuality. For example, sexual minorities report worse physical and mental health than heterosexuals (Gorman et al. 2015; Hsieh and shuster 2021; Liu and Reczek 2021; Meyer 2003). Resume audit studies demonstrate the presence of discriminatory practices against presumed gay men (Tilcsik 2011) and queer women (Mishel 2016) in the labor market. Sexual minorities, particularly bisexuals, take home lower wages than heterosexuals (Badgett 1995; Mize 2016). Gay, lesbian, and bisexual people disclose lower levels of happiness (Thomeer and Reczek 2016) and social connectedness (Stacey, Reczek, and Spiker 2022) than heterosexuals. Taken together, an impressive amount about sexual inequality is known.
Research shows important differences in the sociodemographic, socioeconomic, and family lives of sexual minorities and heterosexuals. For example, sexual minorities tend to be much younger on average than heterosexuals, which is particularly true for bisexuals (Gonzales and Henning-Smith 2017), and women are more likely to be sexual minorities than are men (Gates 2011), suggesting gendered differences in sexual minority identification. Racial differences have been documented, too, as sexual minorities are disproportionately racial minorities (Gates 2014). In fact, Black women account for the largest share of the increase in bisexual identification in recent cohorts (Bridges and Moore 2018). One of the most well-developed areas regarding sexuality concerns socioeconomic inequality, with most of this research focusing on wage penalties and premiums (Badgett 1995; Baumle and Poston 2011; Mize 2016). Sexual minorities are typically penalized in the labor market, taking home lower wages (Baumle and Poston 2011), in part because of discrimination (Mize 2016). Sexual minorities, especially bisexuals, fall below the poverty line at greater rates than heterosexuals (Badgett, Choi, and Wilson 2019). But, as recent work has shown, not all sexual minorities are disadvantaged socioeconomically, as gay and bisexual men have remarkably high rates of bachelor’s and advanced degrees (Mittleman 2022), often exceeding the educational attainment of heterosexual women. Finally, when it comes to the family lives of sexual minorities, gay, lesbian, and bisexual men and women are far less likely than heterosexual men and women, respectively, to be married or live with a partner, and sexual minority men are more likely to have no residential children than heterosexual men (Gonzales and Henning-Smith 2017).
Despite this critically important work, I contend that it is important to step back analytically and provide descriptive information about the sociodemographic, socioeconomic, and family lives of a rapidly growing population. Prior descriptive work, although useful, tends to be based on only one or a few years of data (Gonzales and Henning-Smith 2017; Gorman et al. 2015), limiting the sample sizes of sexual minorities. As a result, scholars have had to collapse outcome categories together, for example, collapsing categories of divorced, widowed, and separated into one category (Gonzales and Henning-Smith 2017). Other work has had to compare the aggregate sexual minority population to the heterosexual population (Badgett 1995; see Mize 2016), obscuring information about specific sexual minority groups. Therefore, there is much to be learned from re-assessing sexual minorities from a descriptive standpoint and contextualizing those findings in the broader literature.
This type of descriptive research, I contend, is important for primarily three reasons. First, it can provide insight into compositional differences among different sexual identity groups. Despite advancements in data collection and measurement owing to the efforts of many scholars working to implement measures to identify sexual minorities on national surveys (see Westbrook, Budnick, and Saperstein 2022; Westbrook and Saperstein 2015), sexual minorities are an under-researched population compared with heterosexuals (Reczek 2020). Descriptive research can deepen our understanding of sociodemographic differences by sexuality. This is particularly imperative for groups like bisexuals and others (e.g., those who identify as “other” or “something else”) because they are relatively understudied compared with gay/lesbian populations.
Second, descriptive research can provide insight into what types of characteristics one should adjust for when modeling associations between sexual identity and a given outcome to avoid omitted variable bias or minimize the potential for confounding (Bartram 2021). 1 For example, in models estimating physical health disparities by sexuality it is important to adjust for age. Because sexual minorities tend to be younger on average than heterosexuals (Liu and Reczek 2021), differences in the age profiles of sexual minorities and heterosexuals would suppress health differences, making health disparities appear smaller than they are if left unadjusted.
Finally, descriptive research can also shed much-needed light on potential mechanisms that might underlie well-established findings across the social sciences (Liu and Reczek 2021; Meyer 2003). For instance, descriptive research showing that sexual minorities tend to bring home lower household incomes than heterosexuals could explain part of the sexual minority health disadvantage (Gonzales, Przedworski, and Henning-Smith 2016; Gorman et al. 2015). Fundamental cause theory, which points to the ways socioeconomic status (SES) shapes health and well-being by circumscribing access to resources (Link and Phelan 1995), highlights that SES could heavily contribute to the sexual minority health disadvantage. Similarly, research on the marital premium in health underscores marriage as an important institution for the health of Americans (Hsieh and Liu 2019; Waite 1995). Heterogeneity in marriage by sexuality might underlie a nontrivial portion of the sexual minority health disadvantage. Of course, much of this has been theorized elsewhere (see Gorman et al., 2015; Meyer 2003). My broader point is that descriptive research is beneficial to shed light on potential reasons why sexual minorities might experience disadvantage on a wide range of indicators.
In this paper, I provide an updated data portrait of heterosexuals and sexual minorities in 44 states from 2014 to 2022. Capitalizing on recent population-level data from the Centers for Disease Control and Prevention’s (CDC) Behavioral Risk Factor Surveillance System (BRFSS), I provide unadjusted estimates on a range of sociodemographic, socioeconomic, and family characteristics for heterosexual, gay/lesbian, bisexual, and other/something else populations and then disaggregate results by gender. This research note is a critical step in bringing us closer to a more holistic and up-to-date data portrait of heterosexuals and sexual minorities across 44 states in the United States.
Method
I use data from the CDC’s BRFSS from the years 2014 to 2022 to provide an updated data portrait of heterosexual, gay/lesbian, bisexual, and other/something else populations. The BRFSS employs a random digit dialing method to both landline and cellular phones with a household-based probability design. Overseen by each U.S. state and territory’s public health department, the BRFSS provides a window into a wide range of characteristics of a population-based sample of noninstitutionalized American adults. Starting in 2014, the Sexual Orientation and Gender Identity (SOGI) Module was implemented selectively in certain states, permitting identification of sexual minorities. From 2014 to 2022, 44 states have included the optional SOGI Module (92,804 identified as gay/lesbian, bisexual, or as other/something else; see Table A1 in the appendix). The optional SOGI Module makes the BRFSS one of the most used sources of survey data to investigate inequality by sexuality, particularly when it comes to health (Gonzales and Henning-Smith 2017; Gorman et al., 2015; Stacey and Wislar 2023). The BRFSS data are not nationally representative; I return to this limitation in the Discussion section.
Dependent Variables
The BRFSS includes a demographic module, which includes several measures providing important sociodemographic information. The following dependent variables were examined: age (in years, top-coded at 80), sex (male or female), gender (cisgender men; cisgender women; transgender men; transgender women; or gender nonconforming), race/ethnicity (White; Black; Hispanic/Latinx; Asian; or Other race), and region (South; Northeast; Midwest; or West). 2 Four variables assess respondents’ socioeconomic status: employment status (not employed or employed), education (less than high school education; high school education; some college; or college education or more), annual household income (under $25,000; $25,000 to $49,999; $50,000 to $74,999; $75,000 or more), and homeownership (no or yes). Finally, two variables assess respondents’ familial lives: union status (never married; married; divorced; widowed; separated; or cohabiting) and number of residential children.
Sexual Identity
The main independent variable is sexual identity, which was reported directly by study participants in the SOGI Module. Respondents were asked, “Do you consider yourself to be?” Response categories included “heterosexual, that is, not lesbian or gay,” “gay/lesbian,” “bisexual,” “other”/“something else,” and “I don’t know the answer.” 3 I created a four-category sexual identity variable (straight/heterosexual; gay/lesbian; bisexual; and other/something else) and assigned as missing those who did not know or refused to answer. After constructing the analytic sample, I was able to identify 1,445,687 heterosexuals; 26,823 gays/lesbians; 33,317 bisexuals; and 13,714 people who identified as “other” or “something else.”
Analytic Strategy
I first produce unweighted sample sizes and weighted percentages/means and standard deviations across all outcomes and the independent variable. I then estimate average values or proportion estimates for all outcomes by sexual identity and then examine differences using Wald tests. I compare sexual minorities in the aggregate (lesbian/gay, bisexual, and other/something else populations) to heterosexuals and then disaggregate the sexual minority group to provide more fine-grained information by sexual identity. I compare sexual minorities and gay/lesbian, bisexual, and other/something else populations to heterosexuals and conduct pairwise comparisons to analyze within-group differences between sexual minority groups. Finally, I show gender-stratified results for each outcome. Because sexual minorities are disproportionately women, I sought to examine if any observed results were driven by gender rather than sexuality.
All analyses were conducted in Stata, version 18. To achieve population representation, I assign survey weights to each respondent using the svyset command. Weighting the data accommodates the sampling design, adjusts for item nonresponse, and reflects the state’s population. 4 Missing data were handled with listwise deletion.
Results
Unweighted Sample Sizes and Weighed Means and Percentages (and Standard Deviations) of Sample.
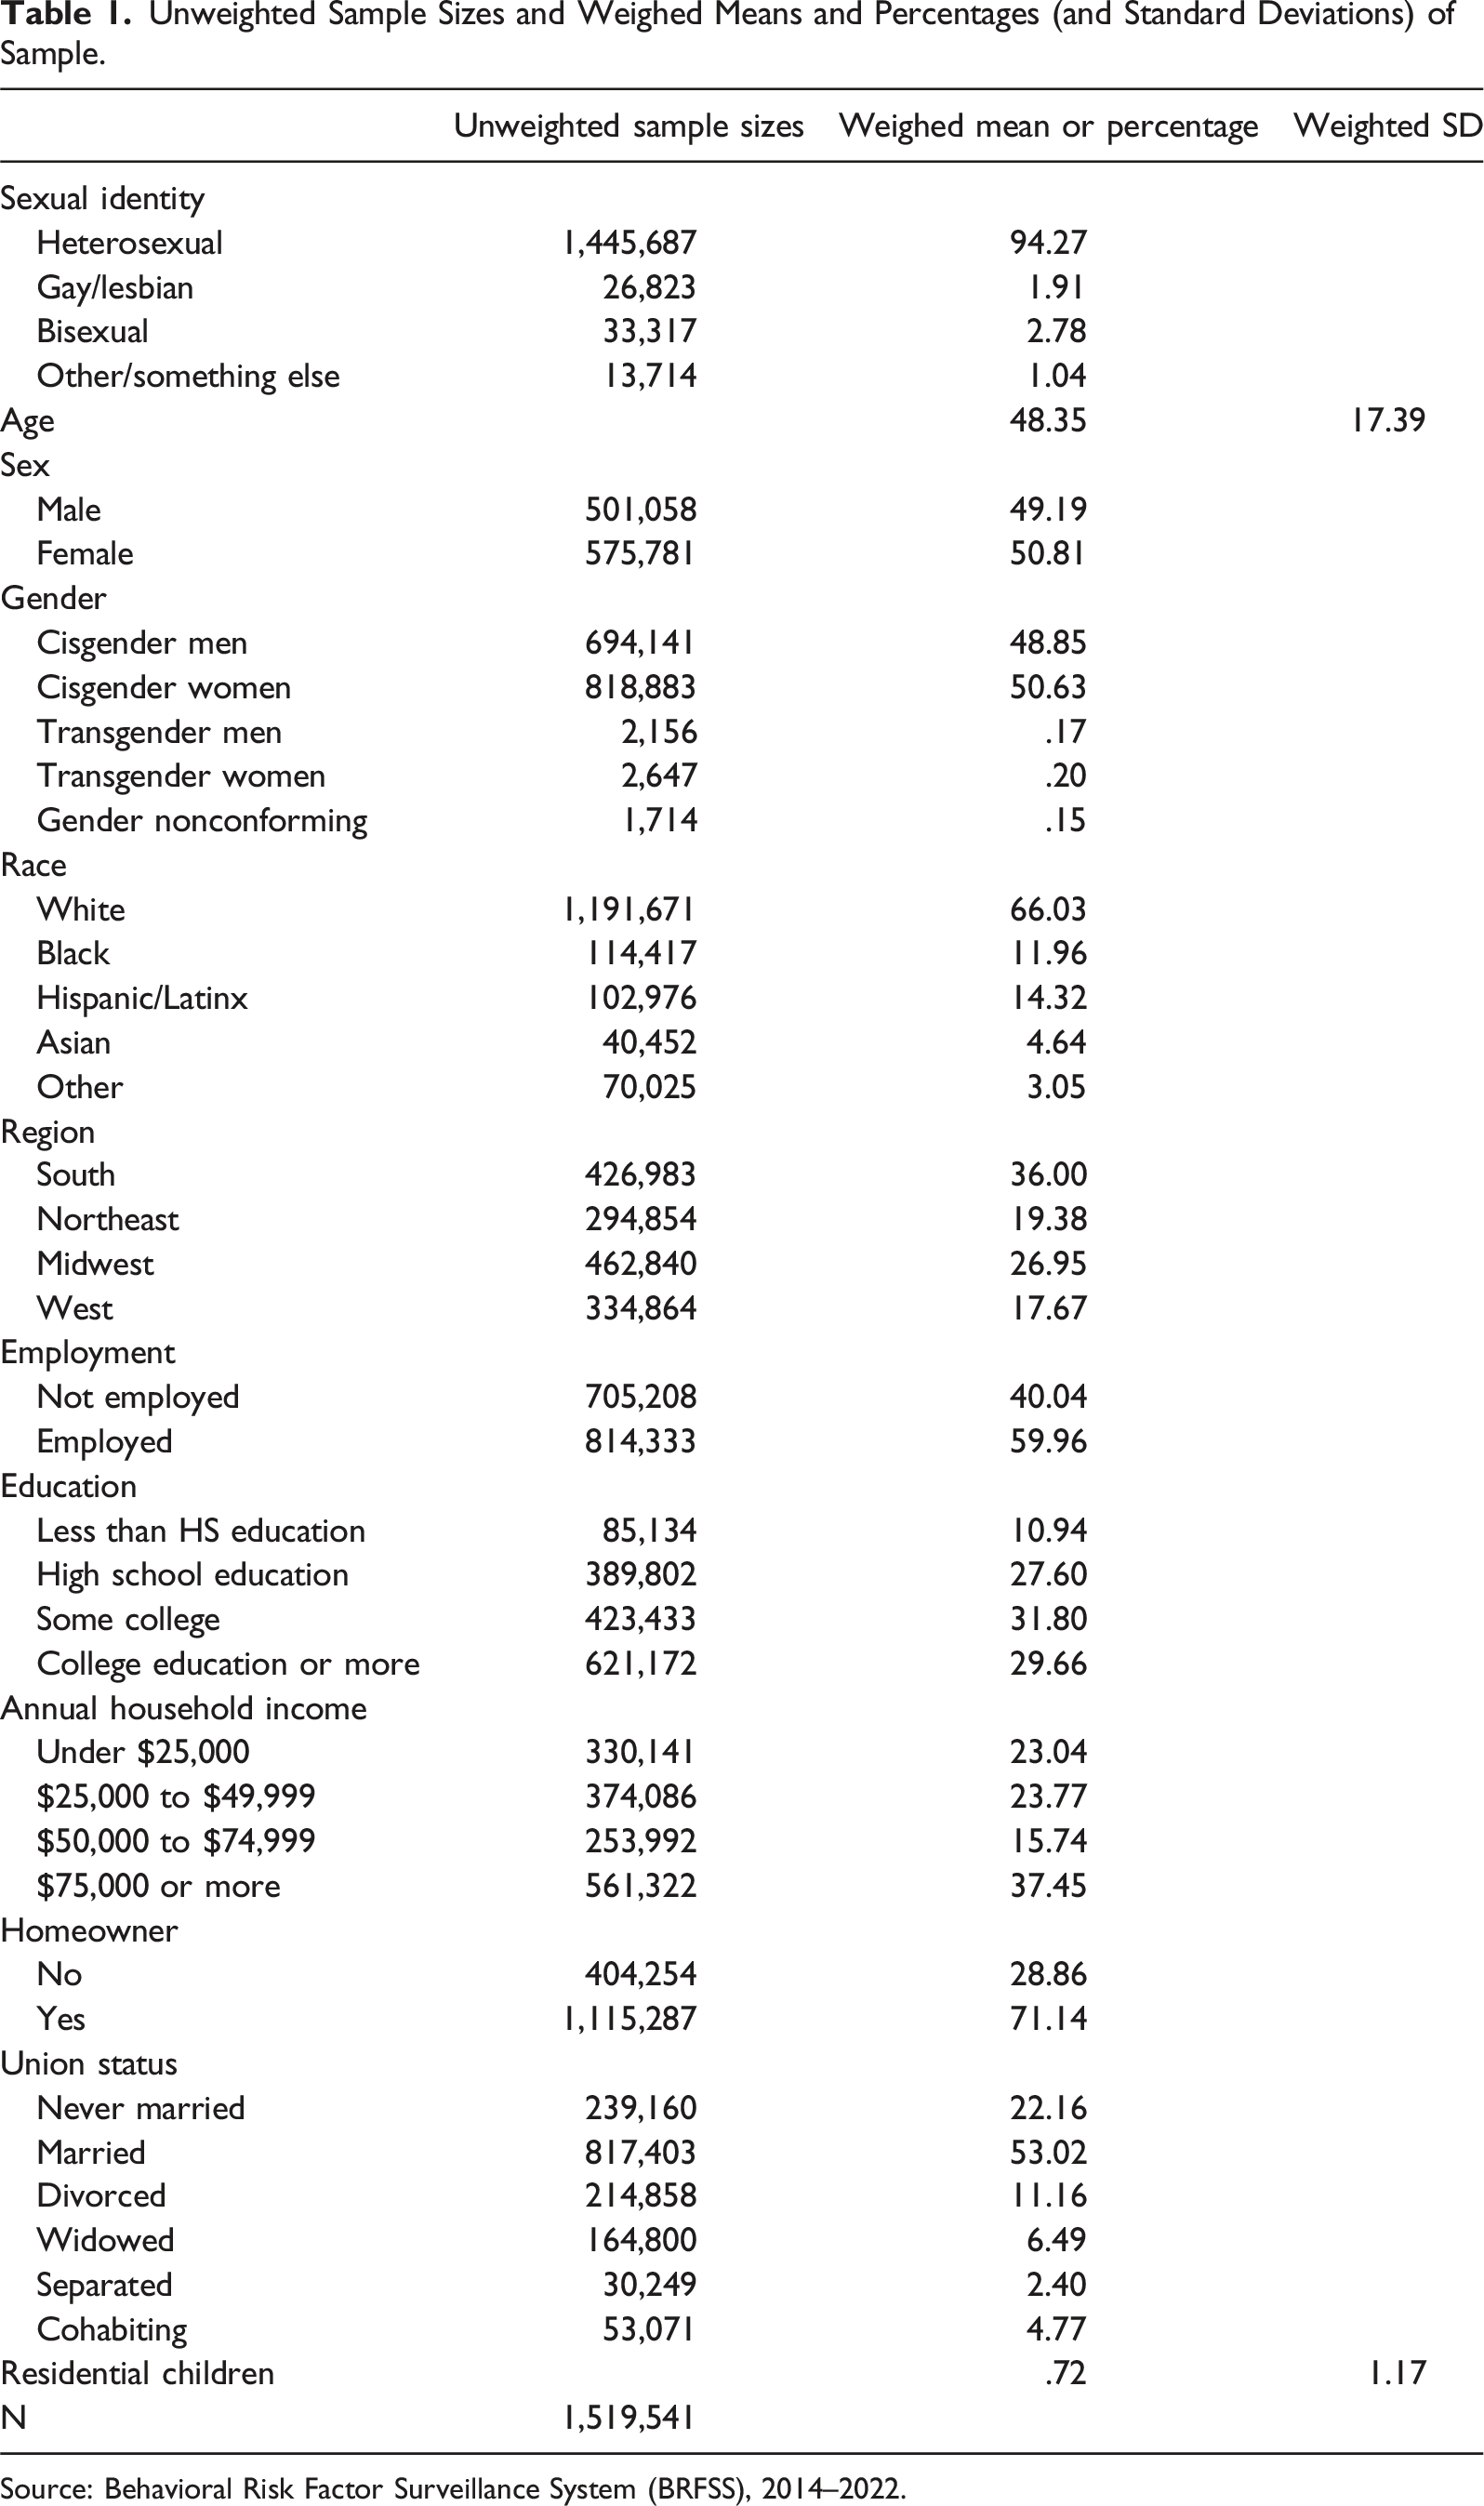
Source: Behavioral Risk Factor Surveillance System (BRFSS), 2014–2022.
Percentages and Means (and Standard Deviations) by Sexual Identity (N = 1,519,541).
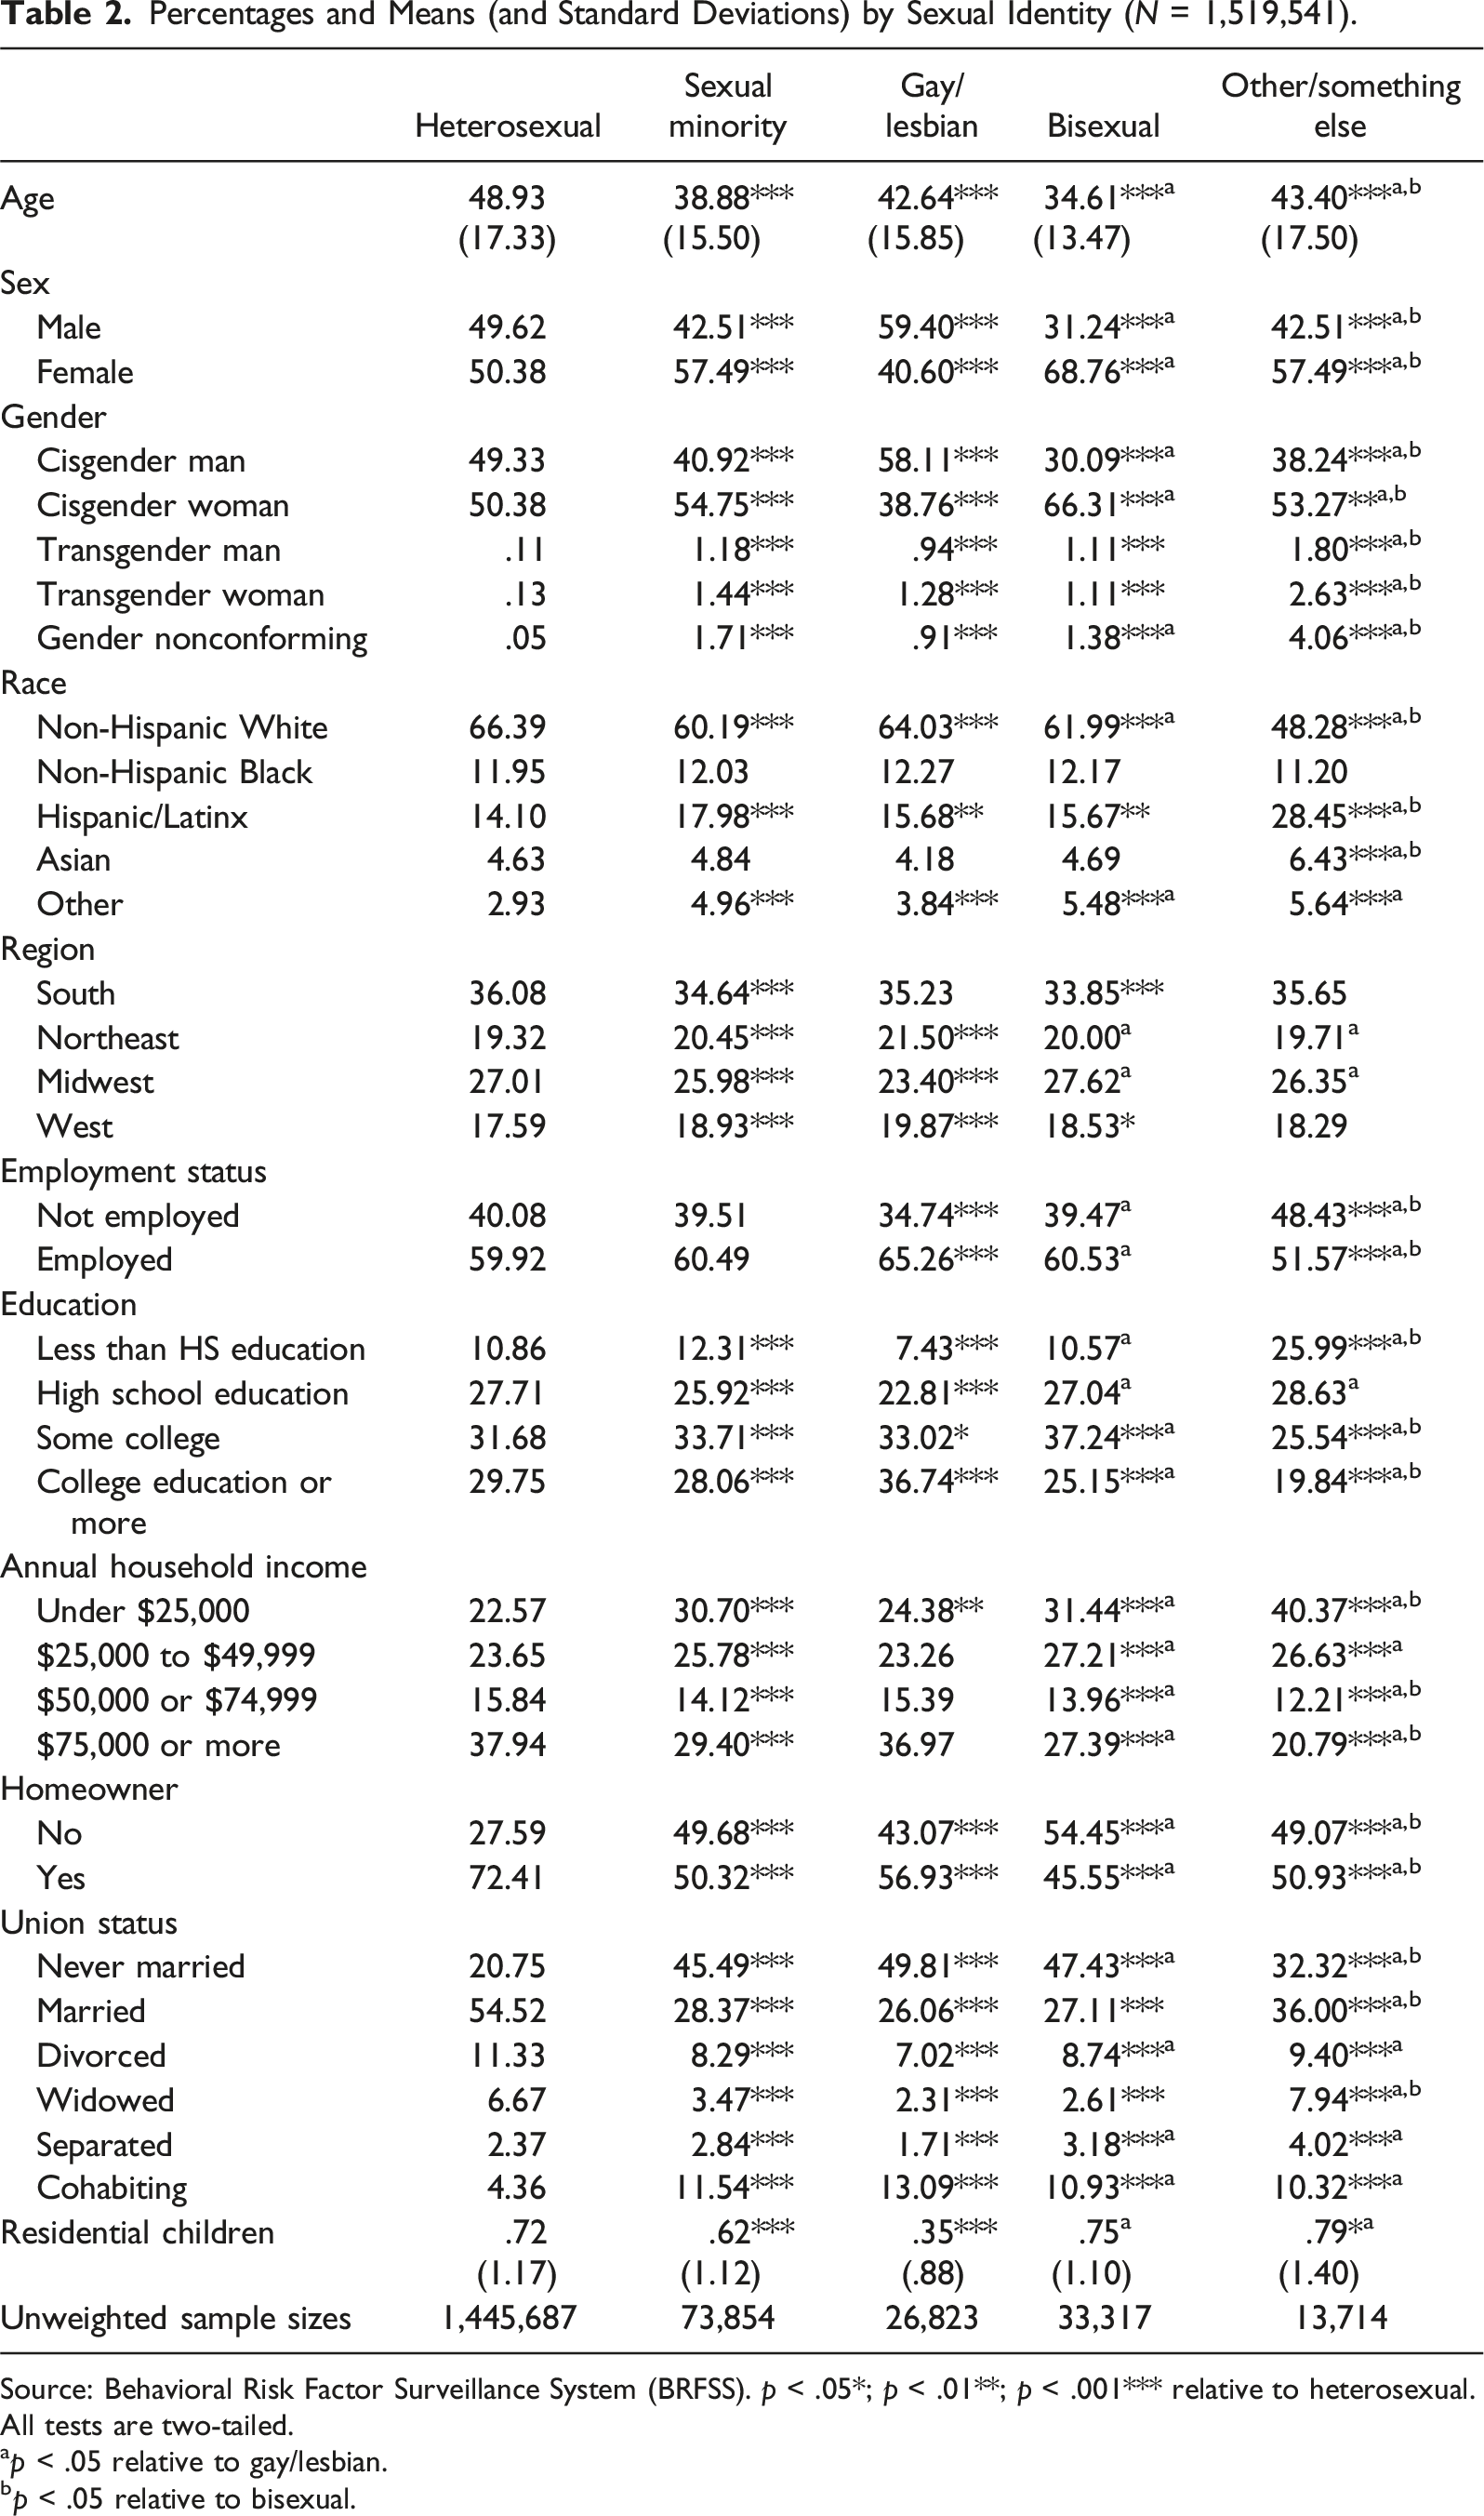
Source: Behavioral Risk Factor Surveillance System (BRFSS). p < .05*; p < .01**; p < .001*** relative to heterosexual.
All tests are two-tailed.
ap < .05 relative to gay/lesbian.
bp < .05 relative to bisexual.
Compositional differences between sexual minorities and heterosexuals also extend to race/ethnicity—sexual minorities are less likely to identify as White than heterosexuals and are more likely to identify as Hispanic/Latinx and identify as another race. Interestingly, when the results are broken down further, the results show that other/something else people are especially less likely than heterosexuals to report their race as White. Although all sexual minorities report identifying as Hispanic/Latinx at higher percentages than heterosexuals, other/something else populations are far more likely to identify as Hispanic/Latinx (28.5 percent) relative to heterosexuals (14.1 percent). In general, gay/lesbian and bisexual populations tend to have similar racial profiles, who differ from other/something else populations with regard to identification as White, Latinx, and Asian.
Sexual minorities also concentrate in different parts of the country, according to variation in region of residence by sexual identity. Collectively, sexual minorities are less likely to live in the South and the Midwest but are more likely to live in the Northeast and West than heterosexuals. Disaggregating the sexual minority group shows that several of the differences are driven by gays/lesbians. For example, it is gays/lesbians who are more likely to call the Northeast home and less likely to live in the Midwest than heterosexuals, although bisexuals are slightly more likely than heterosexuals to live in the West and less likely to live in the South. Other/something else people have remarkably similar regional profiles relative to heterosexuals. Pairwise comparisons demonstrate that bisexuals and other/something else populations are less likely to reside in the Northeast and are more likely to reside in the Midwest than gay/lesbian people.
Sexual minorities tend to have different employment and education profiles than heterosexuals. Although no aggregate findings are significantly different by sexual identity for employment, the results show that gay/lesbian people are more likely and other/something else people less likely to report being employed than heterosexuals. Fascinatingly, other/something else people are less likely than gay/lesbian and bisexual populations to be employed, the latter of whom differ in employment rates from gay/lesbians. Turning to results for education, sexual minorities typically do not achieve the same educational attainment of heterosexuals. However, this aggregate finding obscures a group with relatively high levels of degree attainment: gays and lesbians. Indeed, gay/lesbian populations are more likely than heterosexuals to report completing some college and even having graduated from college. Bisexuals are more likely to have completed some college education than are heterosexuals, but the opposite is true for reporting a college education. The disparity is larger when comparing other/something else populations relative to heterosexuals: 26.0 percent of other/something else people report less than a high school education relative to only 10.9 percent of heterosexuals. Other/something else people are also less likely to report some college experience and a college education (or more) compared with heterosexuals. Bisexual and other/something else populations tend to be disadvantaged relative to gays/lesbians, too, regarding college degree attainment.
Results for annual household income and homeownership suggest immense stratification by sexuality. Sexual minorities tend to reside in households with lower average incomes than do heterosexuals. While 37.9 percent of heterosexuals live in a household that brings home $75,000 or more yearly, only 27.4 percent of bisexuals and 20.8 percent of other/something else populations report the same. Bisexual and other/something else populations are far worse off financially relative to gay/lesbian households. Finally, sexual minorities are less likely to be homeowners than are heterosexuals. In the aggregate, only one in two sexual minorities report owning a home compared with more than seven in ten heterosexuals. The results disaggregated by sexual identity show that some sexual minorities are more disadvantaged than others: only 56.9 percent of gay/lesbians, 45.6 percent of bisexuals, and 50.9 percent of other/something else people report owning a home, which stands in contrast to 72.4 percent of heterosexuals. Pairwise comparisons illuminate that bisexual and other/something else populations are less likely to be homeowners than are gay/lesbian people.
What about for family characteristics? The results demonstrate that union status is among the most stratified by sexual identity. Sexual minorities experience significantly different relationship contexts across each category (e.g., married, divorced, widowed). Gay/lesbian and bisexual people are more likely to be never married and to report a cohabiting relationship with a non-married partner than heterosexuals, but they are less likely to report being currently married, divorced, and widowed. About half of gay/lesbians (49.8 percent) and bisexuals (47.4 percent) report having never married compared with only about one-fifth (20.8 percent) of heterosexuals. The within-group differences show significant variation even within the sexual minority group. For example, other/something else people are more likely than gay/lesbian and bisexual populations to report being currently married. When it comes to having residential children, sexual minorities tend to report fewer than heterosexuals. Disaggregating the sexual minority category illuminates that gay/lesbian people are driving this association, as only gay/lesbian people have significantly fewer residential children than heterosexuals. In fact, other/something else people tend to report more residential children, on average, than heterosexuals.
Gender-Stratified Results
Percentages and Means (and Standard Deviations) by Sexual Identity, Stratified by Gender (N = 1,517,827).
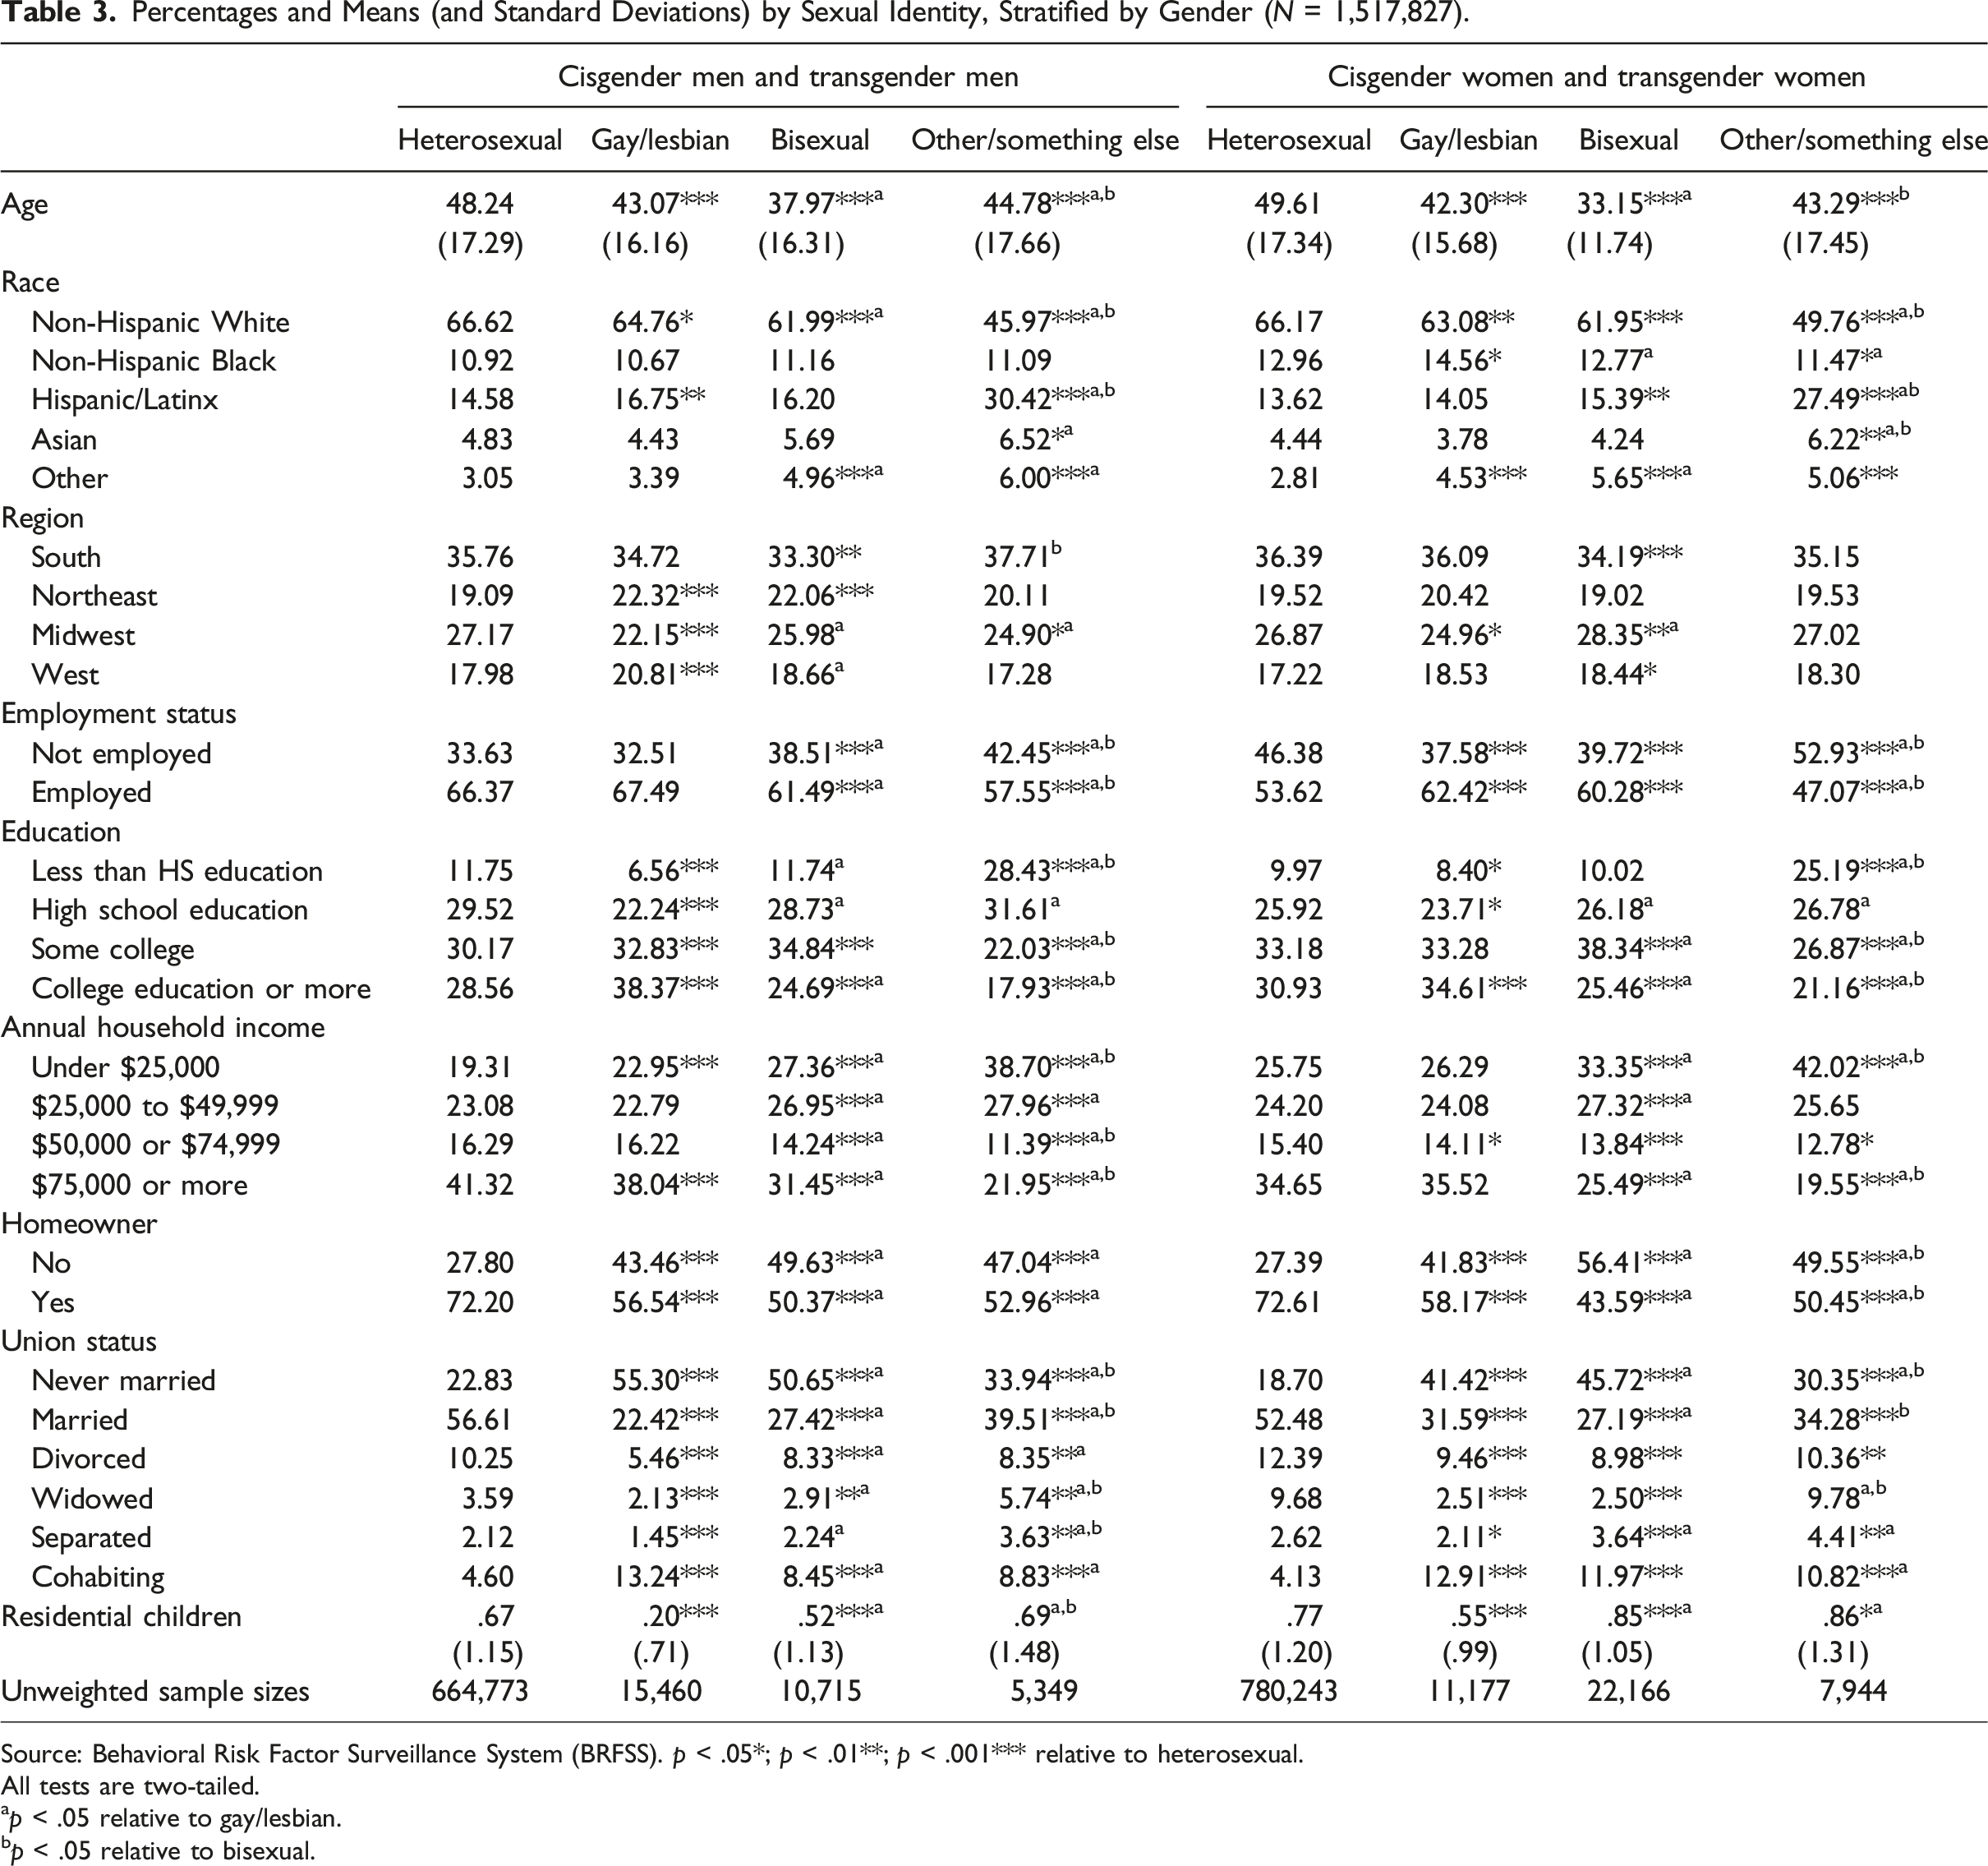
Source: Behavioral Risk Factor Surveillance System (BRFSS). p < .05*; p < .01**; p < .001*** relative to heterosexual.
All tests are two-tailed.
ap < .05 relative to gay/lesbian.
bp < .05 relative to bisexual.
The results examining variation in region by sexuality appear to differ for men and women. Whereas gay/lesbian men are overrepresented in the Northeast and West and underrepresented in the Midwest compared with heterosexual men, gay/lesbian women are only slightly underrepresented in the Midwest. Otherwise, gay/lesbian women have remarkably similar regional profiles as heterosexual women. Bisexual men and women are underrepresented in the South compared with heterosexual men and women, respectively. Like gay/lesbian men, bisexual men disproportionately live in the Northeast compared with heterosexual men. Bisexual women, however, are overrepresented in the Midwest and the West compared with heterosexual women. Other/something else and heterosexual people have similar regional profiles save for one exception: other/something else men are less likely to report living in the Midwest than are heterosexual men.
The results shed interesting light at the intersection of sexuality, gender, and socioeconomic status. For instance, whereas gay/lesbian people overall were more likely to be employed than heterosexuals, this finding appears to be driven by gay/lesbian women. Gay/lesbian men have comparable employment rates compared to heterosexual men. Bisexual men are less likely and bisexual women more likely to be employed than heterosexual men and women, respectively. Other/something else men and women have lower employment rates than heterosexual men and women, respectively. Regarding education, gay/lesbian men report higher educational attainment than heterosexual men and gay/lesbian women report higher educational attainment than heterosexual women, namely regarding a college degree. Bisexual men and women appear to be disadvantaged relative to heterosexual men and women: bisexual men and women are less likely than heterosexual men and women, respectively, to report a college degree or more. Other/something else men and women are disproportionately concentrated among groups with the lowest levels of education. Other/something else men and women are more likely to have less than a high school education and less likely to have a college education relative to heterosexual men and women. Gay/lesbian, bisexual, and other/something else men are underrepresented in households bringing home $75,000 or more annually compared with heterosexual men. The same is true for bisexual and other/something else women relative to heterosexual women, but gay/lesbian women are about as equally likely as heterosexual women to live in a household making $75,000 or more annually. The results for homeownership remain comparable for men and women: gay/lesbian, bisexual, and other/something else men and women are less likely to own a home than heterosexual men and women, respectively.
The results for union status suggest that sexual minorities who are men and women have different family lives than heterosexual men and women. For example, gay/lesbian, bisexual, and other/something else men and women have significantly different union statuses across the board than do heterosexual men and women, respectively. For example, gay/lesbian men and women are more likely to report being never married and less likely to report being married than are heterosexual men and women, respectively. When it came to residential children, the findings reveal interesting disparities between men and women. Although gay/lesbian men and women report fewer residential children than do heterosexual men and women, respectively, the results diverge for bisexuals. Bisexual men report fewer and bisexual women report more residential children than heterosexual men and women, respectively. Moreover, other/something else men report comparable numbers of residential children as do heterosexual men, whereas other/something else women report more residential children than heterosexual women.
Discussion and Conclusion
My study provides important sociodemographic information about sexual minorities and heterosexuals across 44 U.S. states from 2014 to 2022. Drawing on population-level data from the CDC’s BRFSS containing a large sample of sexual minorities, I illuminate considerable heterogeneity in the sociodemographic, socioeconomic, and family lives of heterosexuals, gay/lesbians, bisexuals, and other/something else populations. This descriptive research is critically important to (1) proffer a descriptive profile to better acquaint ourselves with a rapidly growing population in the contemporary United States and shed light on compositional differences between heterosexual and sexual minority groups; (2) illuminate the kinds of characteristics researchers should adjust for in models to minimize omitted variable bias or the possibility of confounding when examining associations between sexuality and numerous outcomes; and (3) provide information about potential explanatory mechanisms underlying well-established findings, like the bisexual health disadvantage (Gorman et al., 2015; Hsieh and Liu 2019; Stacey, Reczek, and Spiker 2022) or the gay/bisexual wage penalty (Badgett 1995; Baumle and Poston 2011; Mize 2016).
Variations in sociodemographic differences by sexuality are consistent with other work and provide important new information. My study confirms the results of past research showing disparities in average ages of sexual minorities and heterosexuals (Gonzales and Henning-Smith 2017; Liu and Reczek 2021). It is worth stating explicitly that age differentials might underlie some other demographic differences, like marital differences. Sexual minorities are more likely to report their sex as female than are heterosexuals (Gates 2011), a finding that might be explained by the greater policing men and masculinity face, circumscribing non-hegemonic ways of existing in the world. However, this aggregate finding obscures the fact that gay/lesbian people are far more likely to be male than heterosexuals. Sexual minorities are disproportionately cisgender women, transgender, and gender nonconforming than are heterosexuals. Prior research has shown that women disproportionately report a sexual minority identity compared with men (Gates 2011). Although we know relatively less about why sexual minorities are disproportionately transgender and gender nonconforming, this finding makes sense in light of theorizing that centers heterosexuality as the interpretive framework through which gender is viewed as in/appropriate (Butler 1990; Ingraham 1994). It is also possible that sexual identity development processes spur other gender-related identity development processes. In any case, this finding invites future research to explore why sexual minorities are disproportionately gender minorities, too.
Given the rise in bisexuality, and that Black women are largely driving this trend (Bridges and Moore 2018), it was surprising not to find larger discrepancies between Black sexual minorities and Black heterosexuals. It would be worth investigating further the large share of other/something else people who identify as Hispanic/Latinx—perhaps extant identity labels captured as response categories on the BRFSS miss out on important identities among this racial group, forcing them to identify sexually in less descriptive ways. As Stone (2018) highlighted, research on sexual minorities has disproportionately focused on cities in the West and Northeast, cities like San Francisco and New York. Perhaps it is not surprising, then, that we know relatively more about gays and lesbians compared with other sexual minorities, who are overrepresented in those parts of the country. Regional differences by sexuality are relatively less pronounced compared with several other outcomes.
The findings for variation in socioeconomic status were interesting and could motivate future research. Heterogeneity in the employment profiles by sexuality indicates that other/something else people are particularly likely to be unemployed compared with heterosexuals. Unlike many other areas of SES, like wages (Mize 2016), bisexuals do not appear to be disadvantaged compared with heterosexuals on this indicator. The results demonstrated that bisexuals were less likely to have completed college (or more) than heterosexuals but had higher rates of some college experience. It might be the case, then, that bisexuals are more likely to enroll in college, but then decide to drop out or not finish pursuing their degree. The gay/lesbian population reports having a college degree or more at greater rates than heterosexuals, a finding true for both gay/lesbian men and women, which might be an artifact of more highly educated sexual minorities disproportionately “coming out” relative to less educated ones (Haltom and Ratcliff 2021; but see Mittleman 2022). Household income was highly stratified by sexuality, and bisexuals and other/something else people appear to be particularly disadvantaged on this dimension. Within-group differences for those two populations compared with gay/lesbian people might be explained by heightened wage penalties and greater discrimination in the labor force that they experience (Mishel 2016; Mize 2016; Tilcsik 2011). That gay/lesbian populations were more likely to be employed than heterosexuals but report lower incomes might mean that they are concentrated in more feminized jobs, which tend to offer fewer financial rewards than masculinized jobs (Antecol, Jong, and Steinberger 2008; Blandford 2003; Ueno et al., 2013).
The results for homeownership raise interesting questions. Sexual minorities might be less likely to be homeowners because of lower household incomes and lower educational attainment, placing the purchasing of a home just out of reach, or it might instead be because sexual minorities are concentrated in areas of the country (e.g., New York City and San Francisco) where renting is the norm and owning a home is much rarer (Levine 2022; Stone 2018). Likewise, because sexual minorities are less likely to be married, a wealth-generating institution (Addo and Lichter 2013), the lower rates of homeownership for sexual minorities compared with heterosexuals might be a consequence of lower rates of marriage. In any case, heterogeneity in homeownership across the sexuality spectrum could signify vast wealth inequality by sexual identity, especially because homeownership is a wealth-building asset across the life course (Killewald and Bryan 2016). Such stratification in SES by sexual identity raises questions that invite future research to examine the mechanisms contributing to such inequality (e.g., discrimination and victimization; Mize 2016; Meyer 2003) and imply that SES might explain some of the well-established sexual minority health disadvantage (Liu and Reczek 2021).
The results for family structure by sexual identity align with prior work (Gonzales and Henning-Smith 2017; Liu and Reczek 2021), which shows that sexual minorities are generally less likely to partake in marriage and have children. However, this research note adds to this critically important work by providing information about less well-studied union statuses, such as widowhood, divorce, and separation. The findings demonstrate that other/something else people are more likely than heterosexuals to be widowed and separated, despite lower average ages for sexual minorities compared with heterosexuals, which should theoretically suppress any differences in widowhood or separation. It is possible that this group is more likely to partner with older individuals (Silva 2023) or that assortative mating with regard to health and SES profiles are elevating rates of widowhood (Maralani and Portier 2021; Schwartz 2013). In any case, future research should explore those interesting puzzles. Sexual minorities are generally more likely to cohabit than are heterosexuals, and this is true for all sexual minority groups, providing important context in an age during which same-sex marriage is legal. Finally, building on past work (Gonzales and Henning-Smith 2017; Stacey and Wislar 2023), this paper demonstrates that it is only gay/lesbian people who have fewer residential children than heterosexuals, illuminating remarkable similarity on this dimension between heterosexuals and bisexuals—although results differ for men and women. Other/something else people appear to partake in marriage at greater rates than other sexual minorities and even report more residential children than heterosexuals. Such findings might imply that other/something else populations might be more family oriented than gay/lesbian and bisexual populations.
My study is limited in a few ways. Most importantly, the BRFSS data are not nationally representative, owing to the selective implementation of the SOGI Module in certain states. Consequently, I cannot provide information about sexual minorities in Alabama, Maine, Nebraska, New Hampshire, Oregon, and South Dakota. If there are systematic differences between the sexual minorities in the states represented and those not represented, my analyses could underestimate differences between sexual minority groups and heterosexuals. Despite this limitation, the BRFSS provides one of the largest samples of sexual minorities, if not the largest. Other limitations are also germane to the SOGI measure. For example, the response categories of the sexual identity measure are relatively limited, prohibiting sociodemographic, socioeconomic, and family information about queer, asexual, pansexual, and other sexual minority groups—individuals who have potentially identified as “other” or “something else.” Other outcomes, like residential children, provide somewhat limited insight into the family lives of Americans, since I cannot assess whether the children are biologically related or adopted, or stepchildren from a partner’s prior union. It would also be fruitful to know the sex/gender of the spouse of the respondent, information that is typically only available in household rosters and which could shed light on respondents’ sexual identity and union status.
This research provides an updated data portrait of a rapidly growing population in the United States and is an important analytic endeavor to describe sexual minorities as they exist today. Data portraits provide insight into compositional differences along sociodemographic, socioeconomic, and family characteristics among sexual minority and heterosexual groups; allow researchers to better justify the characteristics they adjust for in regression-based estimates of health and other disparities in order to avoid omitted variable bias or the harmful consequences of confounding; and clue researchers into the types of characteristics that are likely influenced by sexuality (e.g., socioeconomic status and family characteristics) and which could influence health and other elements of well-being, highlighting explanatory mechanisms in relationships of interest to many sociologists and demographers. Descriptive research is important research because it allows us to contextualize the populations we study and make better sense of the adjusted regression-based and causal findings revered in the discipline. Considering the benefits of descriptive research, I encourage future research to continue to shed descriptive light on under-researched and marginalized populations and to investigate otherwise obscured variation within and between demographic groups.
Footnotes
Acknowledgments
I would like to thank Rachel Dwyer, Natasha Quadlin, Rin Reczek, and Kristi Williams for providing helpful feedback at very important stages. The reviewers and editors helped me strengthen this research, and I appreciate their insightful comments. I also wish to acknowledge funding from the Eunice Kennedy Shriver National Institute of Child Health and Human Development at the National Institutes of Health (grant/award P2CHD058484).
Declaration of Conflicting Interests
The author(s) declared no potential conflicts of interest with respect to the research, authorship, and/or publication of this article.
Funding
The author(s) disclosed receipt of the following financial support for the research, authorship, and/or publication of this article: National Institutes of Health (grant/award P2CHD058484).
Notes
Appendix
State samples using sexual orientation and gender identity modules in BRFSS, 2014–2022.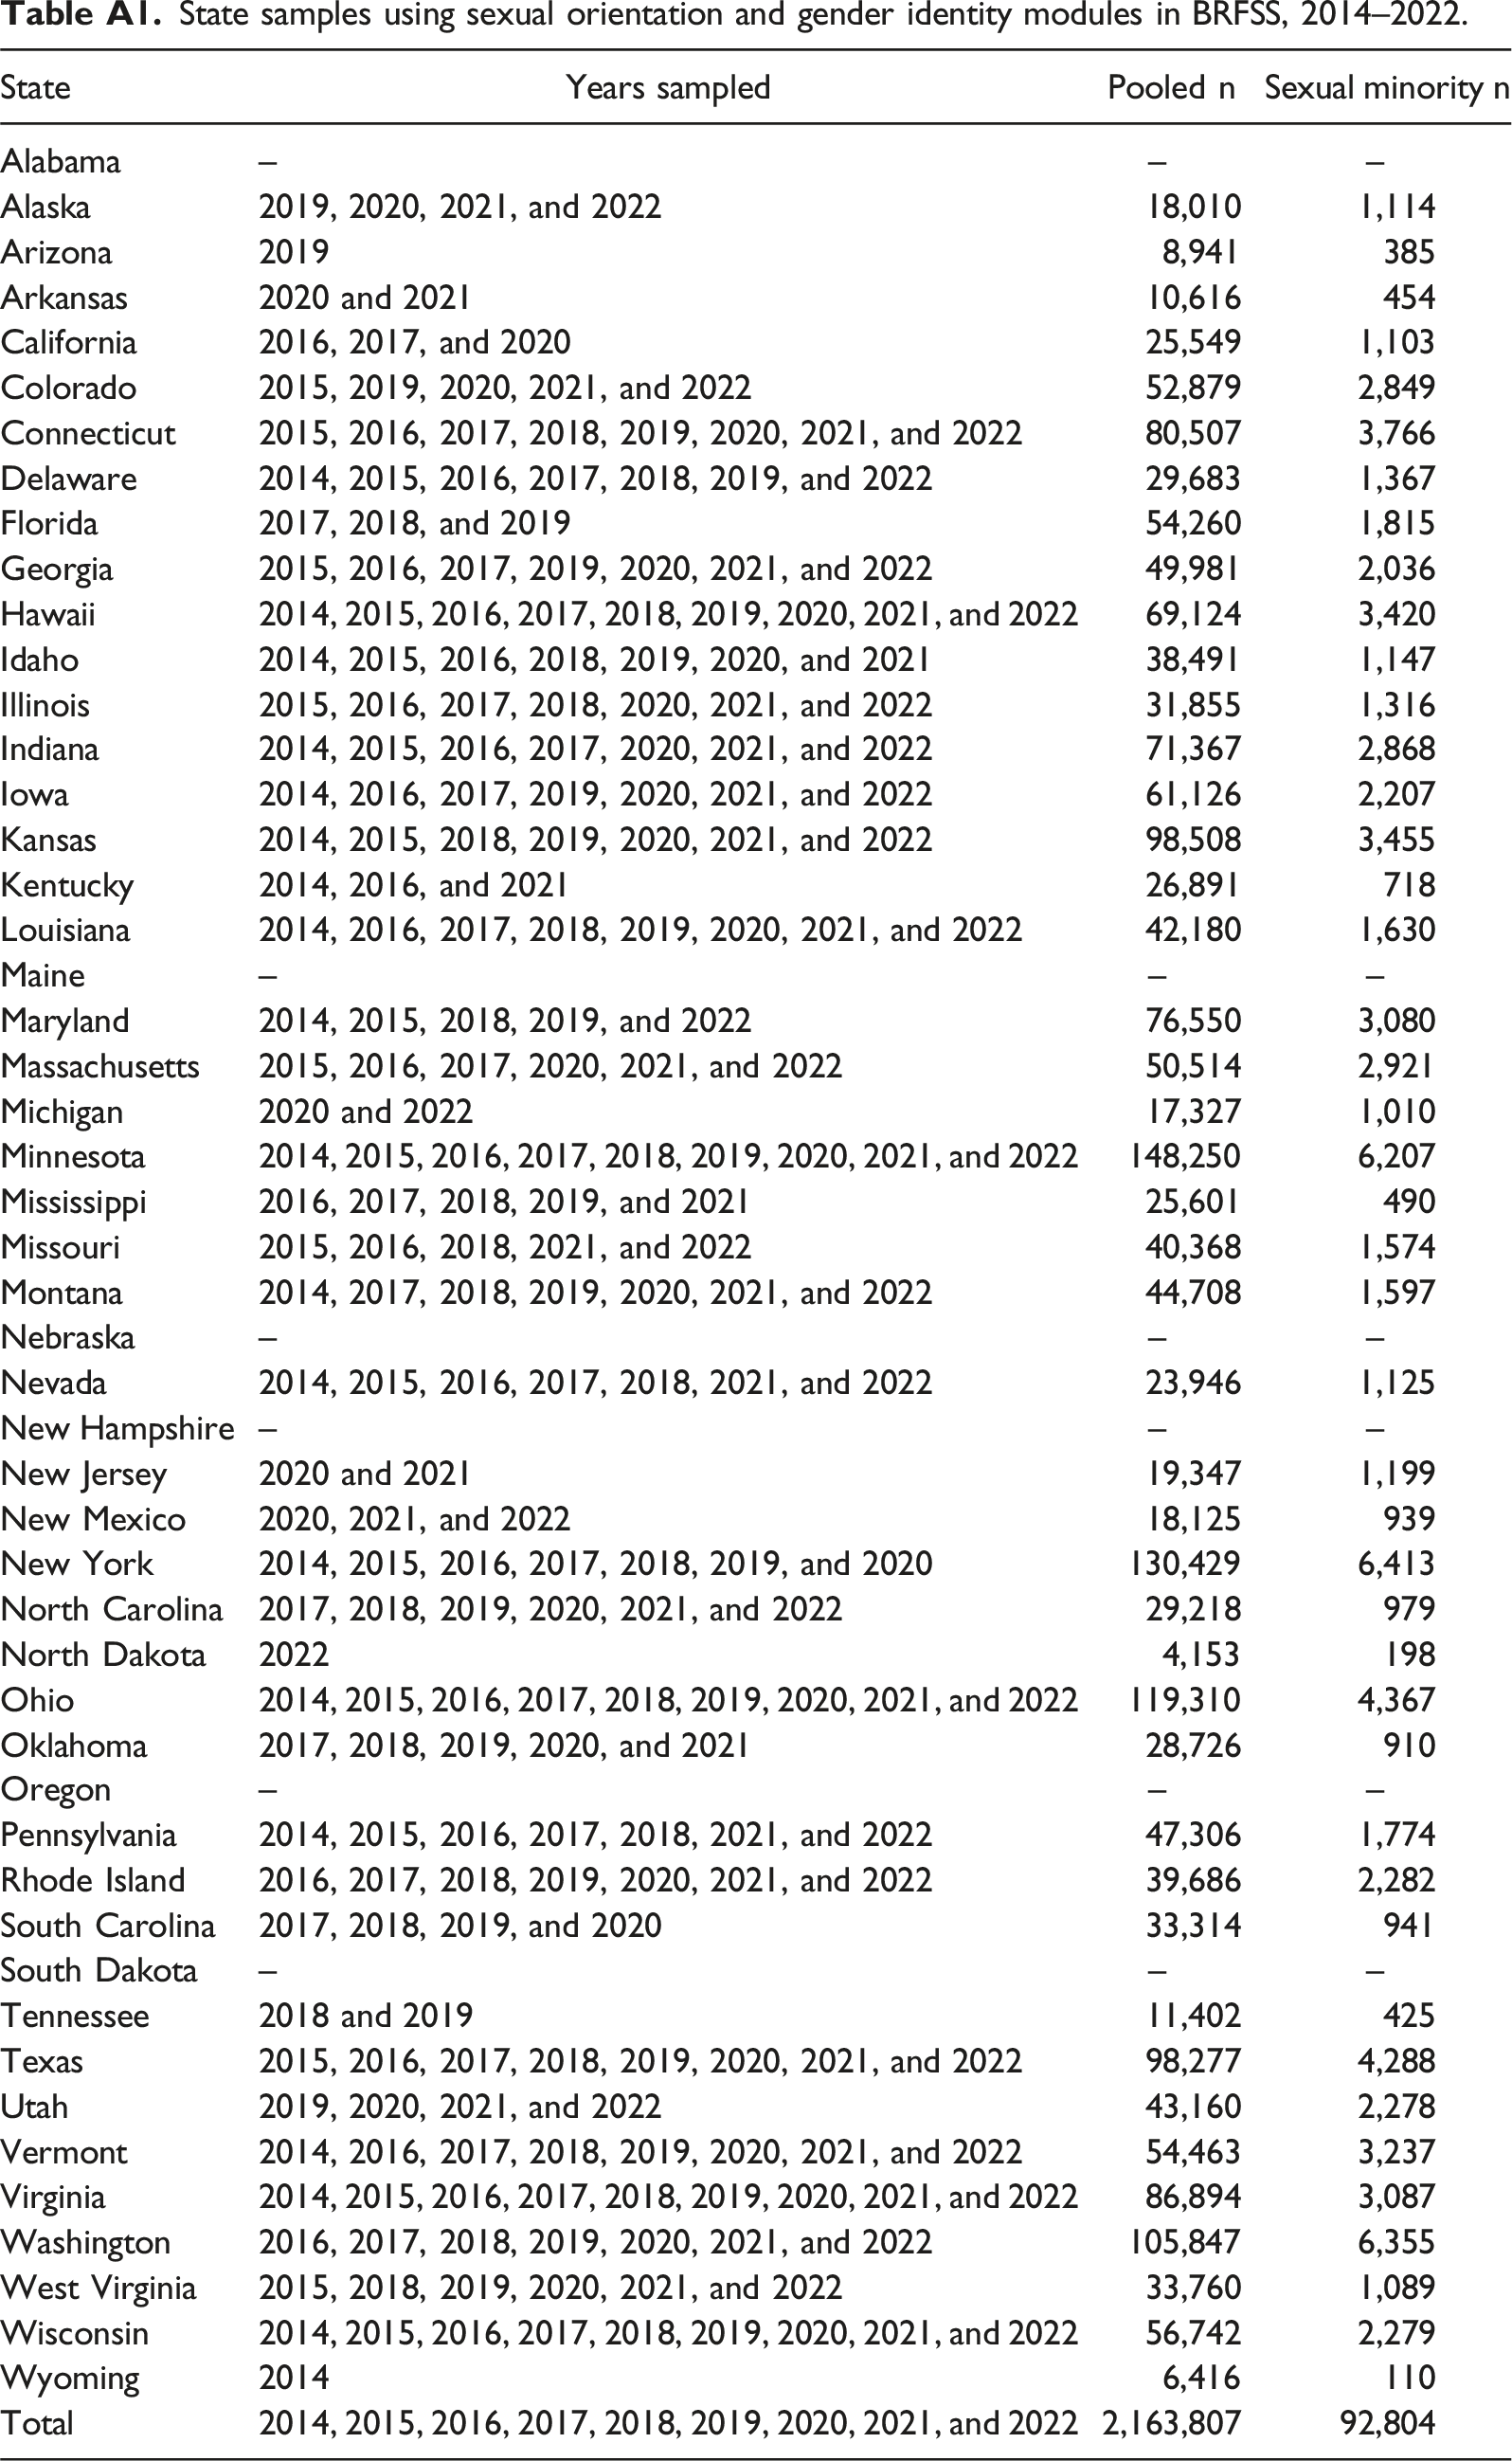
State
Years sampled
Pooled n
Sexual minority n
Alabama
–
–
–
Alaska
2019, 2020, 2021, and 2022
18,010
1,114
Arizona
2019
8,941
385
Arkansas
2020 and 2021
10,616
454
California
2016, 2017, and 2020
25,549
1,103
Colorado
2015, 2019, 2020, 2021, and 2022
52,879
2,849
Connecticut
2015, 2016, 2017, 2018, 2019, 2020, 2021, and 2022
80,507
3,766
Delaware
2014, 2015, 2016, 2017, 2018, 2019, and 2022
29,683
1,367
Florida
2017, 2018, and 2019
54,260
1,815
Georgia
2015, 2016, 2017, 2019, 2020, 2021, and 2022
49,981
2,036
Hawaii
2014, 2015, 2016, 2017, 2018, 2019, 2020, 2021, and 2022
69,124
3,420
Idaho
2014, 2015, 2016, 2018, 2019, 2020, and 2021
38,491
1,147
Illinois
2015, 2016, 2017, 2018, 2020, 2021, and 2022
31,855
1,316
Indiana
2014, 2015, 2016, 2017, 2020, 2021, and 2022
71,367
2,868
Iowa
2014, 2016, 2017, 2019, 2020, 2021, and 2022
61,126
2,207
Kansas
2014, 2015, 2018, 2019, 2020, 2021, and 2022
98,508
3,455
Kentucky
2014, 2016, and 2021
26,891
718
Louisiana
2014, 2016, 2017, 2018, 2019, 2020, 2021, and 2022
42,180
1,630
Maine
–
–
–
Maryland
2014, 2015, 2018, 2019, and 2022
76,550
3,080
Massachusetts
2015, 2016, 2017, 2020, 2021, and 2022
50,514
2,921
Michigan
2020 and 2022
17,327
1,010
Minnesota
2014, 2015, 2016, 2017, 2018, 2019, 2020, 2021, and 2022
148,250
6,207
Mississippi
2016, 2017, 2018, 2019, and 2021
25,601
490
Missouri
2015, 2016, 2018, 2021, and 2022
40,368
1,574
Montana
2014, 2017, 2018, 2019, 2020, 2021, and 2022
44,708
1,597
Nebraska
–
–
–
Nevada
2014, 2015, 2016, 2017, 2018, 2021, and 2022
23,946
1,125
New Hampshire
–
–
–
New Jersey
2020 and 2021
19,347
1,199
New Mexico
2020, 2021, and 2022
18,125
939
New York
2014, 2015, 2016, 2017, 2018, 2019, and 2020
130,429
6,413
North Carolina
2017, 2018, 2019, 2020, 2021, and 2022
29,218
979
North Dakota
2022
4,153
198
Ohio
2014, 2015, 2016, 2017, 2018, 2019, 2020, 2021, and 2022
119,310
4,367
Oklahoma
2017, 2018, 2019, 2020, and 2021
28,726
910
Oregon
–
–
–
Pennsylvania
2014, 2015, 2016, 2017, 2018, 2021, and 2022
47,306
1,774
Rhode Island
2016, 2017, 2018, 2019, 2020, 2021, and 2022
39,686
2,282
South Carolina
2017, 2018, 2019, and 2020
33,314
941
South Dakota
–
–
–
Tennessee
2018 and 2019
11,402
425
Texas
2015, 2016, 2017, 2018, 2019, 2020, 2021, and 2022
98,277
4,288
Utah
2019, 2020, 2021, and 2022
43,160
2,278
Vermont
2014, 2016, 2017, 2018, 2019, 2020, 2021, and 2022
54,463
3,237
Virginia
2014, 2015, 2016, 2017, 2018, 2019, 2020, 2021, and 2022
86,894
3,087
Washington
2016, 2017, 2018, 2019, 2020, 2021, and 2022
105,847
6,355
West Virginia
2015, 2018, 2019, 2020, 2021, and 2022
33,760
1,089
Wisconsin
2014, 2015, 2016, 2017, 2018, 2019, 2020, 2021, and 2022
56,742
2,279
Wyoming
2014
6,416
110
Total
2014, 2015, 2016, 2017, 2018, 2019, 2020, 2021, and 2022
2,163,807
92,804