
Abstract
Previous research has highlighted the disadvantaged position immigrants often face in the economy, particularly when it comes to labor market outcomes such as employment or earnings. Extending this literature, the present study evaluates the economic exclusion of immigrants, conceptualized not as labor market outcomes but as relative poverty. This study examines the relationship between welfare generosity and immigrant poverty across rich western democracies and compares this relationship with that of native poverty. One publicly held belief is that immigrants disproportionately benefit from welfare generosity, while the literature on welfare chauvinism suggests greater social spending may not necessarily benefit immigrants. Furthermore, the effects may vary by spending and immigrant type. This study uses the Luxembourg Income Study to consider differences in the effects of welfare generosity on the odds an immigrant or native household is poor, how this effect varies by the type of spending, and how the effect changes depending on factors such as region of origin or citizenship status. Using four waves of data circa 2004 to 2014 across 24 upper- and middle-income democracies, the results show some support for welfare chauvinism and advantages to being an intra-EU immigrant and citizen immigrant.
Introduction
Over the last few decades, upper- and middle-income nations have experienced precipitous growth in migration. Relative net migration increased three-fold between 1972 and 2007 (World Bank 2021). The rise in immigration has diversified what have often historically been relatively homogeneous populations (Alesina et al. 2003), creating tensions between immigrants and natives (Semyonov, Raijman, and Gorodzeisky 2006). With this growth in immigration and diversity have come concerns about immigrant cultural, social, and economic incorporation. Such concerns are warranted, as immigrants frequently experience several types of social exclusion. Immigrants often face worse outcomes in the labor market relative to native-born workers and are typically placed in less stable occupations with lower wages (Emmenegger et al. 2012). This is due to a variety of factors like immigrants’ levels of education, language skills, job skills, social capital, structural discrimination, or racism (King and Rueda 2008). As a result, immigrants generally have higher levels of poverty than native populations (Luxembourg Income Study 2021).
These challenges often not only lead to worse economic outcomes, but they also hinder immigrants’ incorporation into society and the economy. Rising inequality and poverty is a trend in many affluent and middle-income countries in recent decades. However, welfare state policies can be effective at reducing income inequality (Doorley, Callan, and Savage 2021) and poverty (Brady 2009), by providing automatic stabilization, or non-market income transfers even when market incomes are disrupted or jobs are lost. Given their disadvantage position in the labor market and society more generally, the welfare state may provide a particularly protective role for immigrants; however, they may be less able to access these benefits than natives. Previous research has considered how these effects may differ but has often used a limited sample (e.g., Blume et al. 2007; Kesler 2015; Morissens and Sainsbury 2005) or only general measures of the welfare state (e.g., Römer 2017). The current literature is less clear how and if spending on specific welfare state policies affects immigrant and native-born residents differently across a range of affluent, industrialized democracies.
In this paper, we evaluate whether strong welfare state policies in upper- and middle-income nations benefit households with immigrant and native-born members similarly by reducing their risk of poverty. Because many immigrants arrive with low levels of education and/or language skills, access to government services, such as language training and housing assistance, may help them avoid poverty. Yet, some immigrant groups likely face welfare state exclusion due to their citizenship status, country of origin, or other characteristics, limiting the effects of the welfare state on poverty. Further, different types of welfare state spending and policies may have varying effects on poverty for households containing immigrants.
Specifically, this study evaluates whether overall social spending, unemployment spending, health spending, spending on active labor market policies (ALMP), and family policy spending reduce the risk of poverty for immigrants and natives similarly, and whether spending on certain policies provides any greater benefits for immigrants over other policies. Using micro-data from the Luxembourg Income Study (LIS) for 24 upper- and middle-income democracies for four waves of data circa 2004 to 2014, we estimate two-way fixed effects logit models on the odds of household relative poverty for a pooled data set containing over 2.23 million households in 86 country-years.
Overall, our analyses suggest that while immigrants in strong welfare states are typically somewhat less likely to be poor than immigrants in weak welfare states, natives experience a much stronger effect of welfare generosity. As a result, as social spending increases, immigrant and native households face quite different probabilities of poverty. This finding gives support for arguments related to welfare chauvinism, which claim greater social spending is often reserved for and restricted to natives. However, the effects vary by immigrant type and spending type.
In what follows, we summarize the main theoretical framework of the paper. First, we provide an overview of the theoretical literature on welfare states and poverty, as well as the role of immigrant status and internal variations within this group. Second, we discuss the data and methods for the paper. We then present the results and outline our conclusions.
Poverty, the Welfare State, and Immigration
While immigrant incorporation has many facets and attributes, this paper is centered on poverty. Unlike labor market outcomes, such as wages or employment, poverty considers exclusion and deprivation, not just attainment. Poverty is associated with social exclusion: marginalization or isolation from the community (Silver 1994). Without the ability to participate in society economically, it is unlikely immigrants will be incorporated socially. Similarly, poverty acts as a measure of deprivation: the inability to participate in society (Sen 1999). While, certainly, labor market attachment and wages provide a means of social inclusion and ability to participate in society, measures of poverty provide greater insight into whether immigrants are likely to experience social inclusion. It is possible an immigrant could be employed but still excluded from participating in large sections of the economy and society due to their low wages or low-status job, especially since the immigrant population is often bifurcated between high and low skilled workers (Portes and Rumbaut 2006). Furthermore, unlike labor market outcomes, poverty can examine economic conditions in households, not just individuals. This is because poverty assesses an individual’s access to financial resources as well as the pooling of risk and resources within the household. Finally, unlike labor market outcomes, poverty can gauge the economic position of individuals who may not be able to participate in the workforce, such as children, retired, or disabled people.
When it comes to shaping poverty and mobility in a society, the welfare state has been shown to reduce poverty among the overall population (Brady 2009), single mothers (Misra, Moller, and Budig 2007), women (Huber et al. 2009), the employed (Brady, Fullerton, and Cross 2010), and children (Heuveline and Weinshenker 2008). While much of the work on the welfare state and poverty has focused on the overall population, and particular at-risk groups, immigrants have been less central to this research. Despite the disadvantaged position of immigrants in the labor force (Demireva and Kesler 2011; Fullin 2011; Kogan 2011; Laganà 2011), the generosity of social programs and policies could counter these negative economic outcomes and provide economic inclusion comparable to native-born households. Building on this expectation of similar effects, we pose our first hypothesis.
Social spending will reduce the probability of poverty similarly for immigrant and native households. The evidence supporting the relationship between the welfare state and poverty has been strong and convincing. However, there is also reason to believe that the welfare state may not benefit immigrants in the same way it benefits other demographic populations, including native populations. In fact, some research has shown generous welfare states to be detrimental to the incorporation of immigrants. For example, Ruud Koopmans (2010) finds that immigrants in countries with generous benefits may still have difficulty integrating, experiencing low labor market participation, high levels of segregation, and overrepresentation among those convicted of crimes. By providing strong benefits and placing less emphasis on integration into the labor market, high levels of dependence on public assistance among immigrants could potentially develop. Another reason immigrants may not see the same effects as natives from stronger welfare states connects to the idea of welfare chauvinism. According to this theory, native populations respond to immigration by increasing social spending. However, this increased spending is limited to provisions for native populations (Careja and Harris 2022). As a result, greater social spending may have a weaker effect on immigrant populations. For these reasons, our second hypothesis states:
Social spending will reduce the probability of poverty for natives more than immigrant households. In contrast to the previous hypothesis, it is also plausible immigrants will have a more substantial reduction of their probabilities of poverty than natives with greater social welfare generosity. Due to their often-disadvantaged position economically and in the labor market relative to natives, immigrants may have more to gain when social spending is greater, experiencing an especially protective effect. Furthermore, previous research has highlighted a connection between greater welfare generosity and greater targeting (Brady and Bostic 2015), meaning that larger welfare states focus some of their greater spending on particular groups. If targeted groups include those most at risk of poverty, immigrants should see a larger reduction in poverty than natives with greater spending. Moreover, this reasoning is further supported by research that counters claims related to welfare chauvinism, finding generous welfare states are more likely to grant immigrants access to welfare benefits (Römer 2017). Therefore, with greater social spending, immigrants may experience greater reductions in their odds of poverty than natives. This claim informs our third hypothesis:
Social spending will reduce the probability of poverty for immigrants more than native households. Thus far, however, these hypotheses have been very general, treating all immigrants and all social spending the same. Yet one important gap in the literature on welfare states and poverty is the need to examine differential effects by spending type. Particularly, prior research has called attention to the inability of the traditional welfare state to protect from new social risks (Esping-Andersen 1999; Huber and Stephens 2006). Given their frequent position as an “outsider” (Rueda 2005, 2014), the effectiveness of the traditional welfare state for immigrants relative to natives should also be examined and alternatives must be considered. For example, traditional welfare benefits are connected to labor force participation and serve as a replacement for work in the event of illness, job loss, or retirement (Huber and Stephens 2006). Likewise, benefit generosity and allocation are sometimes tied to the level and length of labor force participation (Esping-Andersen 1990). Because immigrants are more likely to experience unemployment (OECD 2021), precarious employment, and employment discrimination (Taran 2011), generosity of work-dependent benefits, such as unemployment relief, are likely to provide better protection for natives than immigrants. Yet policies to encourage labor market participation, retrain for better labor market placement, and/or temporarily substitute for lack of labor force participation irrespective of prior labor force participation, such as active labor market programs, may be able to better address the unique risks faced by immigrants. On the other hand, health and family policies are often provided to all and are less likely to be connected to income or employment. Especially as immigrant families are often larger than native families (Sainsbury 2012), family policy spending or health spending may be disproportionately beneficial for immigrants. For example, in a comparison of two generous welfare states, Sweden and Denmark, the structure of family benefits plays a key role in immigrant poverty differences (Blume et al. 2007). Another possibility is that welfare chauvinism is more prevalent for some policies than others. Tina Goldschmidt (2015) finds old-age and sickness assistance does not respond to out-group sentiment but unemployment insurance does. She further concludes that means-tested benefits are less popular than universal benefits, particularly among those who demonstrate some ethnic prejudice. Therefore, our fourth hypothesis is:
Social spending benefits typically tied to work or restricted by immigrant status should reduce poverty for immigrants less than natives, while more universal benefits should benefit them approximately as much as natives. Finally, up until now, our discussion has largely treated immigrants as a monolithic group. However, that is not the case. Immigrants come from increasingly varied backgrounds and are prompted to migrate by differing motivations. Much attention has been given to growing non-Western, non-Christian immigrant populations, who are less likely to receive a warm welcome (Bansak, Hainmueller, and Hangartner 2016; Dahl and Krog 2018). Similarly, the expansion of the European Union (EU) has opened borders between Eastern and Western Europe, resulting in many Eastern Europeans moving West for economic opportunities (Windzio, Teney, and Lenkewitz 2021). Beyond variations in demographic characteristics, country of origin, citizenship status, and the immigrant composition of households are all likely to create differential effects. Each factor may change the influence of the welfare state on poverty. After all, a major challenge for immigrants is likely to be access. For example, in the U.S., only naturalized immigrants are eligible for non-contributory benefits, with the exception of refugees (Sainsbury 2006). Similarly, in Germany, long-term use of social assistance by immigrants can lead to their removal and denial of any citizenship applications (Diehl and Blohm 2003:142–43). Another obstacle to receiving benefits is navigating the welfare bureaucracy and overcoming the language barrier (Barrett and McCarthy 2008; Koehn 2009). Likewise, considering the racialized nature of welfare distribution in the U.S. in which minorities (Latinx and Black) often receive heavier welfare sanctions (Schram et al. 2009) and prejudice against non-Western immigrants in Europe (Fietkau and Hansen 2018), non-Western immigrants may receive fewer benefits, as well as households containing no native residents. Further, particularly within EU countries, intra-EU immigrants and non-EU immigrants are likely to have different experiences with the welfare state. Not only due to their Western identity, but also due to access. Intra-EU migrants generally receive the same social benefits as natives. As a result, they should have a relationship between social spending and poverty similar to natives, while non-EU immigrants may see a weaker effect. This is supported by previous research confirming a non-EU penalty, relative to EU immigrants (Lelkes and Zólyomi 2011). Similarly, citizenship status is also likely to play a role in benefits access and, as a result, the effects of social spending on poverty. In their article examining the racial/ethnic dimension of immigrant social rights, Ann Morissens and Diane Sainsbury (2005) find the role of citizenship in accessing the welfare state to be central to variations in poverty among residents, with non-citizen households having higher rates of poverty than citizen households, especially ethnic minority, non-citizen households. This provides the basis for our final two hypotheses:
Intra-EU and Non-EU immigrant households will be differentially affected by greater social spending, relative to native households. The poverty reduction effects of social spending for intra-EU immigrant households will be similar to natives, whereas the poverty reduction effects for non-EU immigrants will be weaker.
Citizen and Non-citizen immigrant households will be differentially affected by greater social spending, relative to native households. The poverty reduction effects of social spending for citizen households will be similar to natives, whereas the poverty reduction effects for non-citizen will be weaker.
Data and Methods
Dataset Description
The primary unit of analysis is the household. The household-level data in the analyses come from the Luxembourg Income Study (LIS). The LIS is an archival dataset that includes micro-data on income and other income-related measures, such as taxes paid and transfers received, in several dozen countries from the mid-1960s until 2020. The data is nationally representative and includes information on both households and individuals within these households. A major strength of the LIS is its harmonization process. Rather than constructing original surveys, the LIS uses data collected by national statistical bureaus, standardizes many of the variables, adds normalized weights and harmonizes the data to facilitate cross-national comparisons. For example, the LIS takes the U.S. Current Population Survey, recodes the data and creates normalized weights. This harmonized version is comparable to similar datasets from different countries and years, using consistent variable names and, often, coding practices. For this reason, the LIS is one of the best data sources when comparing incomes across countries in the Organization for Economic Co-operation and Development (OECD).
We conduct original analyses with a four-wave dataset with 24 upper- and middle-income democracies around 2004, 2007, 2010, and 2013. These countries are high- or middle-income economies (World Bank 2021), have been democracies for 15 years or more, and have mature welfare states (Cerami 2006; Huber and Stephens 2001, 2012). Many, but not all, have strong histories of immigration, providing a source of variation. Geographically, most are Western European or Anglo-Saxon. However, to provide greater generalizability, our sample also includes data from South America and former Soviet countries. Such a sample means that the countries included in the analyses are similar enough to be comparable, but not so similar as to limit generalizability or variation. We include a table in Supplemental Appendix A listing the countries in our study, along with years of coverage, average percent immigrant household, average percent mixed-status household, and average poverty rate. To ensure no country is driving or biasing our results, we conduct jackknife analyses, excluding each country in turn, which indicate that our results are robust.
While there are additional countries available in the LIS that fit with our sampling strategy, these countries do not have sufficient data on immigrant status. For example, the Finnish data only include a Finnish/Swedish/Missing ethnicity variable, and no immigration data. Japan includes no data on immigration or ethnicity. Regarding data availability of the included countries, not all countries have data for all waves, but no wave has fewer than 20 countries. To ensure no single wave is driving our results, we also perform jackknife analyses excluding one wave at a time and find our results to be robust.
Central to our analyses is the LIS variable identifying the immigrant status of respondents, immigr, a binary variable that classifies someone as an immigrant if the country in which they answered the survey is their usual residence and: (1) the data provider identifies the respondent as an immigrant, (2) the respondent self-identifies themselves as an immigrant, (3) the respondent is a citizen/national of another country, or (4) where born in another country (LIS 2019). While this is not a detailed measure of immigrant status, it allows for the greatest comparability across countries and for the maximum number of countries to be included in the analyses. Furthermore, previous work using LIS data has measured immigrant status similarly (Budig and Misra 2010; Crettaz 2011; Kabrelyan 2000). We also conduct analyses with more detailed measures of immigrant characteristics, such as whether they are inter-EU migrants or whether they are citizens. Other characteristics such as years of residence, ethnicity, or country of birth suffer from limited availability and issues of comparability as these effects, particularly the latter, likely have different meanings in different contexts.
Because income is pooled within households, we conduct our analyses at the household-level. We identify a household as a native household (Native HH) if everyone in the household is a native resident, based on their identification in the LIS data. Likewise, we identify a household as an immigrant household (Immigrant HH) if everyone in the household is an immigrant. We also identify mixed households (Mixed HH) that contain both individuals identified by the LIS as immigrant and native. For simplicity, because mixed households often reflect native households, we include mixed households with natives in our main analysis but provide supplemental analyses in Supplemental Appendix B, and throughout the appendices, that keep this group separate. Such an approach follows previous literature that focuses on immigrant households, rather than immigrant people (Morissens and Sainsbury 2005), and acknowledges the possibility of differing effects of mixed status households (Kesler 2015).
We categorize households similarly for EU/Non-EU immigrant households and citizen/non-citizen immigrant households and combinations of these statuses. For example, in our first subsequent analysis, we divide immigrants in EU countries into EU-immigrants and non-EU immigrants. As a result, households contain only natives (Native HH), only EU-immigrants (EU HH), natives and EU Immigrants (Native/EU HH), only non-EU immigrants (non-EU HH), natives and non-EU immigrants, (Native/Non-EU HH), EU and Non-EU immigrants (EU/Non-EU HH), or a combination of all three (Native/EU/Non-EU HH), producing a total of seven possible household combinations. Such an approach provides a full picture of variation among immigrants as it relates to acculturation, discrimination/cultural outsiders, and benefit entitlement within their households.
To address the representativeness of immigrants in the LIS data, previous researchers (Anastossova and Paligorova 2006) compared the proportion of foreign-born respondents in the LIS with population census data (Eurostat) and found the two data sources to be quite similar. While it is not possible to identify undocumented or unauthorized immigrants in the data, the data should include these individuals (Smeeding et al. 2012). For example, in the United States, the Current Population Survey—the source of the U.S. LIS data—states that it is representative of all residents and is likely to include undocumented immigrants (U.S. Bureau of Labor Statistics 2021). In fact, most countries collect data through random sampling of all households (Förster 1994). Though some, like Iceland, which samples from its national register, would not include all undocumented residents (LIS 2019).
The analyses combine data from 24 countries, using both the household and the individual files to create a master dataset containing over 2.23 million households: 124,336 immigrant households. Observations are quite large for some countries and at least adequate for every country. The number of immigrant households, for example, ranges from only 15 in Slovakia in 2010 to 22,159 in Norway in 2013. These variations can reflect the size of the immigrant population in a country or variation in the size of the overall sample. To account for differing total sample sizes across country-years, we employ the LIS normalized household weight (hwgt). This is a household-level cross-sectional weight that inflates the data so that it is nationally representative and normalizes the number of households to 10,000 per country to ensure each country has the same weight in the data. Therefore, households within country-years are nationally representative and cross-nationally each country is given the same weight in the analyses.
Dependent Variable
The primary dependent variable is poverty. Following many cross-national poverty studies, we use a relative headcount measure of poverty (Brady 2003; Moller et al. 2003; Rainwater and Smeeding 2003; Smeeding 2006). To adjust household income for family size, following the International Labour Organization (ILO) convention adopted by the LIS, we divide the LIS standardized household disposable income by the square root of household size. Each country’s poverty line is calculated as a certain percentage of that country’s median equivalized income, after taxes and transfers. 1 Households that fall below this line are considered poor (poor = 1; non-poor = 0). We utilize a 50% median income threshold in our main results but also test a 60% threshold, presented in Supplemental Appendix C, with robust results.
Control Variables
The analyses include additional demographic controls to account for various aspects of household composition likely to influence the dependent variable poverty. Measures of education reflect the education level of the lead earner in the household. Hence, everyone in the household is assigned the education level of the lead earner. 2 We use the lead earner’s education rather than the designated household head for two reasons. The first is to ensure comparability across country-years. The household head variable in the LIS is derived from the original data provider. Yet, each data provider assigns the designated household head in varying ways such as self-assigned, the person with the highest income, the person responsible for accommodation, etc. (METIS: relation). Second, as the lead earner in the household, this individual’s education best represents the family’s risk of poverty and given high levels of homogamy (Rosenfeld 2008) should reflect the general level of education in the household. Previous research using the LIS has also taken this approach of using the lead earner’s characteristics rather than the designated head to measure household characteristics (Brady, Baker, and Finnigan 2013; Brady, Finnigan, and Hübgen 2017; Brady and Bostic 2015).
To ensure comparable measures across countries, we utilize the LIS standardized measures of education for identifying the education level of the lead earner in the household. Following previous research (Misra et al. 2007), we include binary indicators for low education HH and high education HH with medium education serving as the reference group. High education HH includes those who have attained university/tertiary education or more. Medium education includes upper secondary vocational education, and low education HH is less than secondary education.
We include several other measures of household composition. First, we consider the number of earners in the household (HH). We include binary indicators for multiple earners in HH and no earners in HH, with one-earner in the household serving as the reference. We also include demographic measures to control for the age-risk associated with poverty, using the age of the lead earner in the household. We again use the lead earner’s characteristics for both the technical reasons mentioned above, and because this person’s characteristics have the strongest influence on household labor income. Because the effect of age is unlikely to be linear, age of the lead earner is controlled through a series of binary indicators: lead earner age <25, lead earner age 25- 34, lead earner age 55-64, and lead earner age>64 with lead earner aged 35-54 serving as the reference group. We also include two measures for the number of dependents, or those unlikely to contribute significant levels of earnings but possibly receiving benefits, living in a household. These include # of children in HH, the number of children in the household under age 18, and # over 64 in HH, the number of individuals over 64 in the household. Both are measured continuously.
To measure family structure, we include a set of three indicator variables, with married households and single-father households serving as the reference category 3 . Single mom is a binary indicator for whether the household contains an un-partnered woman under 54 and a child under 18. We also include two measures for households composed of single, un-partnered individuals without children. These measures are male head no kids and female head no kids.
Country-Level Data
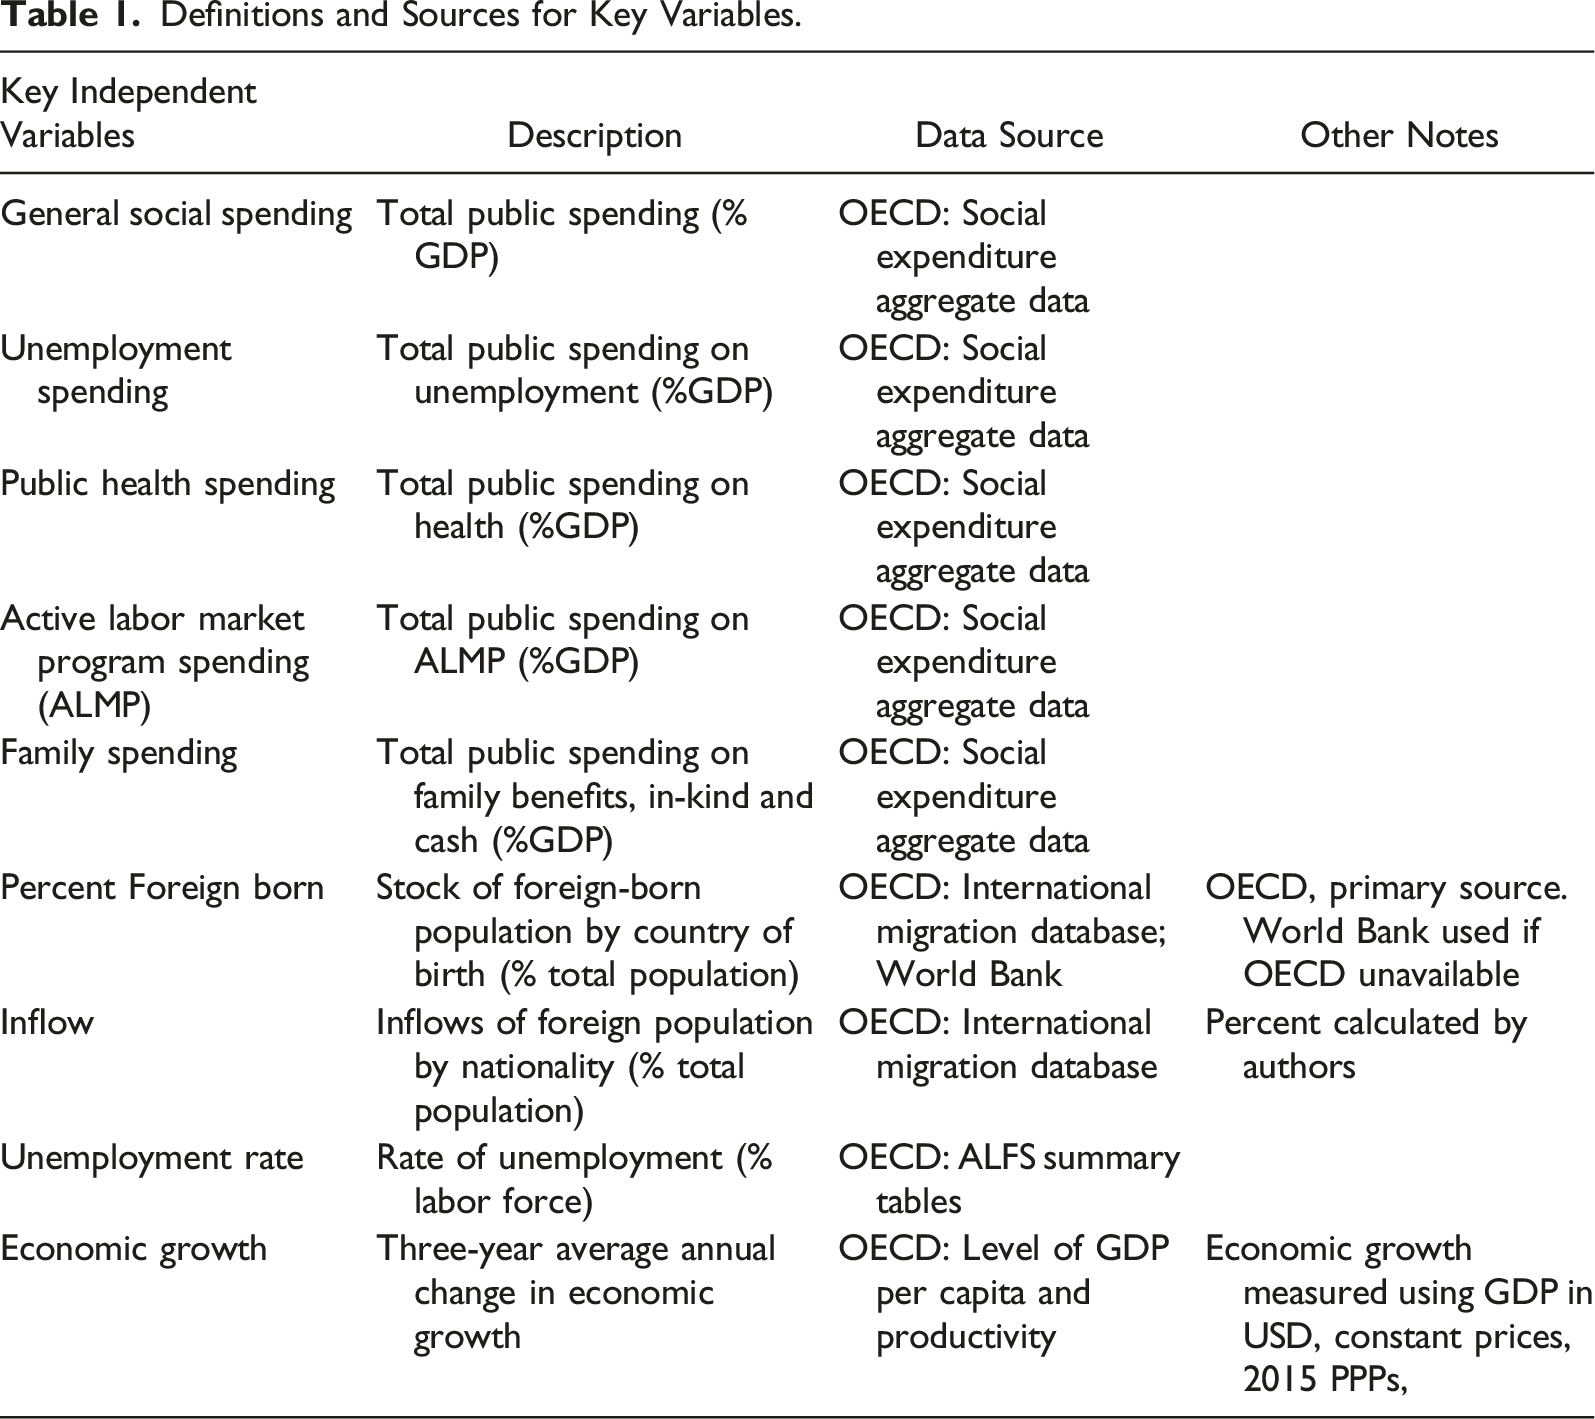
Definitions and Sources for Key Variables.
Welfare State Variables
We include several measures of the welfare state ranging from general measures of overall social spending to spending in more specific policy areas. To standardize the spending measures across countries, all are reported as a percentage of gross domestic product (GDP) in that country-year. The raw data, its availability, and summary statistics can be found in Supplemental Appendix D.
First, we include a general measure of social spending. Social Expenditure is total public social expenditure and represents general welfare or social spending. We also use several specific measures of social spending. Unemployment Spending is measured as public spending on unemployment benefits. Public Health Spending is the total public spending on health. We also have a measure of spending on occupational education and (re)training: total spending on active labor market programs (ALMP Spending). Finally, we measure Family Spending, which includes spending on childcare support, payments for single or lone parents, child allowances and credits, and income support during leave.
Immigration and Economic Control Variables
We include two country-level measures of immigration. The first is the size of the immigrant population, as a percent of the total population (% Foreign Born). The second, Inflow, is the annual number of new immigrants to a country as a percent of the total population. In supplemental analyses (see Supplemental Appendix E), we also control for the percent of the immigrant population that are refugees; our results remain robust. Finally, to control for the economic conditions in a country, we include a measure of the Unemployment Rate as a percent of the labor force and a measure of Economic Growth, calculated as the 3-year average rate of change in GDP.
Two-Way Fixed Effects Modeling Technique
Due to the clustering of households within countries as well as the inclusion of country-level variables, a standard logistic regression is inappropriate due to the violation of the assumption of independent errors. Our analytic approach takes advantage of the multi-wave dataset, which pools LIS data from around 2004, 2007, 2010 and 2014, using two-way fixed effects models with robust-clustered standard errors. These models are logistic regressions with fixed effects for country and year as well as adjusted standard errors to account for the clustering of households within countries
4
. The fixed effects are calculated with a series of dummy variables for wave and country. The equation can be written as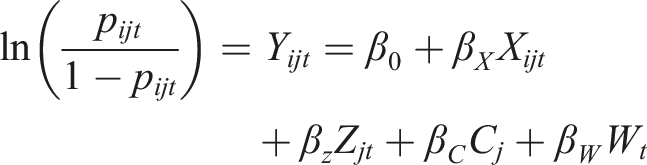
The time variables account for any unmeasured, general, time-specific trends across countries, 5 while the country fixed effects parse out any unobserved, time-stable, within-country effects. This approach allows for an examination of the influence of social spending net of unobserved time and country-effects and accounts for the multi-level structure of the data. While more complex mixed models with simultaneous equations would also seem appropriate for the multi-level structure of the data, the limited number of country-years in our sample, the inclusion of many cross-level interactions, and the need to include several country-level controls make these sorts of models too computationally intensive and statistically conservative. Furthermore, unlike mixed models, our two-way fixed effects approach eliminates most unobserved heterogeneity by looking only at within-country, within-wave variation; this is critical given the different legacies of immigration and welfare regimes in these countries. Likewise, our method provides a major advantage over previous research that has relied solely on a single cross-section or single countries, providing an opportunity for a comprehensive examination of immigrant status, welfare generosity, and poverty.
Results
Descriptive Patterns
Before discussing the two-way fixed effects models, we explore the descriptive patterns in a sample of 23 countries
6
circa 2010, displayed in Figure 1. The year 2010 was chosen due to its inclusion of nearly every country in the sample and because this was a time, just following the Great Recession, when immigrants and natives were both likely to be especially vulnerable to poverty. Figure 1 shows that while there is variation by country, the trend is clear; immigrants, on average, face greater economic disadvantage than natives in most countries; mixed households typically fall somewhere in between. Immigrant, native, and mixed-status poverty by country in 23 rich democracies circa 2010 (source: LIS).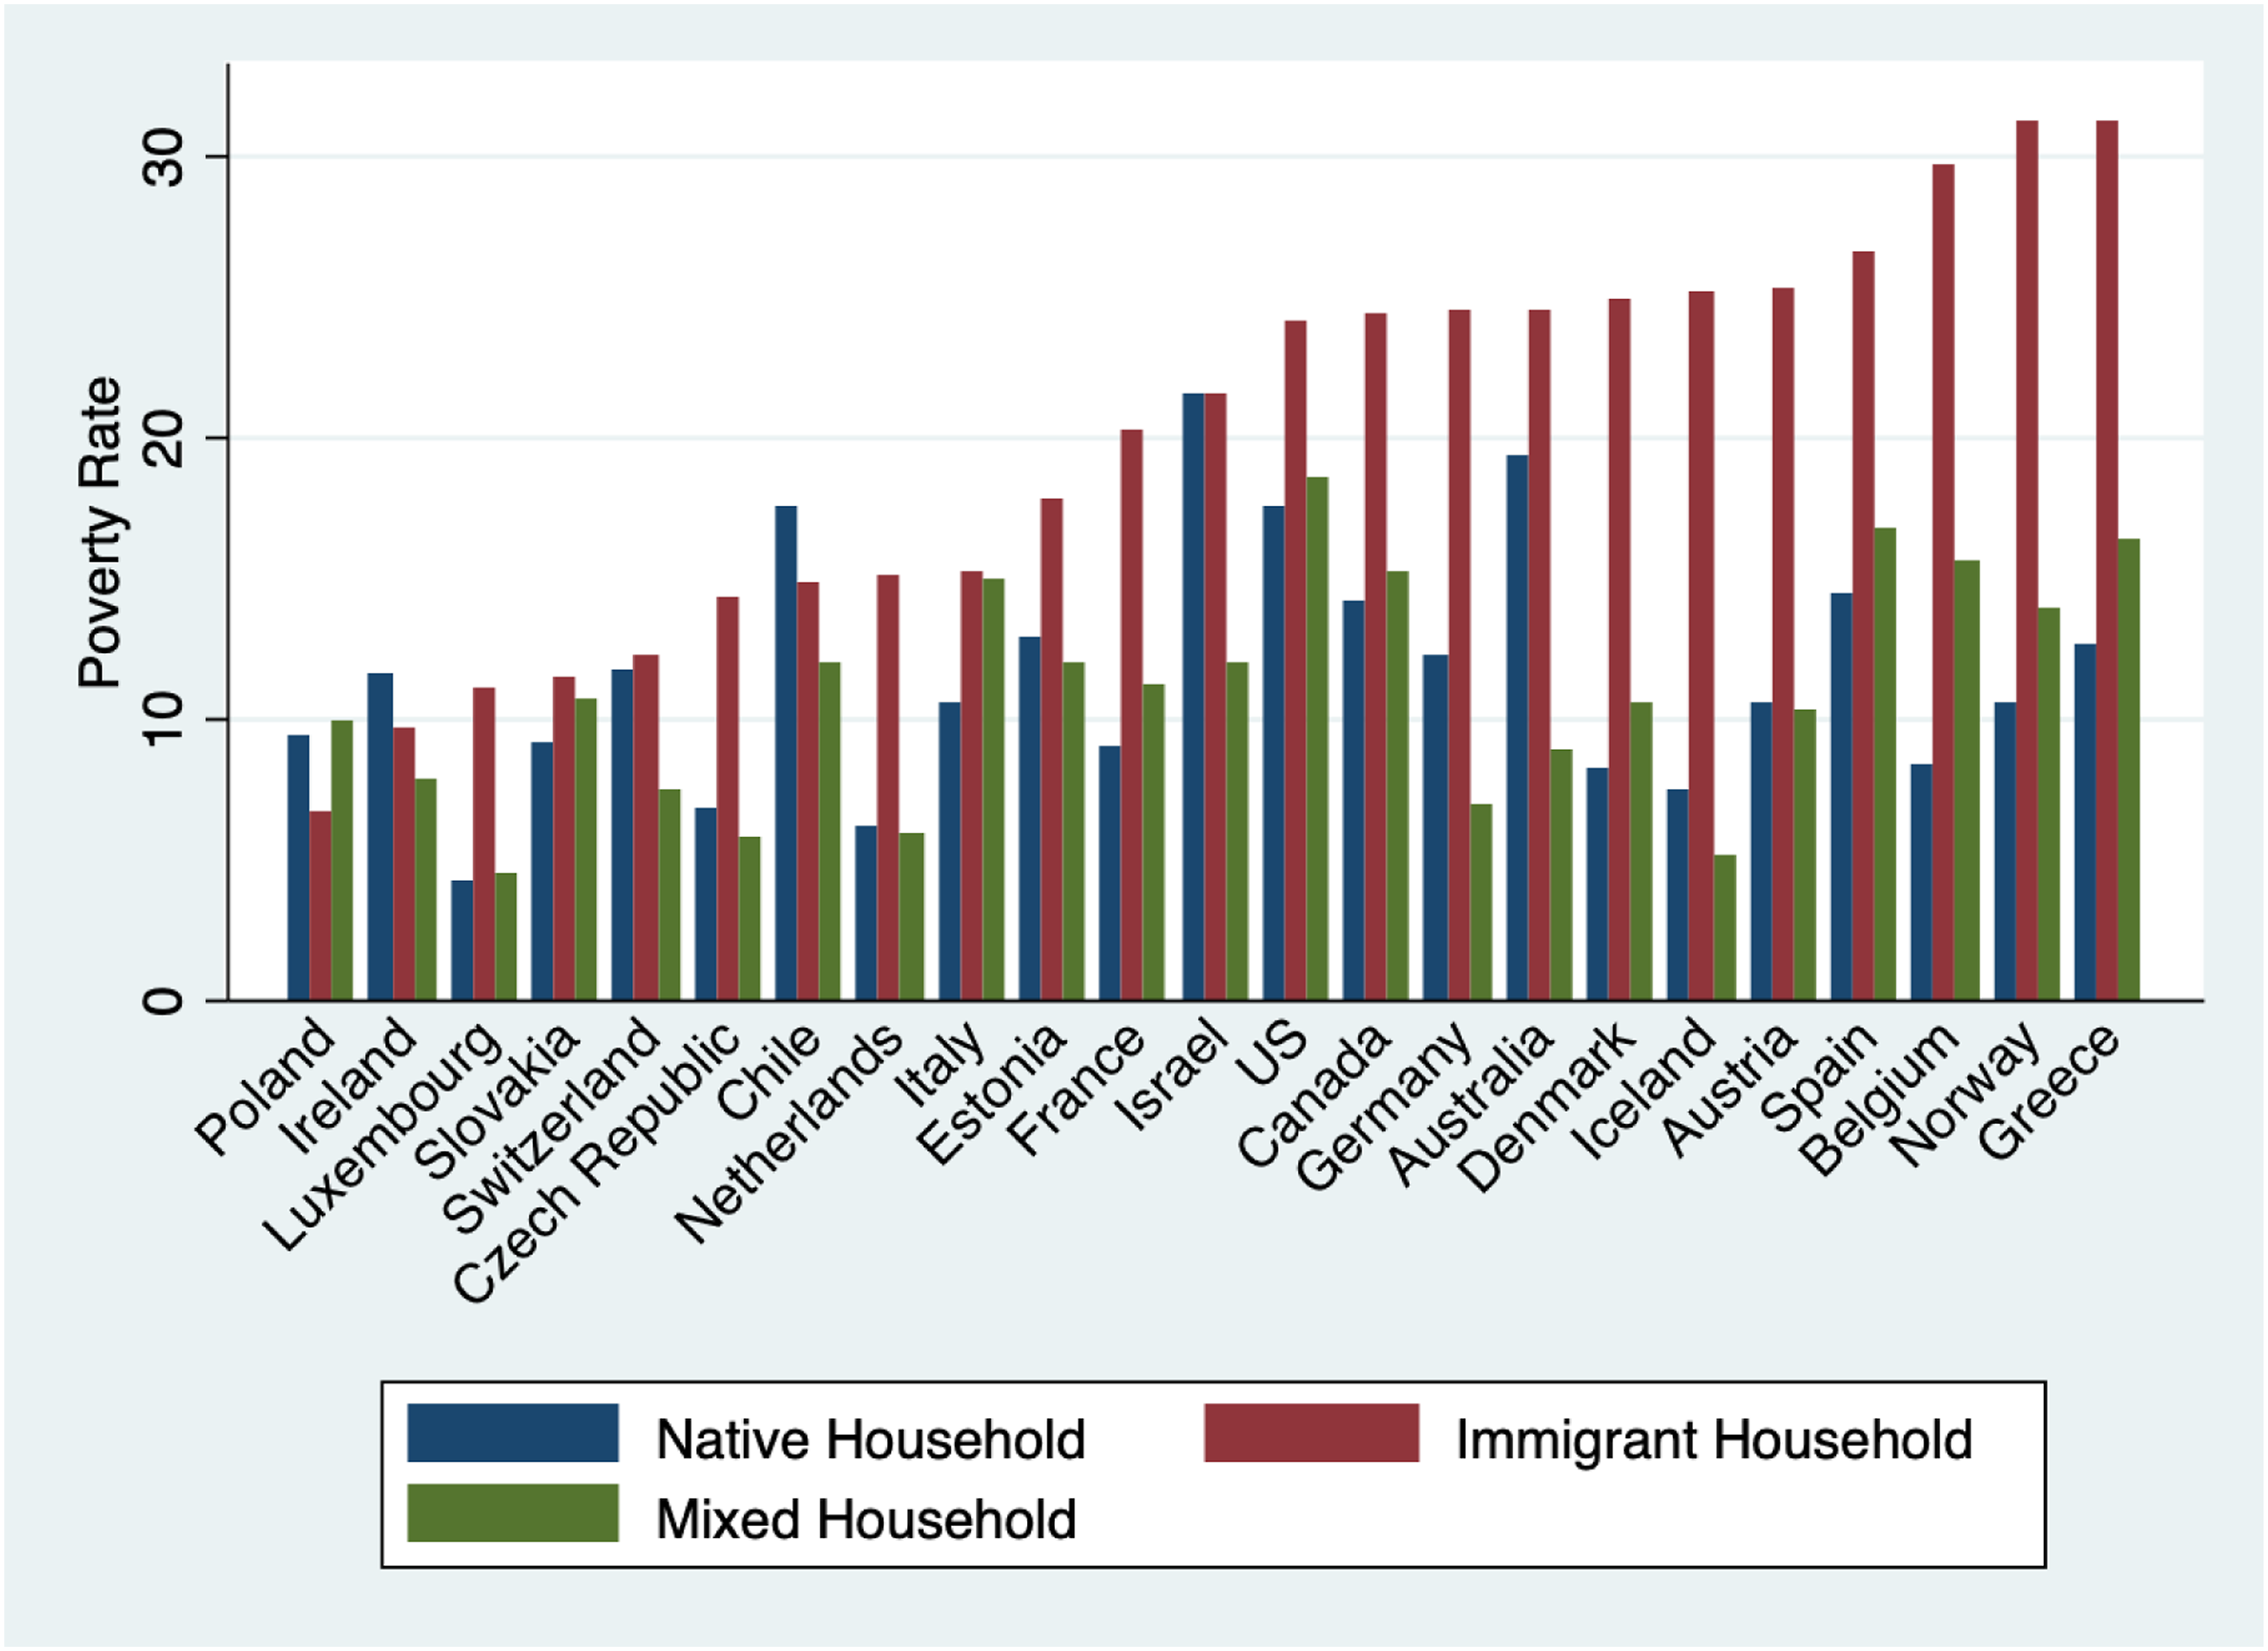
In some countries, there is very little difference in the poverty rates of immigrants and natives. For example, in Israel, immigrant households and native households both have a poverty rate around 21.5%, at 21.49% for native households and 21.55% for immigrant households. In Switzerland, the poverty rate for immigrant households is only about 0.5% higher than native households. In some countries, such as Ireland and Chile, immigrant households have a lower poverty rate than native households, 2% and 3% lower, respectively. On the other hand, and much more commonly, immigrant households experience poverty at a much higher rate than native households. In Norway, around 31% of immigrant households are poor, while only 10.5% of native households are poor. Belgium, Greece, and Iceland also all have poverty rates that are around 20 percentage points higher for immigrant households than natives. Generally, mixed households have poverty rates closer to those of native households, with some exceptions: in Italy mixed households have poverty rates closer to immigrant households, while in other countries such as Germany mixed households fair even better than native households. Certainly, there is considerable variation in the economic outcomes for immigrant households across countries. Part of this can likely be explained by differences in demographic composition of the migrant population; however, another potential explanation is related to welfare generosity, which we begin to explore through bivariate associations.
Figure 2 shows the bivariate relationships between overall social spending and poverty for native, immigrant, and mixed households. Because our later analyses examine change over time within countries, here we present the change in the two variables between the first and last wave of data. When examining the relationship between change in social spending and change in poverty between 2004 and 2014, there is a clear negative relationship (r = −0.53) between change in social spending and the change in percent poor by country for natives. This pattern reflects previous cross-national poverty research. However, this relationship for immigrant households is signed in the opposite direction and even stronger (r = 0.65). For mixed households, the relationship is also positive, though more moderate (r = 0.28). However, these bivariate models do not account for any changes in population composition or other contextual effects, such as unemployment rate or economic growth. The association between change in welfare state generosity and change in poverty rate in 18 affluent democracies 2004–2014 (Source: LIS).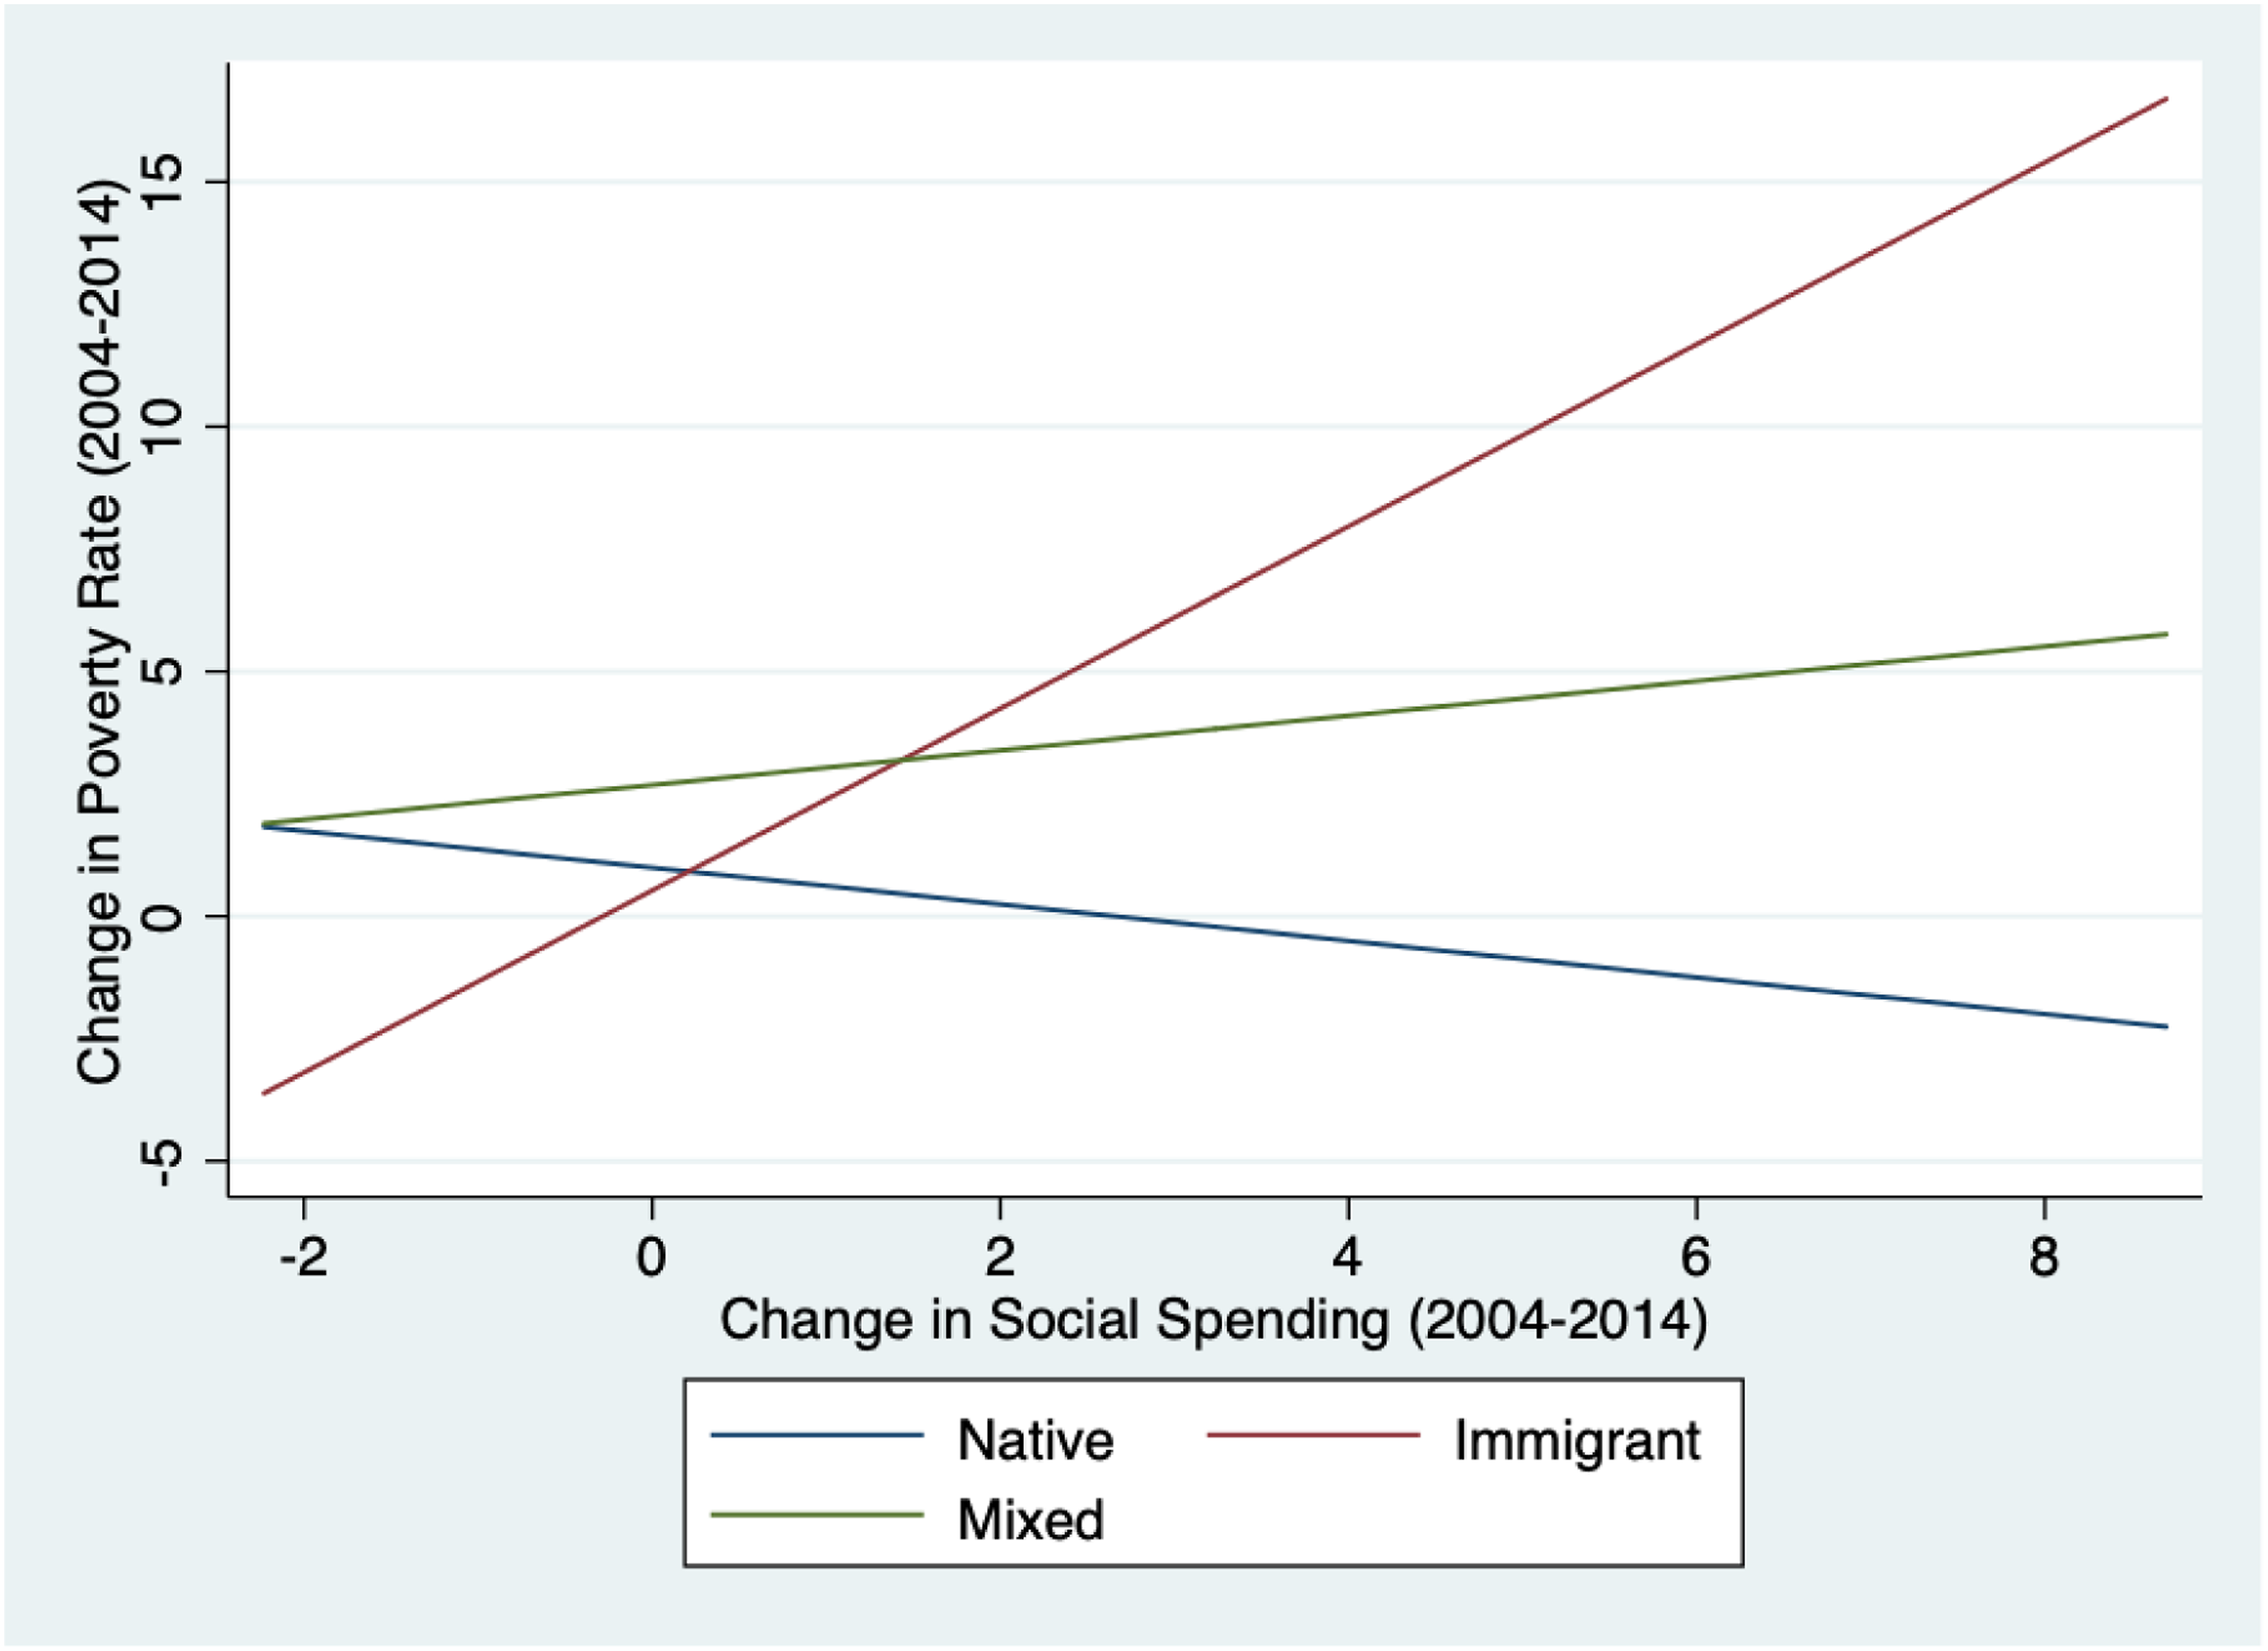
Two-Way Fixed Effects Logit Models
Odds Ratios Two-Way Fixed Effects Base Model (Individual-Level Variables Only) Logistic Regression on Poverty. a
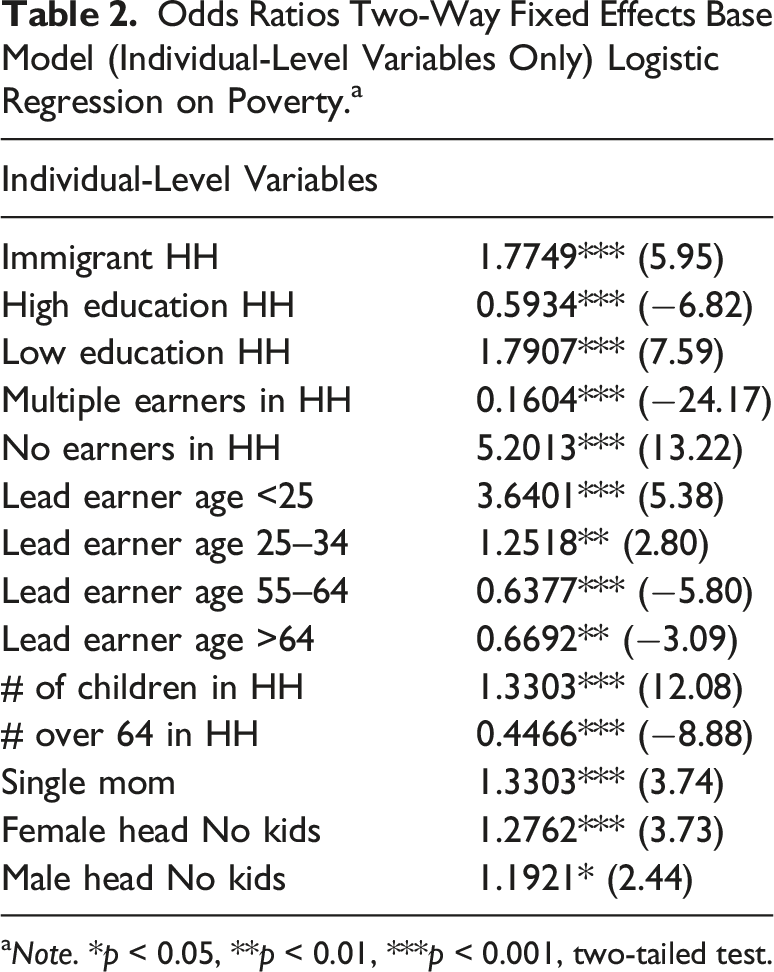
aNote. *p < 0.05, **p < 0.01, ***p < 0.001, two-tailed test.
Odds Ratios From Two-Way Fixed Effects Logistic Regressions Examining the Effects of Social Spending on Poverty. a
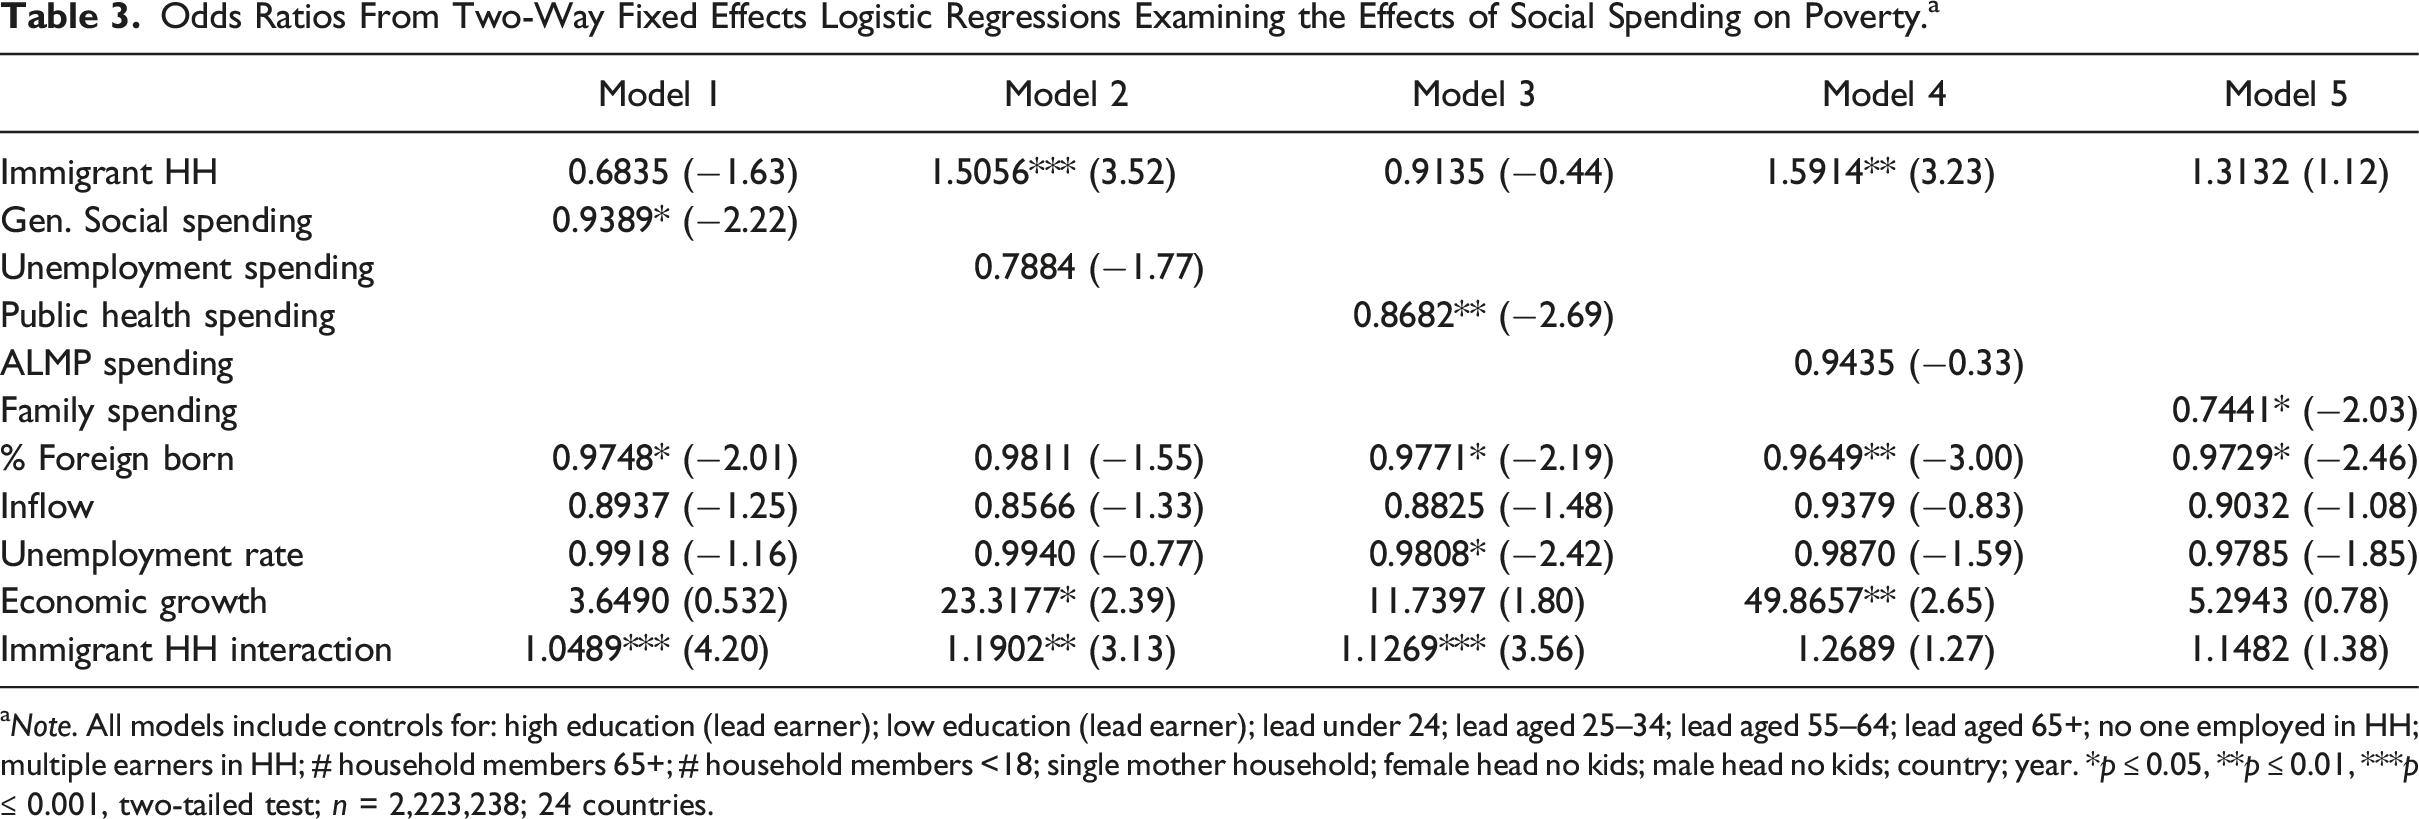
aNote. All models include controls for: high education (lead earner); low education (lead earner); lead under 24; lead aged 25–34; lead aged 55–64; lead aged 65+; no one employed in HH; multiple earners in HH; # household members 65+; # household members <18; single mother household; female head no kids; male head no kids; country; year. *p
Interpreting the odds ratios is not straightforward. The constant term changes across models, and the country samples vary in the degree of unobserved heterogeneity in the latent outcome. As a result, comparing odds ratios or log odds across models or groups can be misleading (Allison 1999; Breen, Karlson, and Holm 2018; Mood 2010). This problem is further complicated by the inclusion of interaction terms. Odds ratios of the interaction term are often a misleading representation of interaction effects (Mize 2019). Therefore, we present and discuss our results exclusively as predicted probabilities and marginal effects. This helps avoid the common error of comparing degree of statistical significance of odds ratios between results (Gelman and Stern 2006), provides a more intuitive interpretation of effects, and allows for a more comprehensive and accurate assessment of the interaction effects. Likewise, this approach facilitates interpretation across models by using a common metric: probability or marginal probability.
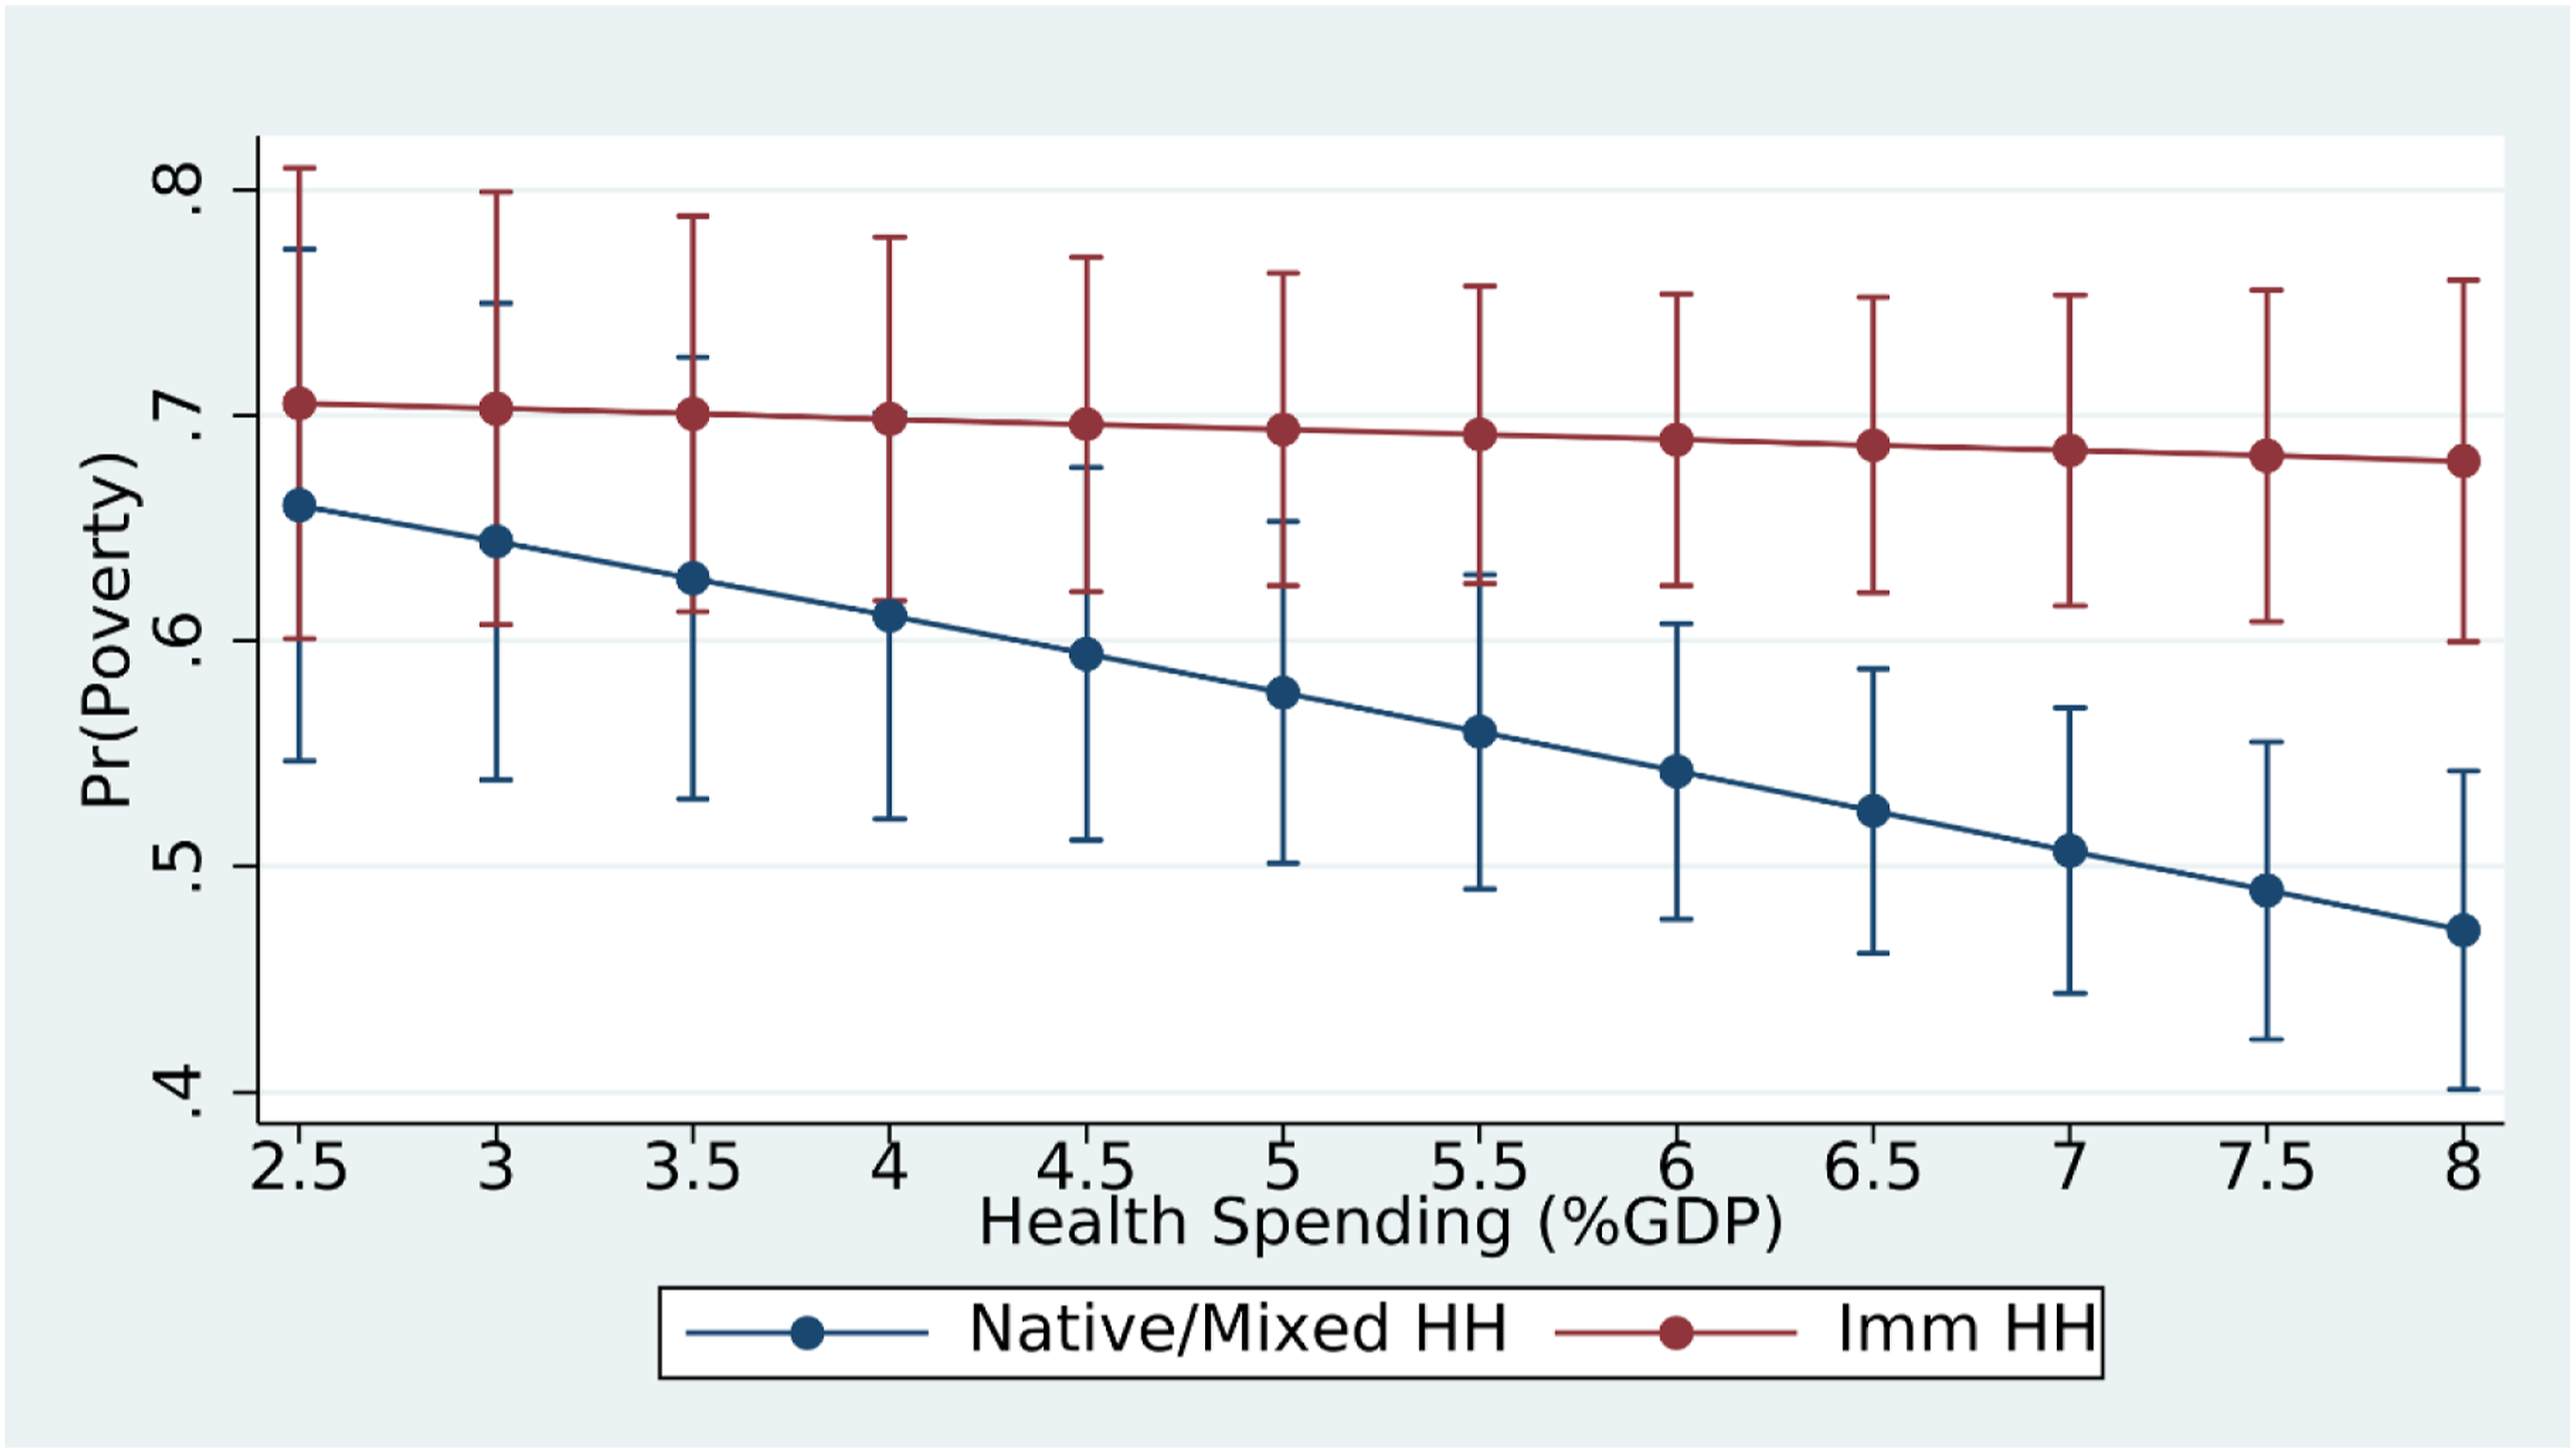
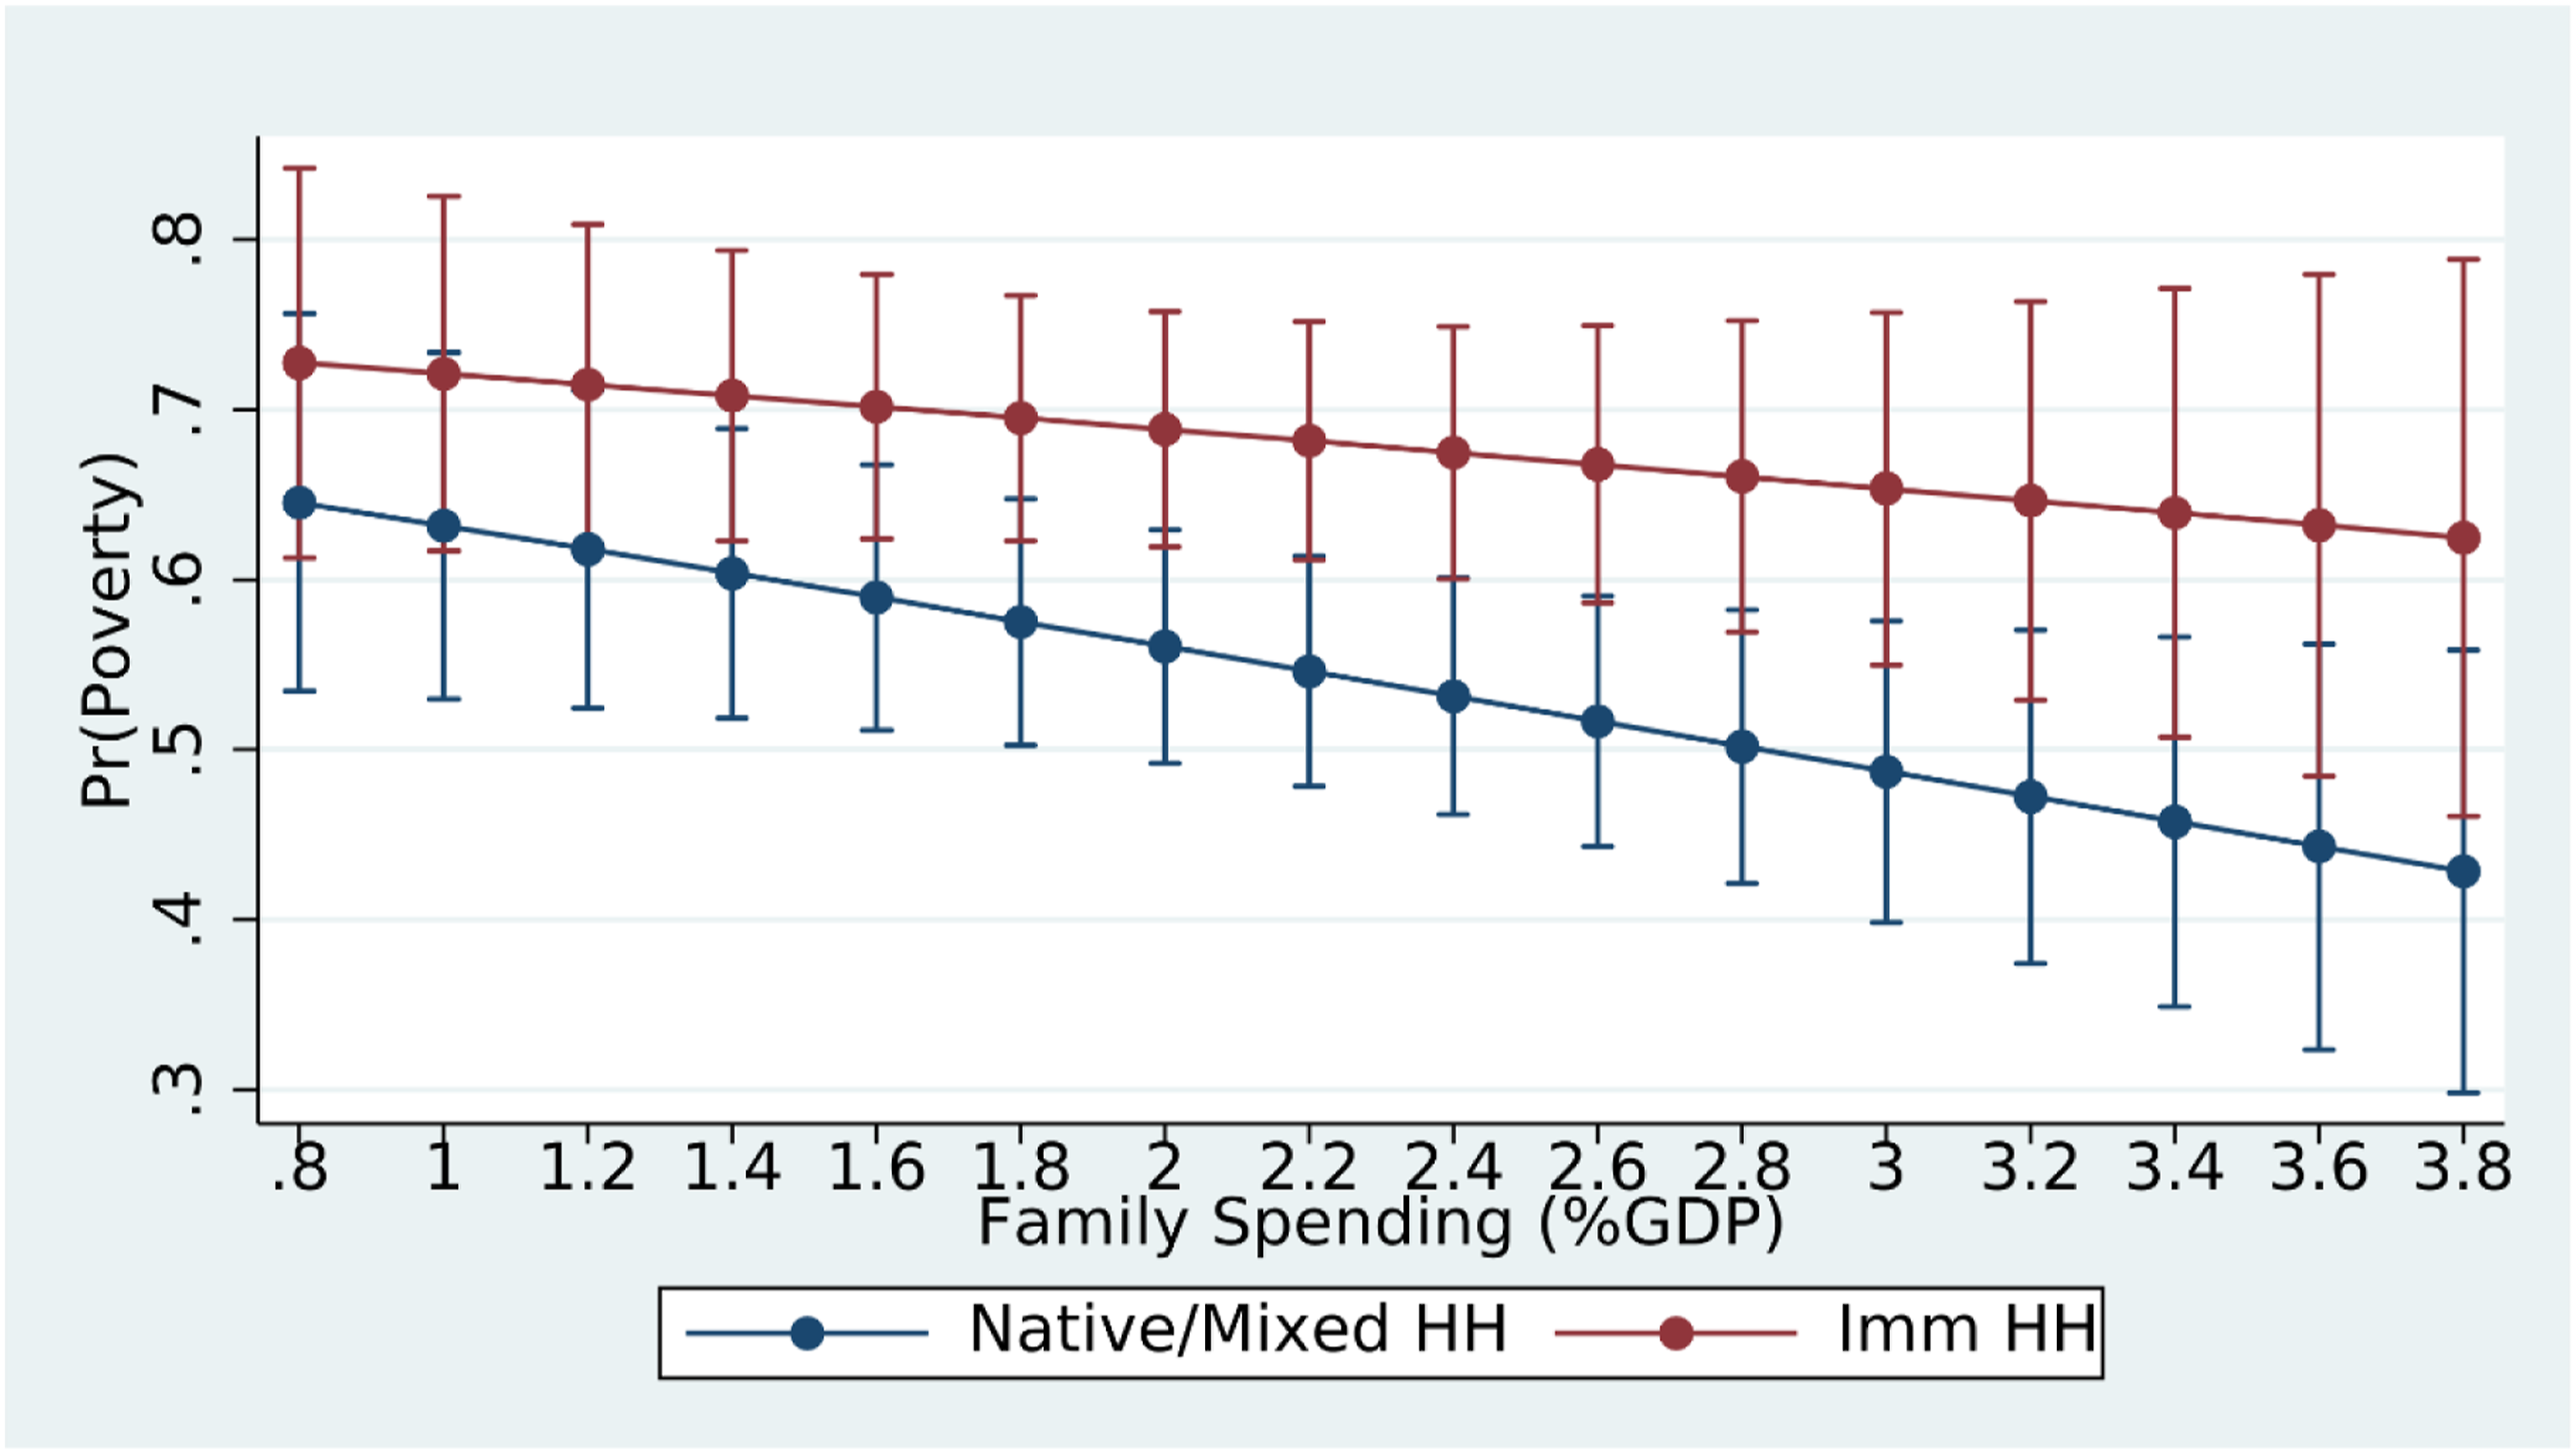
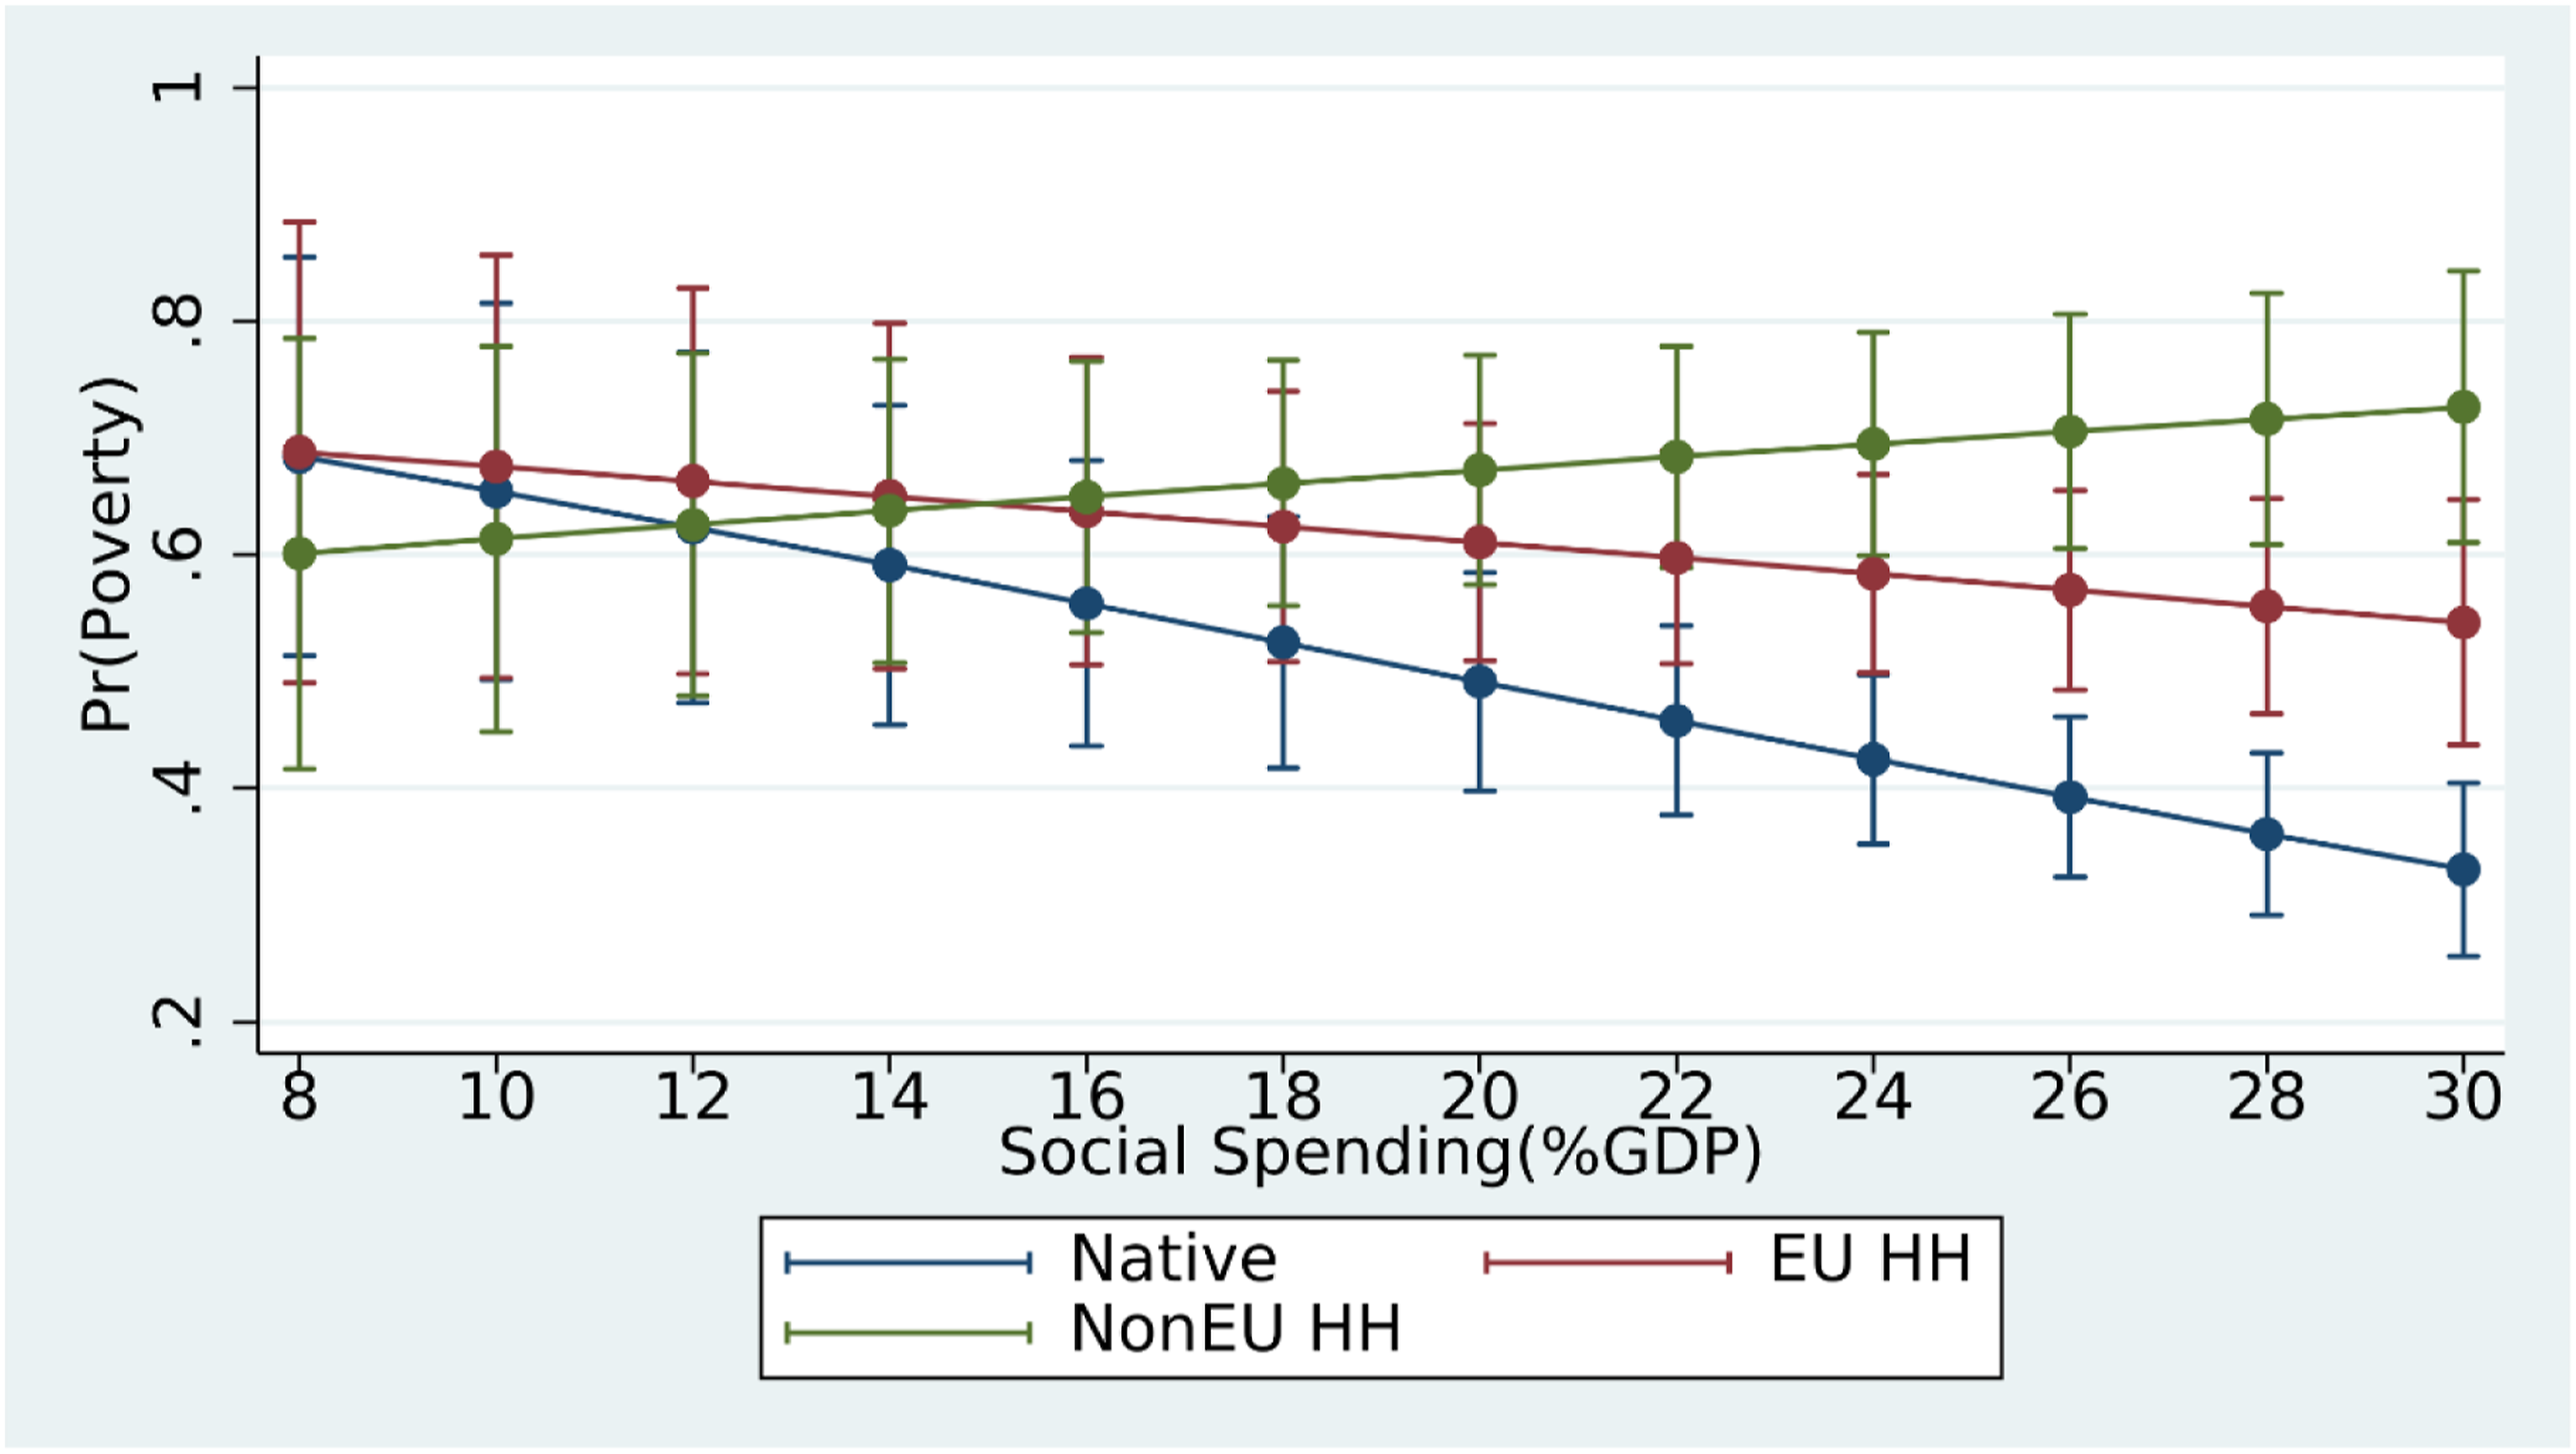
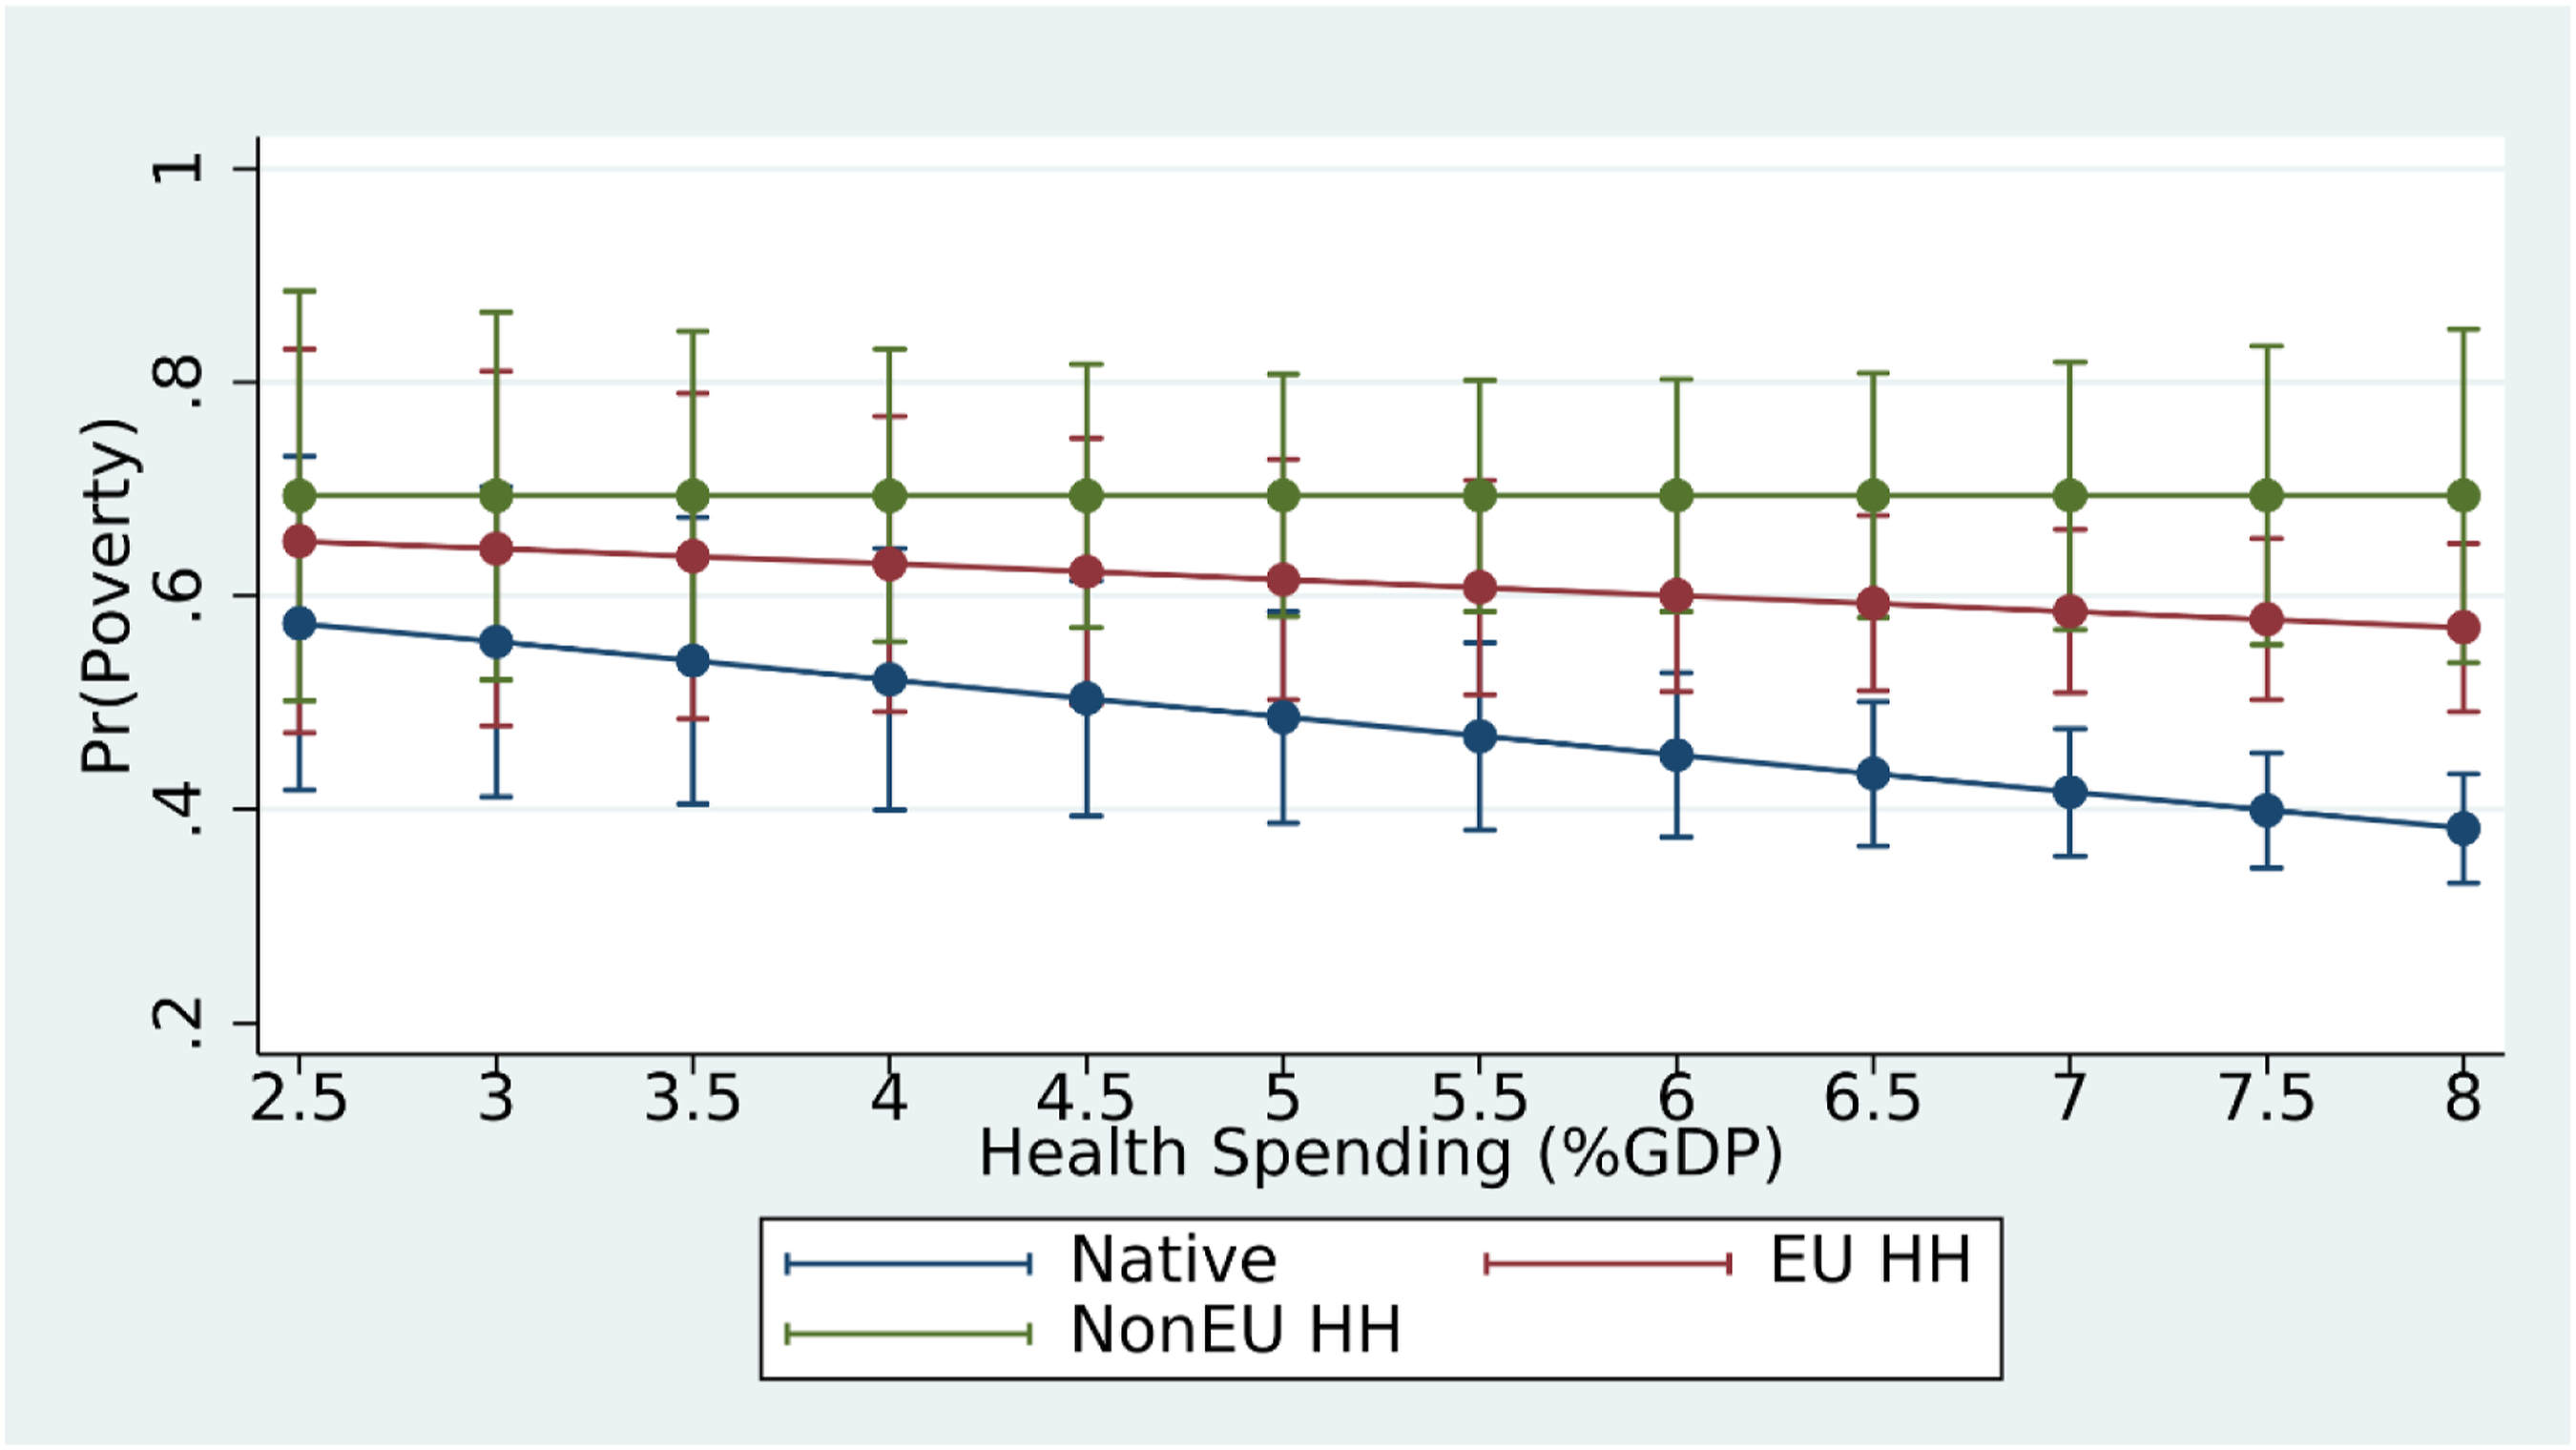
We present the predicted probabilities from the two-way fixed effect models in Figures 3–11 and the marginal probabilities in the appendix. The typical household in our overall sample is unlikely to be poor regardless of the welfare policies in place. Therefore, the probabilities are based on a household with the characteristics of a typical poor household. We choose the typical characteristics of a poor household as our representative household because these households have the characteristics for whom the policies in our study are most likely to affect. This household has a lead earner with a low level of education and is aged 35–54. There is no one working in the household; there are two partnered adults or a single father and one child. Controls for the economic variables and immigrant population are set at their means. All predicted probabilities are calculated within the range of the data, using values from 5%-95% of the country-level cumulative distribution of each respective measure. Because there is some collinearity between the social spending measures especially general social spending and the more specific measures (see Supplemental Appendix G), multiple country-level controls, and cross-level interactions, we model only one social spending measure at a time. Predicted probabilities of poverty for immigrant and native households and confidence intervals by total social spending. Predicted probabilities of poverty for immigrant and native households and confidence intervals by unemployment spending. Predicted probabilities of poverty for immigrant and native households and confidence intervals by health spending. Predicted probabilities of poverty for immigrant and native households and confidence intervals by family spending. Predicted probabilities of poverty for EU, Non-EU, and native households and confidence intervals by general social spending. Predicted probabilities of poverty for EU, Non-EU, native, and mixed-status households and confidence intervals by health spending. Predicted probabilities of poverty for citizen, non-citizen, and native households and confidence intervals by general social spending. Predicted probabilities of poverty for citizen, non-citizen, and native households and confidence intervals by unemployment spending. Predicted probabilities of poverty for citizen, non-citizen, and native households and confidence intervals by health spending.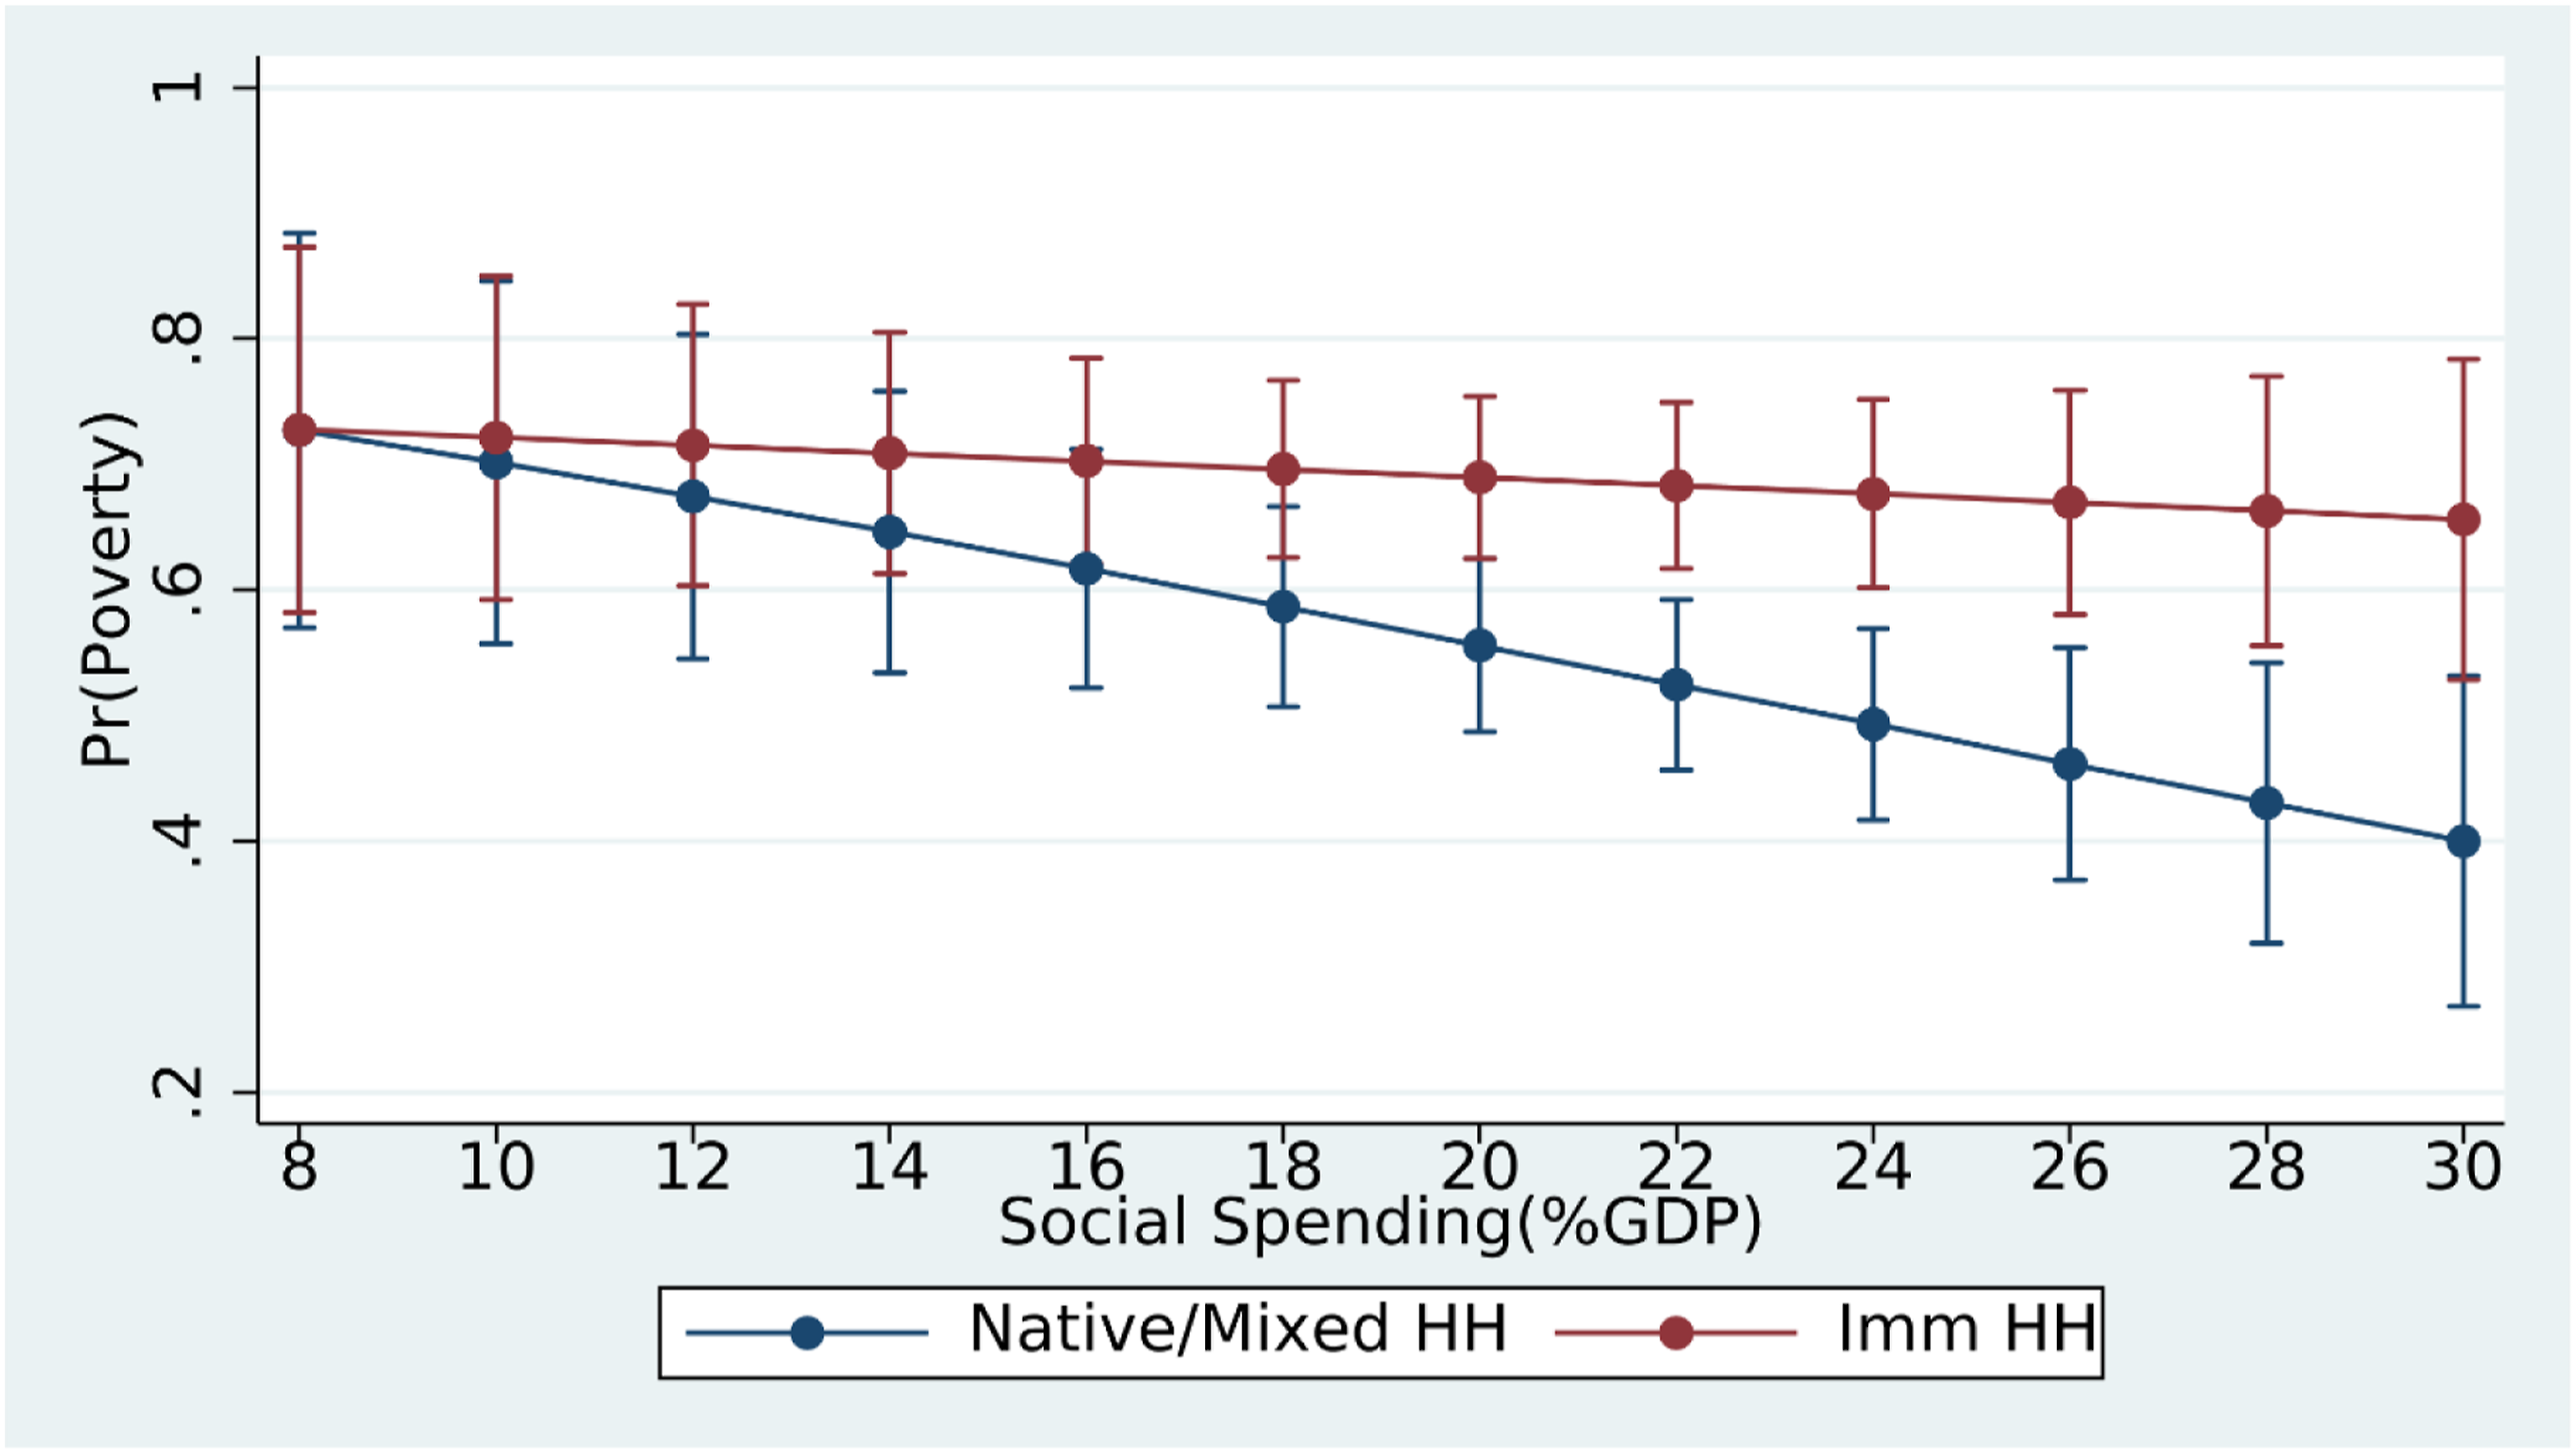
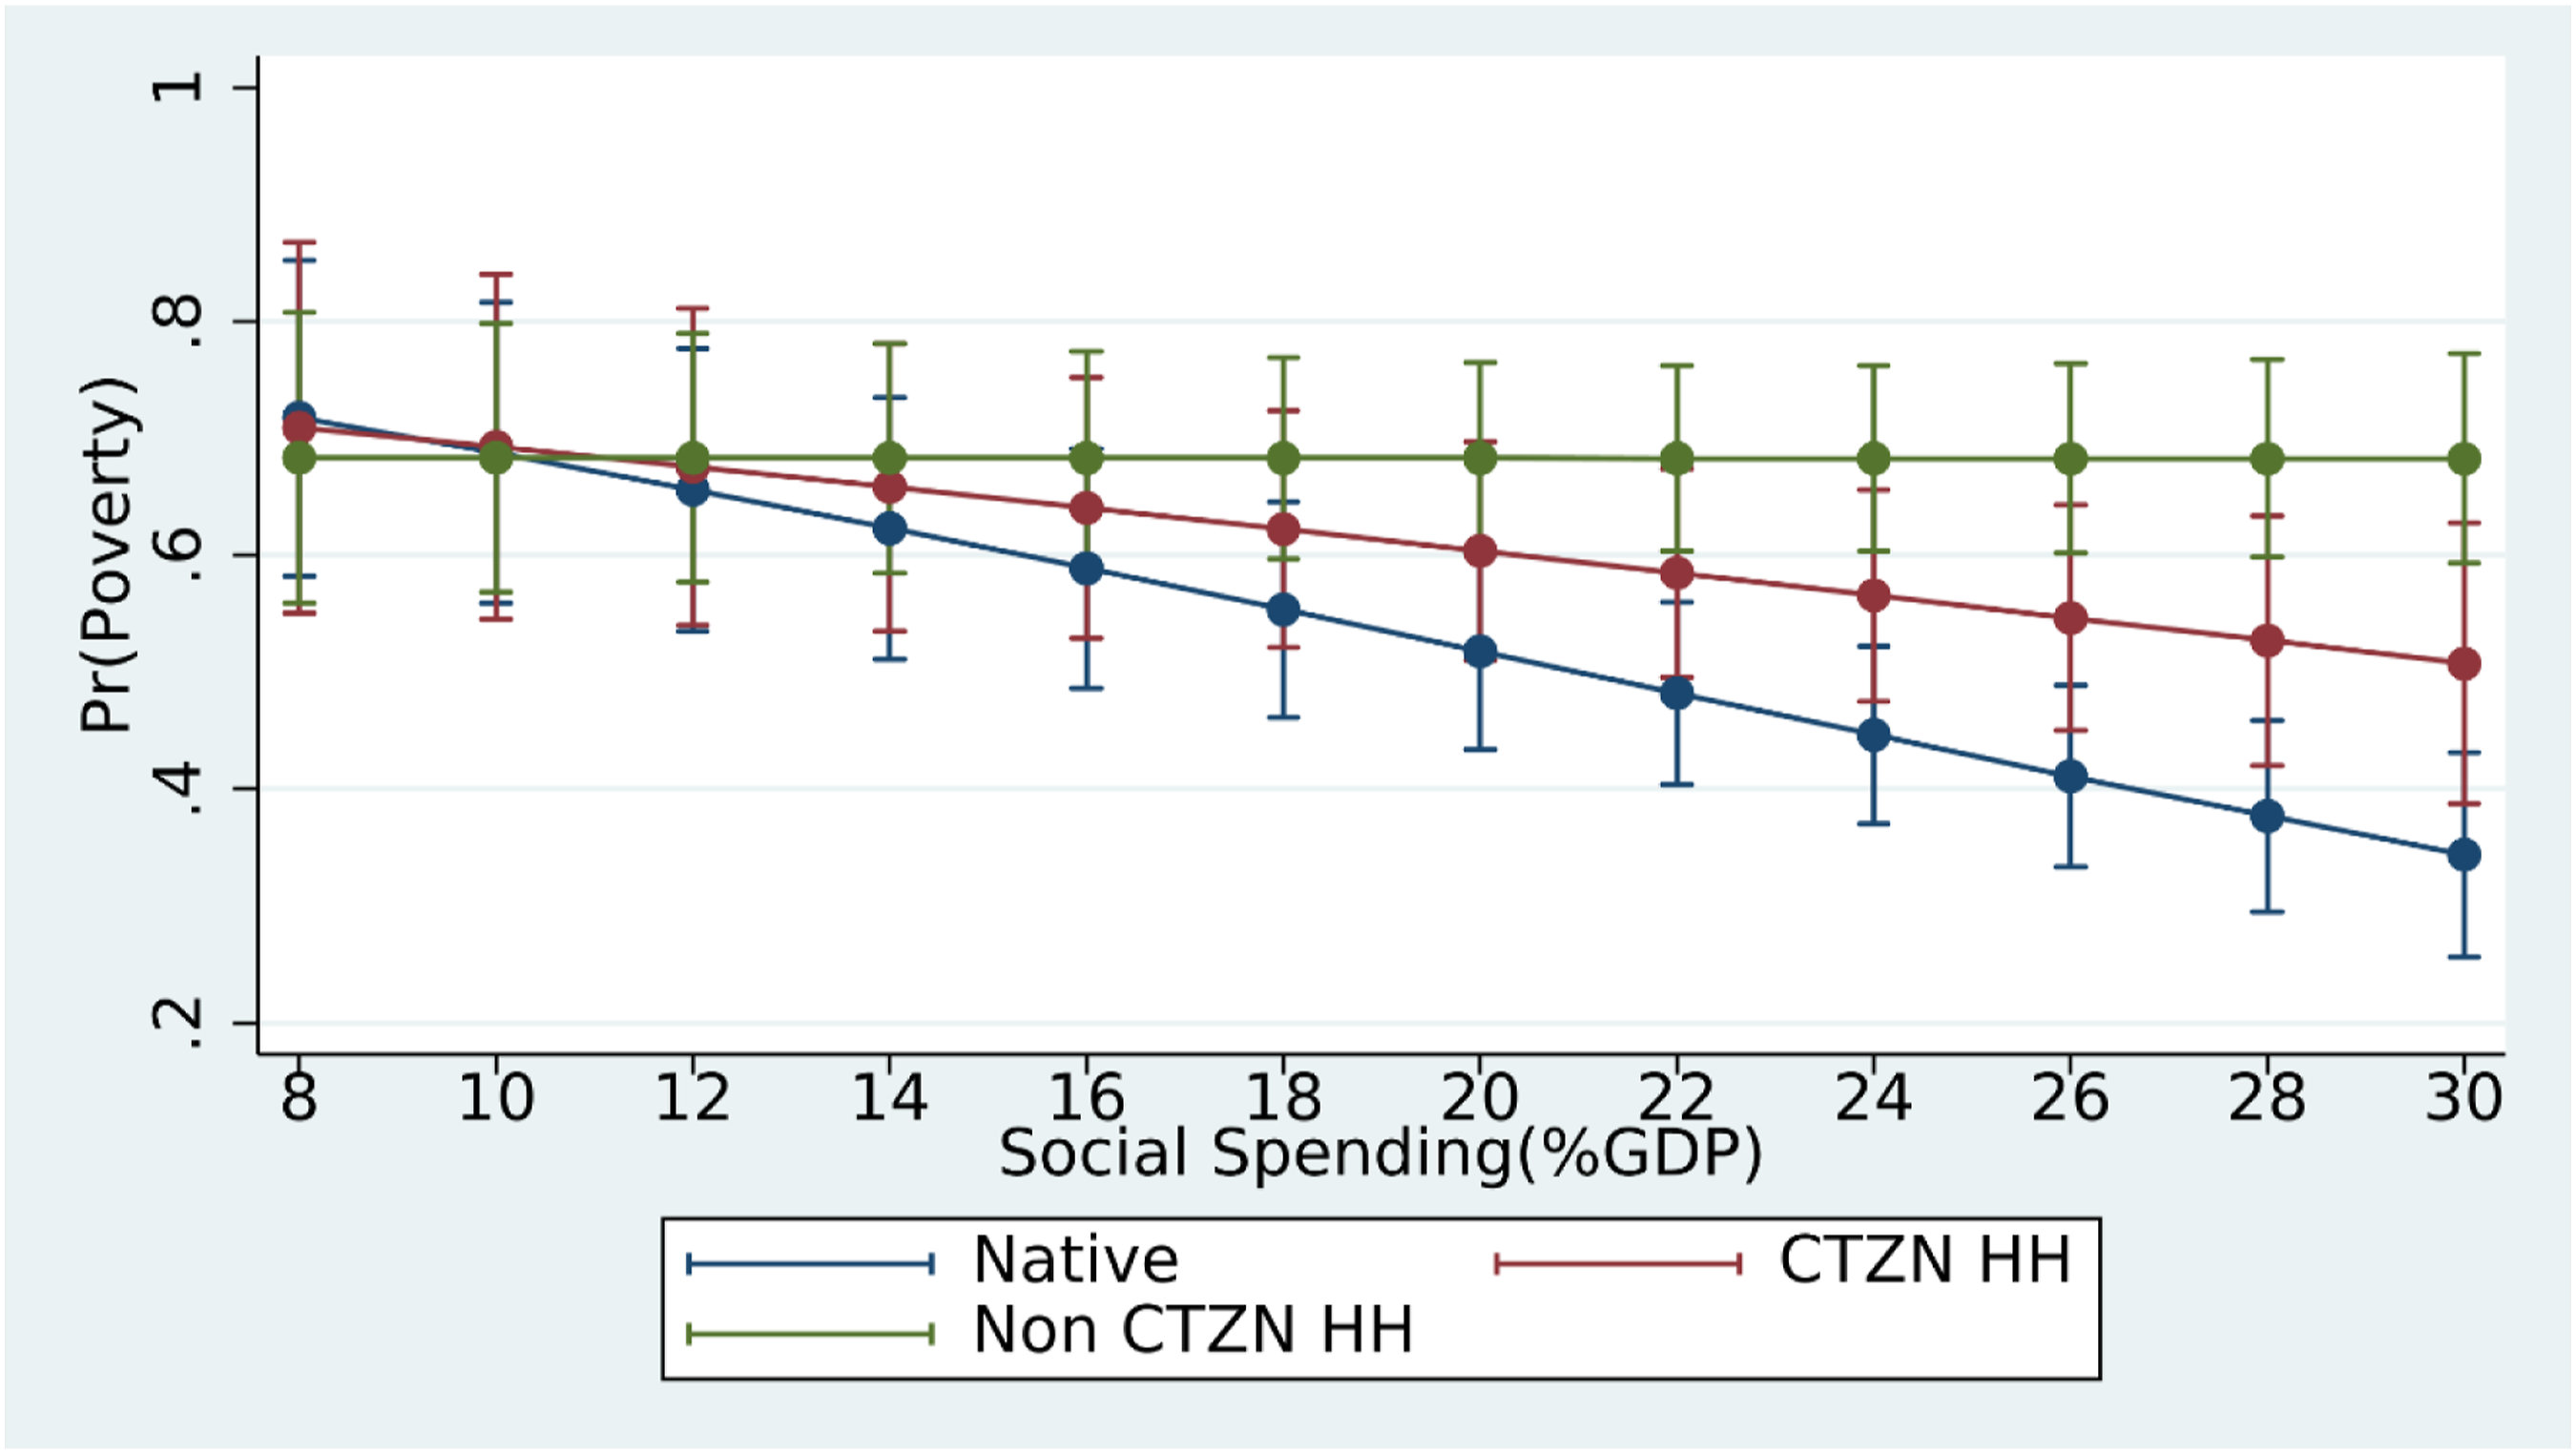
Beginning with Figure 3, the predicted probability of poverty by level of general social spending, based on Model 1 in Table 3, indicates considerably different effects by type of household. The pattern for native/mixed households reflects the typical relationship between social spending and poverty documented in previous literature: the probability of poverty decreases as social spending increases, going from a probability of 0.727 to a probability of 0.400 with a change in social spending from 8% of GDP to 30% of GDP. However, the line for immigrant households appears to be effectively flat, changing only 0.07 from the lowest to the highest level of social spending. Looking deeper at the marginal probabilities (Supplemental Appendix H), at the lowest levels of social spending there is no statistically significant difference between the two household types; however, once social spending reaches 14% of GDP, there is a statistically significant difference in the probability for native/mixed and immigrant households. Using a test of first differences, which determines if the change in marginal probabilities is significant, we find this gap to be increasing at a statically significant rate: for a two-percentage-point increase in social spending, the increase in the gap between native households and immigrant households is statistically significant.
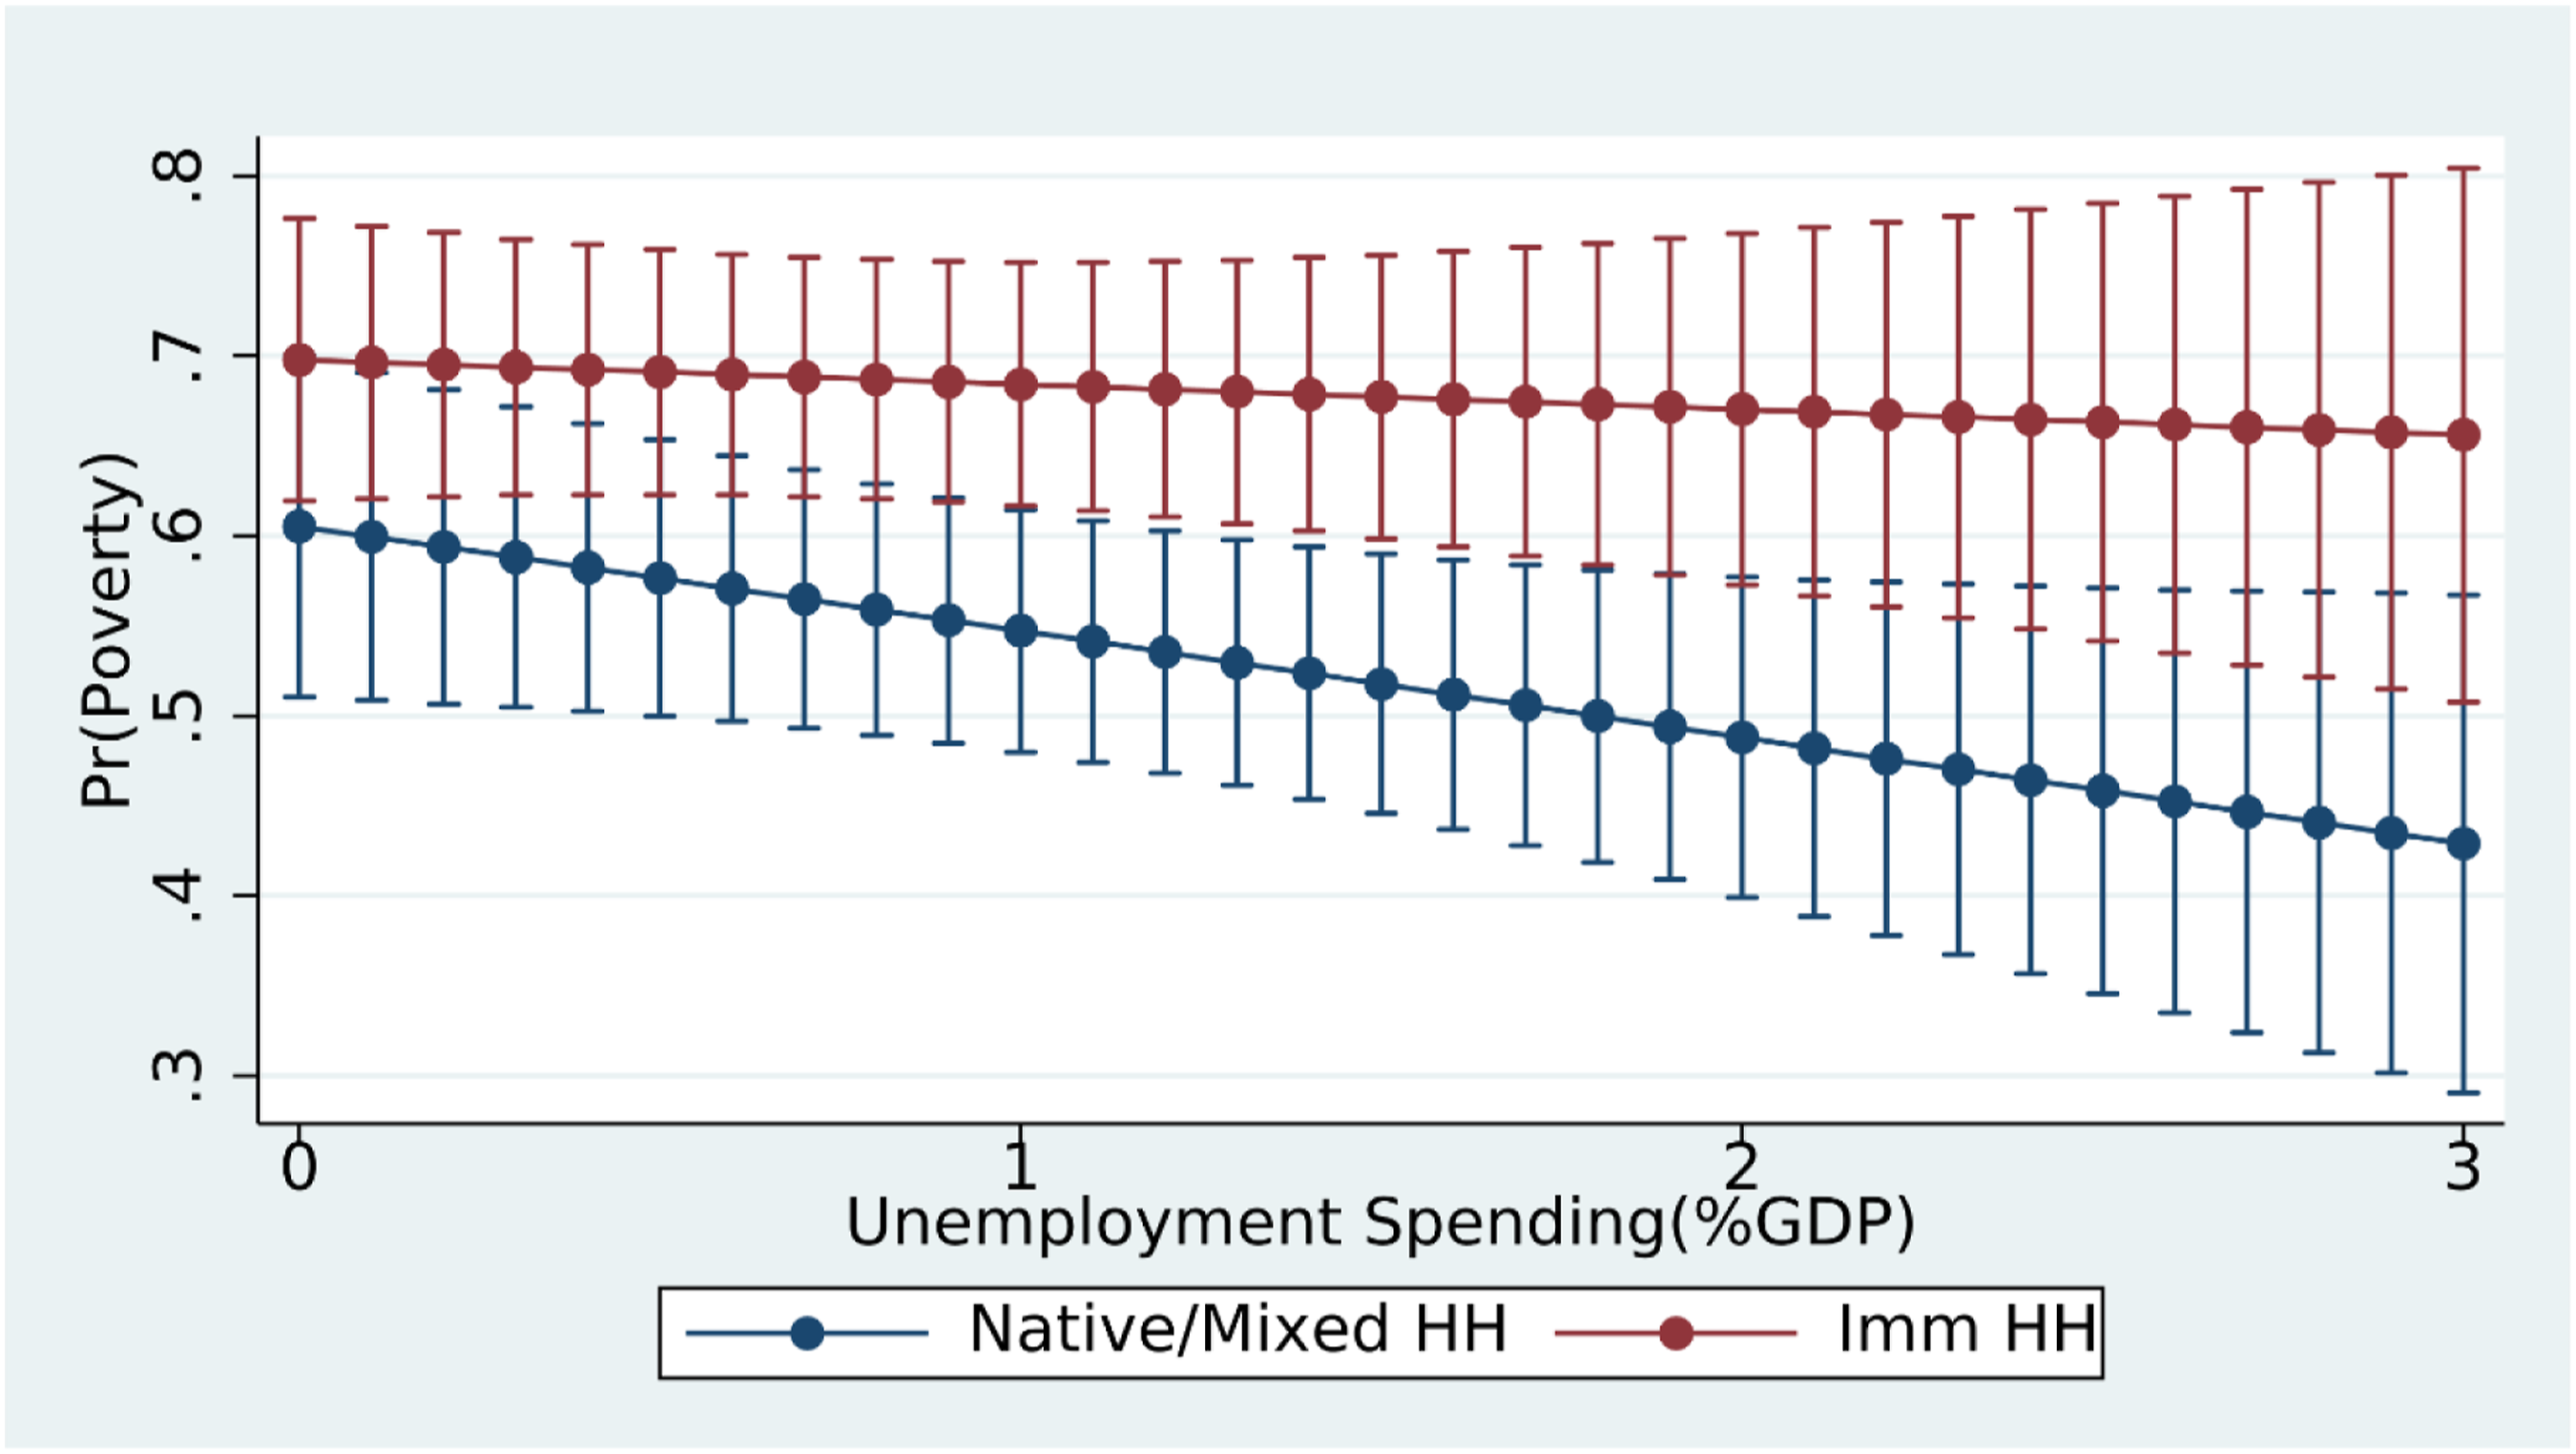
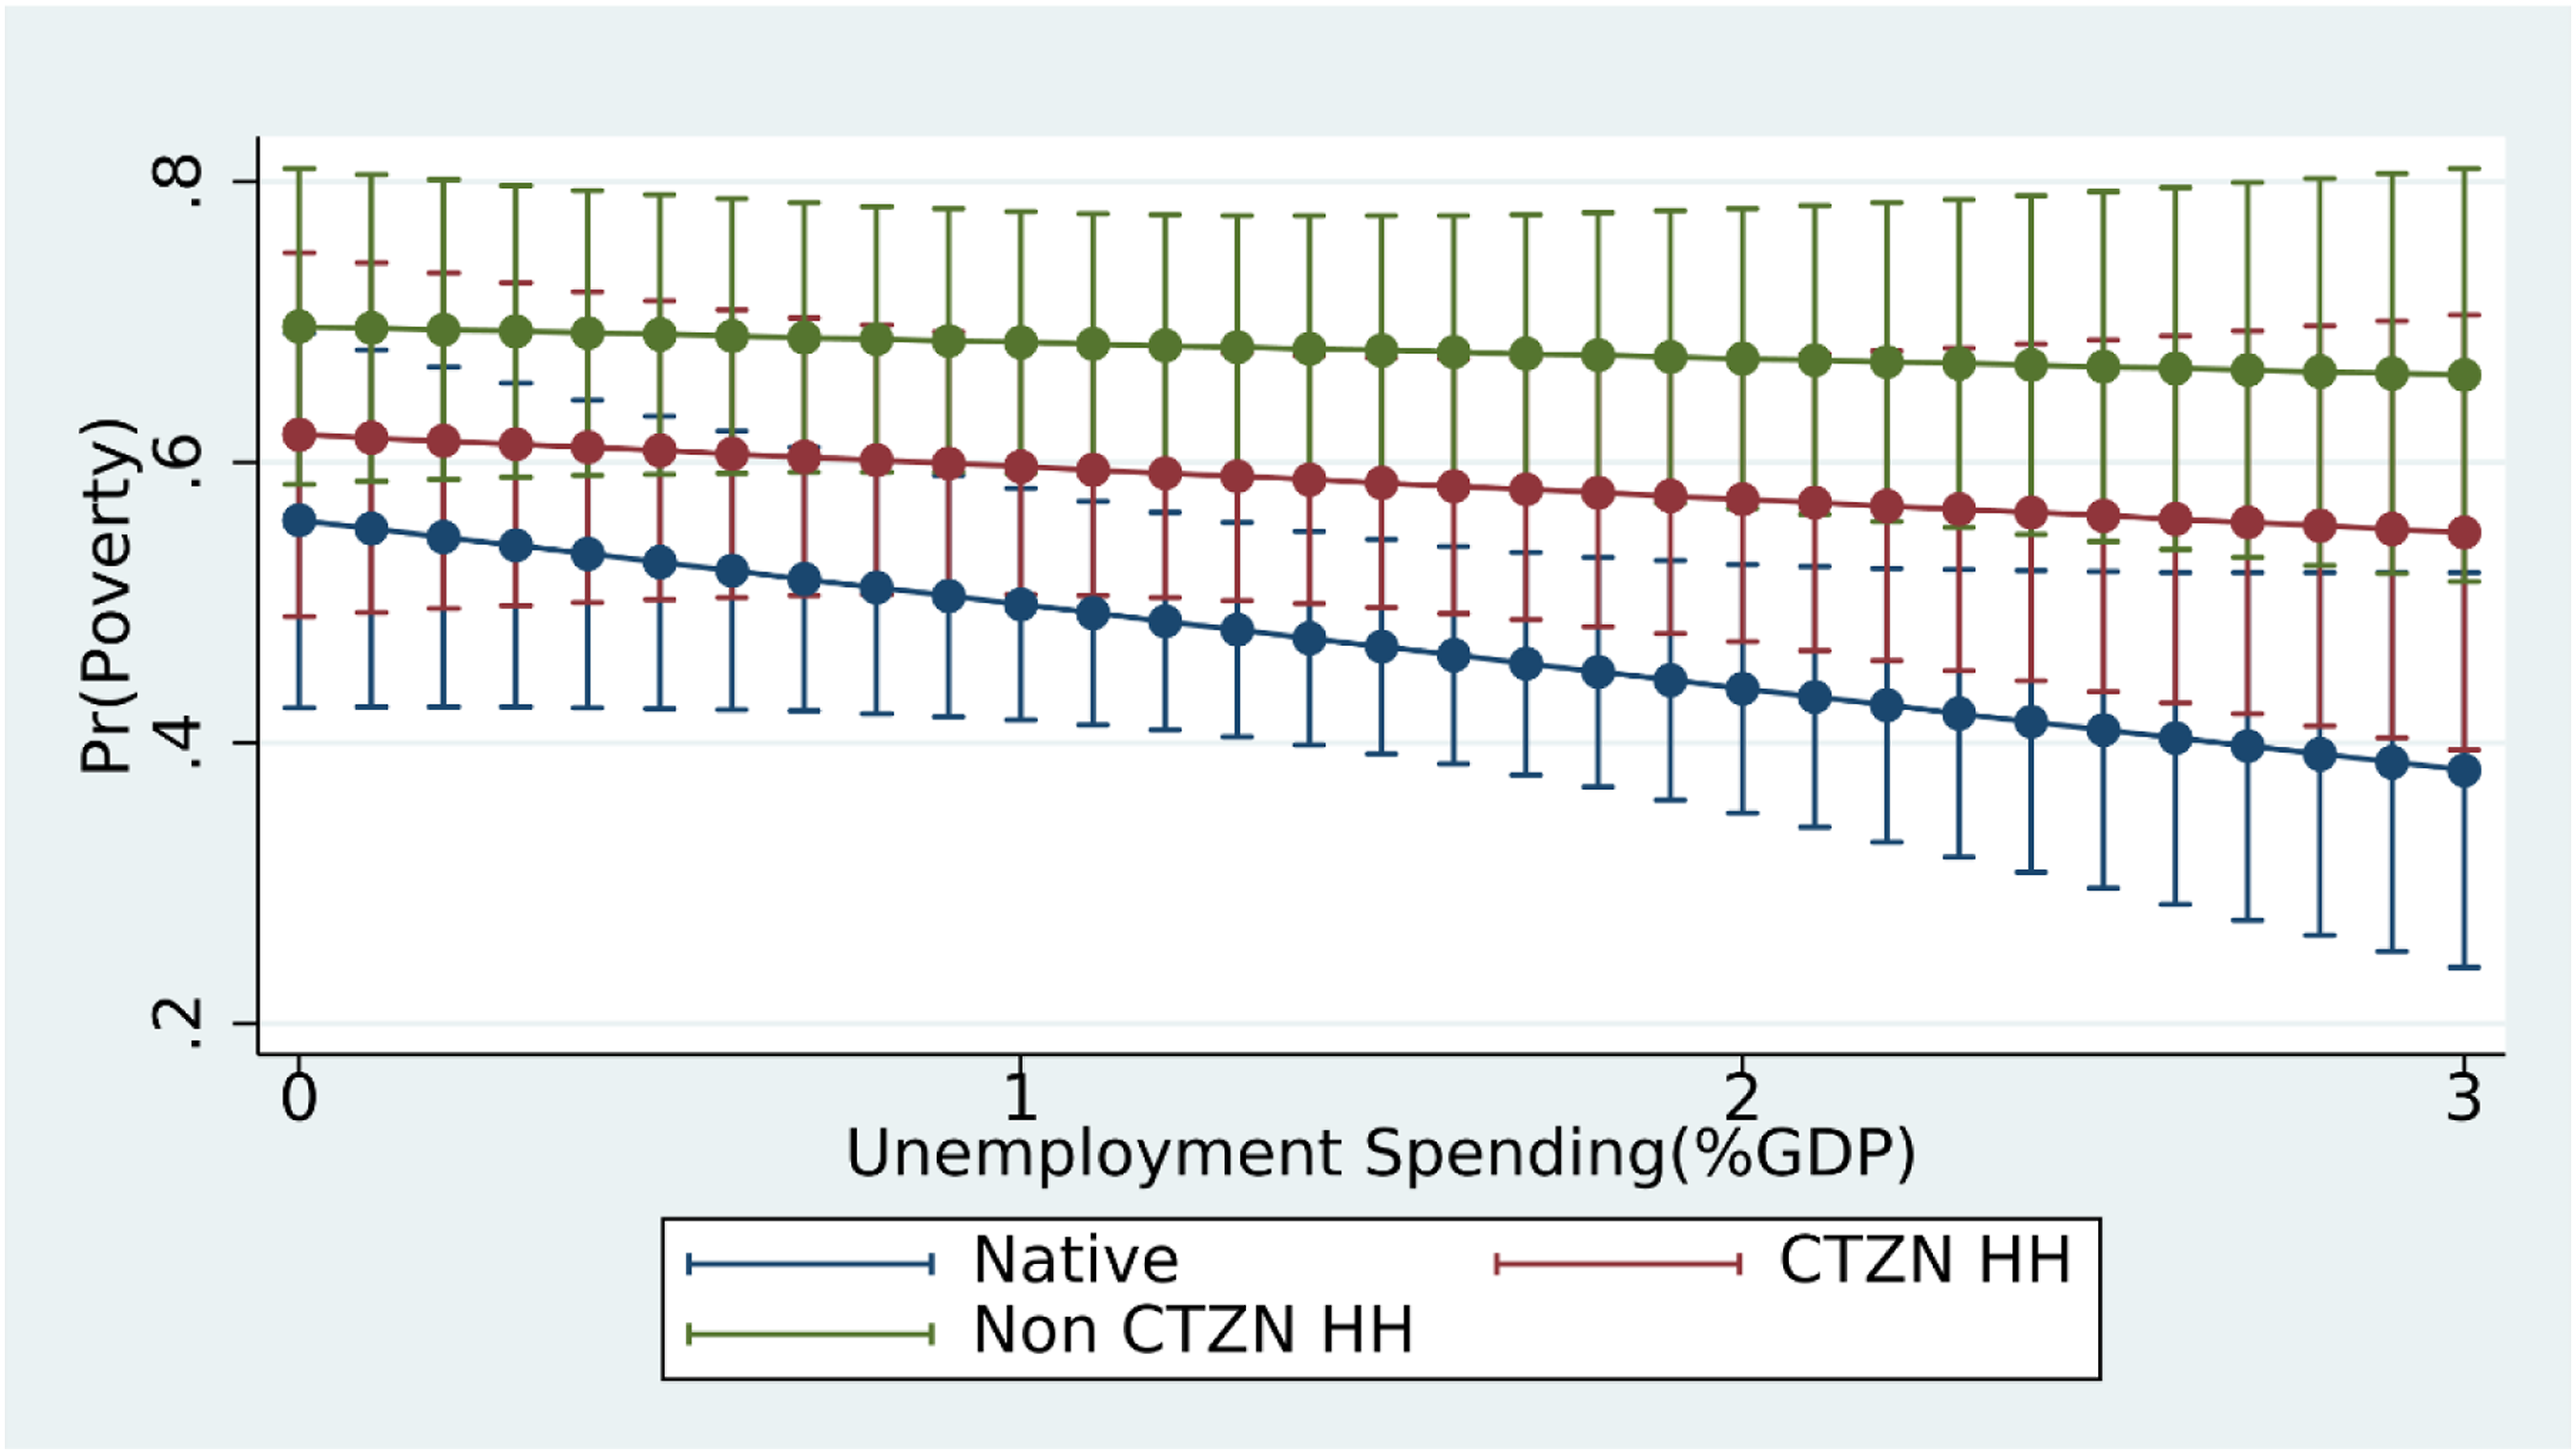
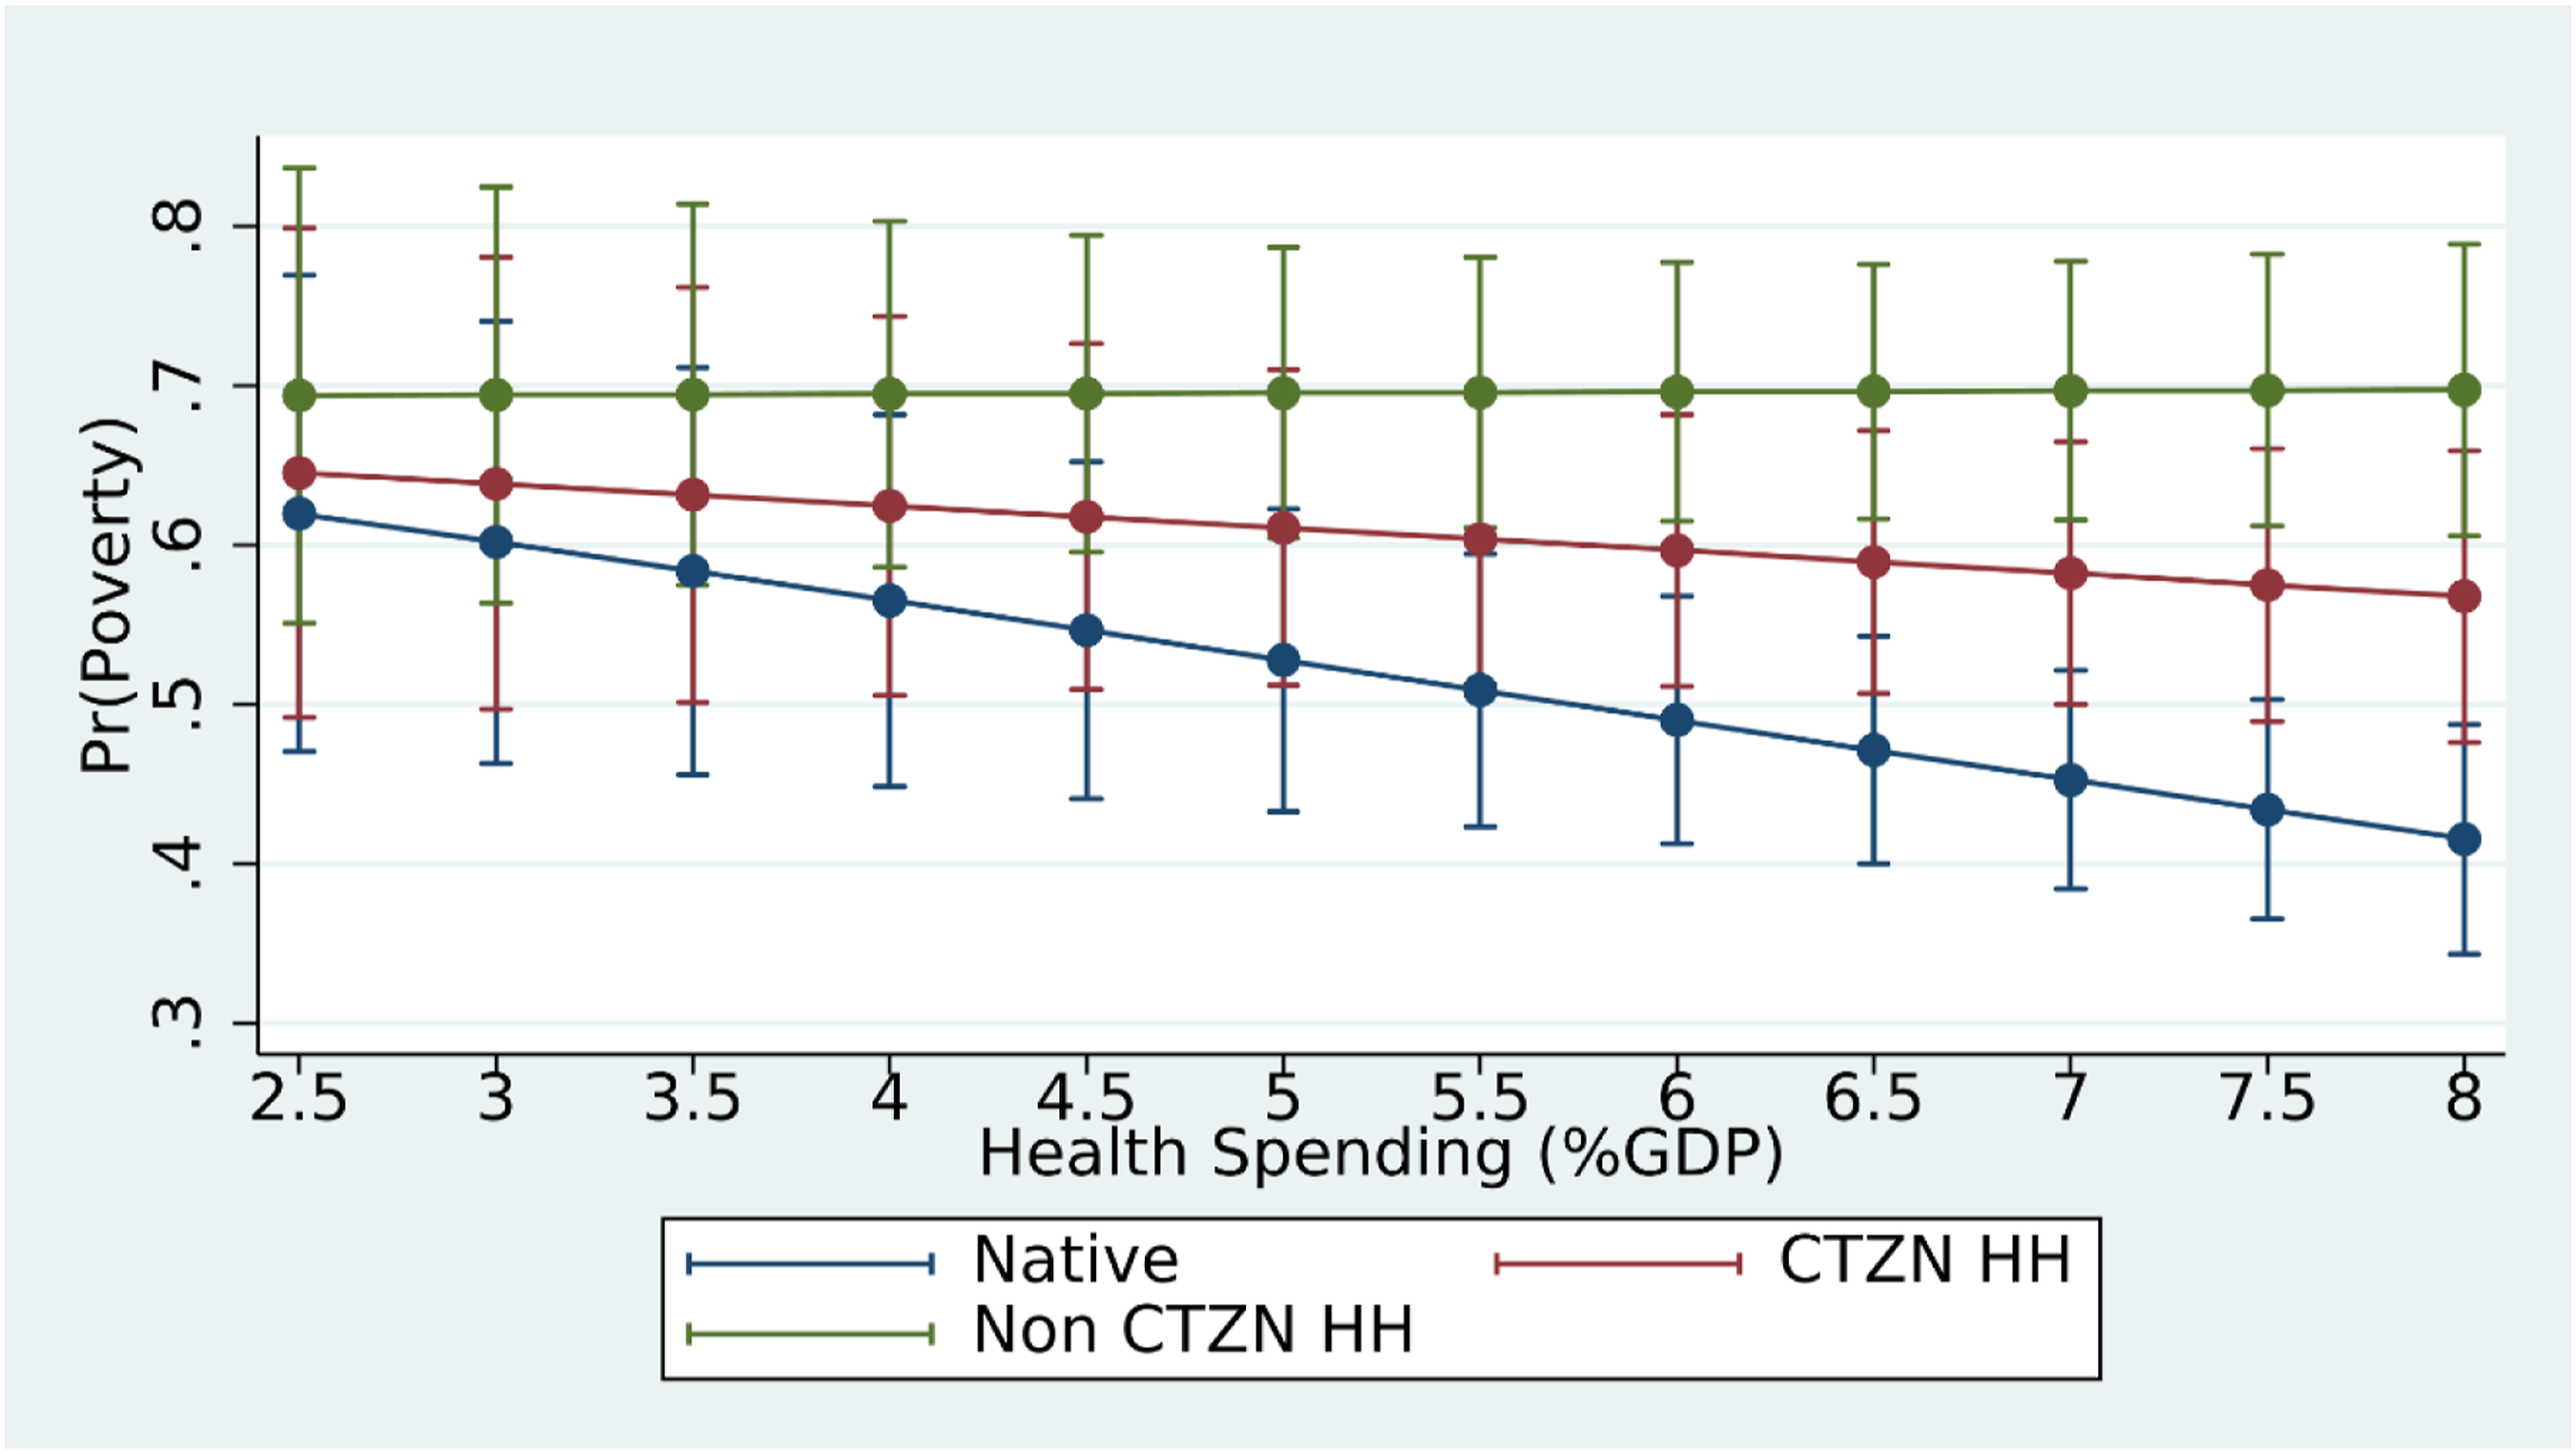
In the subsequent models, we explore the effects of more specific spending measures. Because general social spending is indeed very general, this allows us to better understand which specific polices, if any, are driving the pattern presented in Figure 3. Given the correlation between general social spending and the more specific spending measures, it is not surprising the patterns for the specific spending areas often reflect the results for general social spending. In the case of unemployment spending, as shown in Figure 4, the main difference is immigrant households face a significantly higher probability of poverty than natives at all levels of social spending, not just higher levels of social spending. While the change in the probability of poverty between the lowest and highest levels of spending for immigrants is again quite small, only around 0.04, the difference for native/mixed households if more substantial at around 0.18. Unemployment spending has a significantly stronger effect on native poverty than immigrant poverty. The same is true for health spending, in Figure 5. Here, however, the divergence is slighter bigger. The change in the marginal probability is over 0.15 from the lowest to the highest values. Active labor market programs have little effect on poverty, regardless of the household type. On the other hand, family policy spending, in Figure 6, has a universal effect, reducing the probability of poverty for both groups at a roughly equal rate; a test of first differences finds the slope of the predicted probabilities for immigrant households is not significantly different from the slope for native households past the lowest levels of family spending. Based on these findings, it is clear immigrants generally face higher probabilities of poverty, all else equal, and greater social spending can actually make this disparity even greater. Only family spending reduces poverty for both immigrant and native/mixed households alike, while unemployment and health spending significantly increase the marginal difference between immigrant and native poverty.
Because the designation of households as native/mixed and immigrant is quite general, it may not adequately account for variation in the immigrant experience. Therefore, we test two additional designations, dividing immigrants into EU/non-EU immigrants (for EU countries) and citizen/non-citizen immigrants and forming households that contain the relevant combinations of natives and each type of immigrant. While we include all combinations in the models and tables, we only include three groups in the figures: Native, EU, Non-EU; and Native, Citizen, Non-Citizen.
Odds Ratios From Two-Way Fixed Effects Logistic Regressions Examining the Effects of Social Spending on Poverty for Natives, EU-Immigrants, and Non-EU Immigrants.
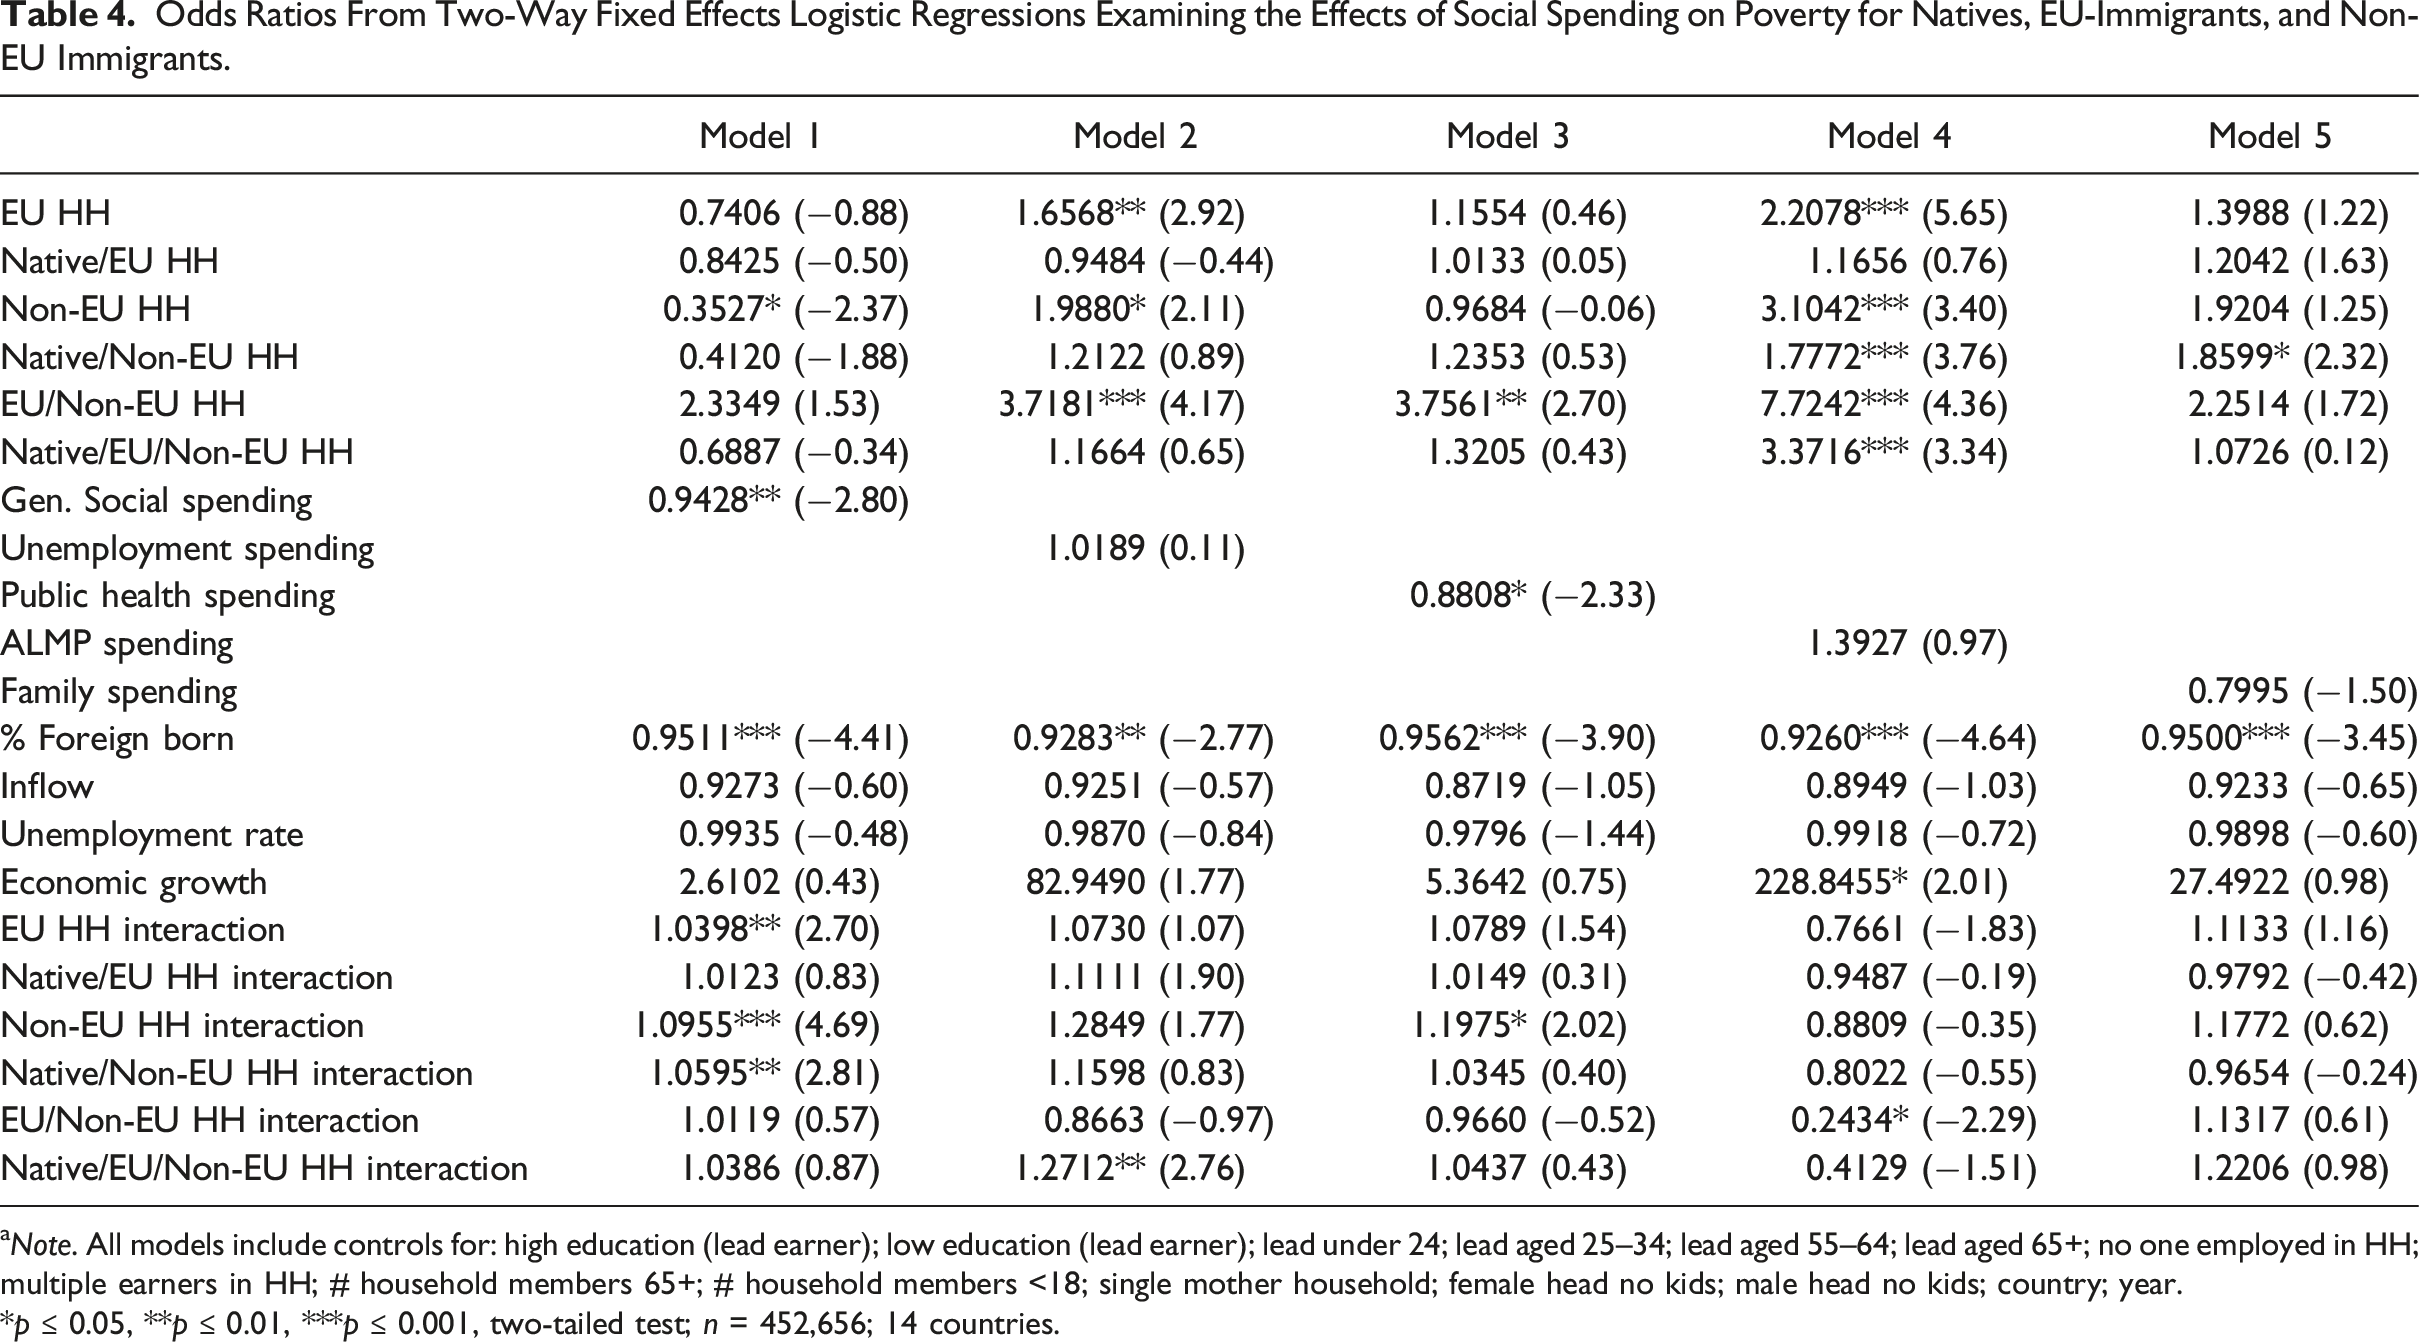
aNote. All models include controls for: high education (lead earner); low education (lead earner); lead under 24; lead aged 25–34; lead aged 55–64; lead aged 65+; no one employed in HH; multiple earners in HH; # household members 65+; # household members <18; single mother household; female head no kids; male head no kids; country; year.
*p
We now turn to the more specific policy spending areas to see what may be driving the findings in Figure 7. It does not seem to be from unemployment spending. Unemployment spending has little effect no matter the household type, and with no significant differences in the effects across the three household types. Health spending, on the other hand, uncovers a different pattern in Figure 8. Greater health spending reduces the probabilities of poverty for native and EU households rather substantially. Native poverty drops by 17 percentage points, and EU immigrant poverty drops by around 11 percentage points, a statistically insignificant marginal difference. On the other hand, for non-EU immigrants, health spending has little effect on their probability of poverty, actually increasing the probability by about 6 percentage points. With the growing cost of healthcare, access to affordable healthcare is a critical resource for avoiding poverty. Particularly in the EU, access to comprehensive government healthcare for the poor is often connected to EU citizenship status. Being a native or EU-citizen generally provides such access, while being from outside the EU means access to healthcare coverage is likely to be more limited (Sainsbury 2012). Further, this pattern reflects that seen with general social spending; therefore, health spending, at least in part, is likely to be central to the effect of general social spending. As in Table 3, the effects of ALMP spending, as in the overall sample, do not vary significantly by household type. Family spending also does not significantly affect poverty or significantly vary by household type.
Overall, EU immigrant households, while they experience higher probabilities of poverty than natives, tend to be more similarly affected by social spending than non-EU immigrations. As previously mentioned, as EU migrants, these individuals and households are generally entitled to the same welfare state benefits as natives, and that is what we see reflected here with the effects of health spending. When social spending lowers native poverty, it also lowers EU-immigrant poverty; when social spending has no effect on native poverty, it also has no effect on EU-immigrant poverty. By and large, however, none of these policies affect non-EU poverty in a significant way.
Odds Ratios From Two-Way Fixed Effects Logistic Regressions Examining the Effects of Social Spending on Poverty for Natives, Citizen-Immigrants, and Non-Citizen Immigrants. a
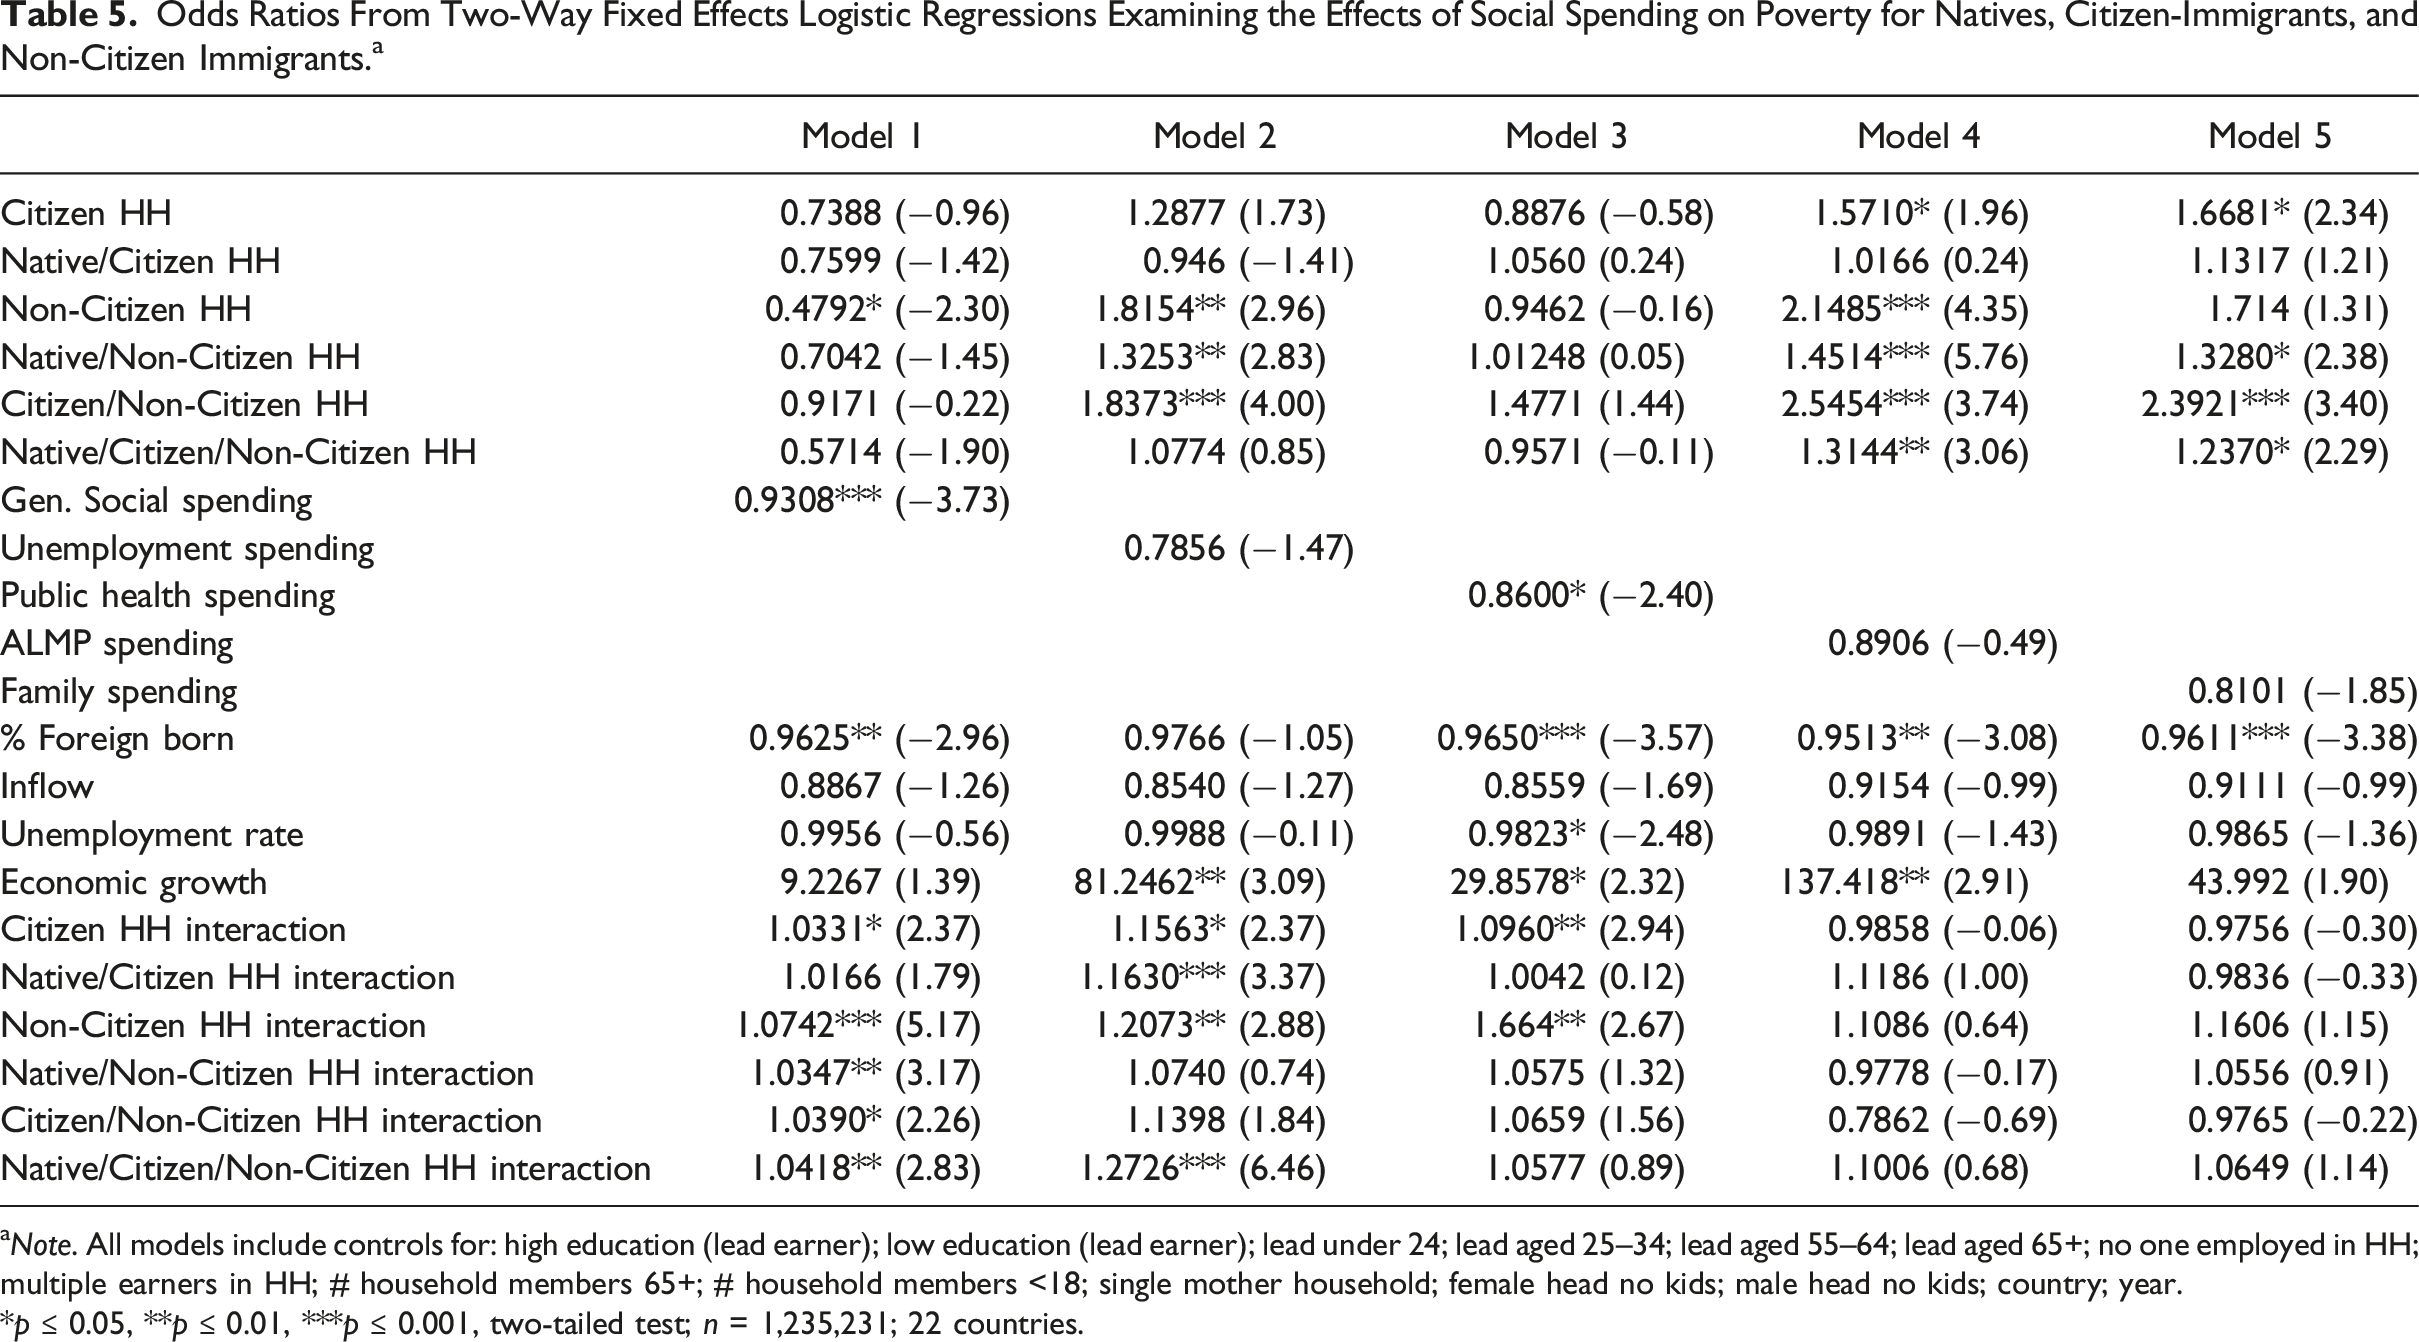
aNote. All models include controls for: high education (lead earner); low education (lead earner); lead under 24; lead aged 25–34; lead aged 55–64; lead aged 65+; no one employed in HH; multiple earners in HH; # household members 65+; # household members <18; single mother household; female head no kids; male head no kids; country; year.
*p
For example, in Figure 10, unemployment spending uniquely benefits native households, while all other household types experience little to no effect on their probability of poverty. Further, the marginal probabilities between natives and both citizen immigrant and non-citizen immigrant households grow significantly larger as unemployment spending increases, growing almost 11 percentage points and 14 percentage points, respectively. For non-citizens, this is likely an issue of entitlement; they may be unable to access unemployment benefits; or, in the case of both types of immigrant households, if unemployment benefits are based on contributions, they may have lower levels of contributions than natives.
Health spending, in Figure 11, on the other hand, affects both citizen and non-citizen household types yet in significantly different ways than natives. For natives, the probability of poverty is lowered by 20 percentage points, but for citizen-immigrants, it is lowered only by 7 percentage points. Possibly this difference is driven not by limited legal access but perhaps by difficulty navigating a complex public healthcare bureaucracy, often a challenge even for natives. Non-citizen households, however, see essentially no reduction of poverty with greater health spending. This is very similar to the EU/non-EU findings in the previous model. This suggests health benefits and citizenship status are closely connected; however, this is unlikely to be the whole story, given that natives experience larger effects than citizen-immigrants.
The final two models include ALMP and family spending. We again find little effect of ALMP spending regardless of household type. Similarly, the effect of family spending is not statistically significantly different across household types, and while it has a modest effect on poverty, it does not reach statistical significance.
It is clear from these results, spending that benefits native households also typically benefits citizen immigrant households, with the exception of unemployment spending. The same cannot be said for non-citizen households. Predicted probabilities for these households are largely unaffected by social spending, regardless of the program, suggesting entitlements closely correspond with citizenship.
Bringing these three sets of models together, examining immigrants as a whole, by EU origins, and citizenship status, indicates a clear hierarchy in the relationship between social spending and poverty. While not all spending lowers poverty, it is clear that when it does, the strongest effects are for natives. In no instance does spending reduce poverty more for immigrants than natives. In some instances, immigrants do see similar effects to natives, such as family spending in Table 3. Immigrants in less privileged positions, those from non-EU countries and non-citizens, often fair worst. Even when natives, citizen-immigrants, and EU-immigrants see lower poverty with more spending, non-citizen and non-EU immigrant households typically do not. This, as a result, widens the poverty gap between these immigrant groups and natives, supporting the welfare chauvinism hypothesis.
Discussion and Conclusion
This study set out to address three main research questions: (1) Do larger welfare states have similar effects on immigrants and natives? (2) Does this relationship vary by spending type? (3) Does this relationship vary by immigrant type? In order to address these questions, our research relies on the literature on the welfare state and poverty and the literature on welfare chauvinism. Each of these approaches provides competing perspectives on how social spending might affect immigrant poverty, relative to native poverty. With immigrants experiencing poverty rates nearly twice that of natives, this study helps illuminate the role of political explanations, while accounting for behavioral and structural explanations (Brady 2019). Moreover, as the number of immigrants in rich democracies grows, the need to incorporate these groups is increasingly relevant.
The analyses indicate that welfare generosity reduces the odds of poverty for immigrants and for natives. Welfare generosity is associated with lower odds of poverty for both immigrants and natives, but effectiveness depends on the area of social spending. We also find evidence of welfare chauvinism, with weaker effects of social spending on immigrants than natives. Our findings further reflect previous research that finds generous welfare states cannot compensate for immigrant disadvantages (Kesler 2015). However, the immigrant penalty depends to some extent on citizenship status and country of origin.
Previous research on the influence of the welfare state on immigrants’ economic outcomes has suggested reasons the welfare state may not be as supportive for immigrants as it is for other demographic segments of the population or the resident population as a whole. These include problems with lack of access and differentiated benefits (e.g., Sainsbury 2006), outsider status (Rueda 2005), hindering integration (Koopmans 2010), and the challenges of navigating an expansive bureaucracy and language barriers (Barrett and McCarthy 2008; Koehn 2009). However, through these analyses it is clear that residing in a country with a strong welfare state, while not eliminating the immigrant gap, may reduce the odds of poverty for immigrants, even if the effects are sometimes dualized between natives and immigrants.
The results also indicate important prospects for policy makers. Increasing the size of the welfare state could greatly improve the life chances for immigrants; however, access is also important. While these analyses consider total social spending, not what is specifically targeted or provided to immigrants, expanded inclusion of immigrants into the welfare state would likely prove beneficial. Gøsta Esping-Andersen and coauthors (2002) argue the welfare state should be altered to provide more services for immigrants, such as vocational and language training classes. Others emphasize extending benefits to immigrants could provide a greater support base for the welfare state (Brooks and Manza 2007).
Future research can extend this study in a few ways. First, a more in-depth decomposition of immigrants by not just citizenship, but also visa category, such as whether one arrived as an economic migrant, refugee, or through family reunification could provide useful insights beyond what is available with LIS data. Second, a more comprehensive analysis of country of origin would prove useful. In this way, not only could the context of reception be evaluated, but also how characteristics of the sending country affect economic incorporation. An interesting application of this would be to consider the colonial relationship between the sending and receiving country. 7 Finally, an analysis that includes additional immigrant characteristics such as language ability or years in host country, neither of which are available in the LIS, could provide additional information on both economic exclusion and access to the welfare state.
The economic exclusion of immigrants is an important problem. Not only does economic exclusion lead to social isolation, it can also produce a number of other negative consequences. A focus on immigrants’ economic incorporation using labor market outcomes cannot fully evaluate economic exclusion. If the goal is to incorporate immigrants into society and the economy, more emphasis should be placed on poverty and the role of the welfare state. The findings presented here indicate that the welfare state can play an important part in helping to reduce immigrant poverty.
Supplemental Material
Supplemental Material - Social Spending, Poverty, and Immigration: A Systematic Analysis of Welfare State Effectiveness and Nativity in 24 Upper- and Middle-Income Democracies
Supplemental Material for Social Spending, Poverty, and Immigration: A Systematic Analysis of Welfare State Effectiveness and Nativity in 24 Upper- and Middle-Income Democracies by Amie Bostic and Allen Hyde in Social Currents
Footnotes
Acknowledgments
We would like to thank a number of folks who made this research possible and who contributed to sharpening the final product. We would like to thank the instructors of the Luxembourg Income Study (LIS) Summer Workshop in 2017, especially Janet Gornick and Piotr Paradowski, who helped hone our skills using LIS data; David Brady; Kieran Healy; Martin Ruef; Steven Vaisey; and two colleagues that provided feedback on the paper ahead of submission: Angran Li and Ryan Finnigan.
Declaration of Conflicting Interests
The author(s) declared no potential conflicts of interest with respect to the research, authorship, and/or publication of this article.
Funding
The author(s) received no financial support for the research, authorship, and/or publication of this article.
Supplemental Material
Supplemental material for this article is available online.
Notes
References
Supplementary Material
Please find the following supplemental material available below.
For Open Access articles published under a Creative Commons License, all supplemental material carries the same license as the article it is associated with.
For non-Open Access articles published, all supplemental material carries a non-exclusive license, and permission requests for re-use of supplemental material or any part of supplemental material shall be sent directly to the copyright owner as specified in the copyright notice associated with the article.