
Abstract
The pitch is a central part of accelerator programs commonly presented with a slide presentation, called pitch deck. This study seeks to understand the ways in which pitch decks are structured. A slide-based approach was taken to describe the structure of 96 pitch decks created at the Start-up Chile accelerator program. Results showed that 7 topics were used in more than half of the pitch decks analyzed (company, team, product, problem, achievements, business model, market) and that certain topics formed sequences that were commonly used across the slide presentations.
Introduction
Business accelerator programs are important institutions in the entrepreneurial ecosystem. They provide training, mentoring, networking, and in some cases, funding for people developing new businesses or products (Sabaj et al., 2020). A central component of these programs is the pitch, a short oral presentation used alongside a slide presentation called the pitch deck. The pitch serves a crucial role for entrepreneurs as they seek traction to make their ideas a reality and, in the context of an accelerator, as they try to capture the attention of potential mentors and stand-out among other trainees. Crafting a good slide presentation is, therefore, also an important tool for entrepreneurs. Yet, in spite of its importance, and the existence of a wide variety of services meant to help entrepreneurs with the perfect pitch deck (such as Pitch.com 1 and EnvatoElements 2 ) and guidelines focused on its structure (Shimasaki, 2020), little attention has been paid to the study of the pitch deck and its uses in real contexts, with just a few exceptions (Spinuzzi et al., 2014, Spinuzzi, Nelson, et al., 2015, Spinuzzi, Pogue, et al., 2015; Williams et al., 2019). Hence, guidelines and services provided to help create slide decks have not been based on empirical knowledge of how the slide presentations are used by entrepreneurs.
Furthermore, even though slide presentations, also called PowerPoint presentations, have become an important part of both professional and academic communication (Gunderman & McCammack, 2010), their characteristics have been mostly studied in relation to academic genres such as scientific conferences (Bucher & Niemann, 2012; Rowley-Jolivet, 2000, 2002, 2004), lectures (Anesa, 2019; Cosgun Ögeyik, 2017; Feng, 2021; Garrett, 2015; Hallewell & Crook, 2020; Zhao & van Leeuwen, 2014; Zhao et al., 2014), student’s presentations (Lindenberg, 2023a, 2023b, 2023c), thesis defenses (Arias et al., 2014; Kmalvand, 2015), and the research pitch (Ruiz-Madrid, 2021). Meanwhile, research related to professional genres has remained primarily in the field of criticism (Tufte, 2006) and design advice (Cavanagh, 2023; Gross & Harmon, 2009; Shimasaki, 2020; Undrill & McMaster, 2013), with only few exceptions (Djonov & Van Leeuwen, 2013; Williams et al., 2019). Thus, the present study aims to contribute to the study of multimodal artifacts in professional genres by analyzing the pitch deck, a type of slide presentation left mostly unexplored.
Following an extensive literature review, the main objective of this study is to describe the structure of the pitch decks used in accelerator programs. To achieve this, the topics used across the slide presentations were identified and their presence and length, in terms of number of slides, was measured, and the presence of recurrent sequences of topics was also identified. This description seeks to be a first step toward a systematic characterization of the pitch as a genre by considering aspects other than the rhetorical content of the oral presentation. At the same time, a detailed description of the structure of pitch decks used in real contexts might serve as an empirical basis to create or improve the guidelines given to the participants of accelerator programs.
Literature Review
Slide Presentations
From a multimodal perspective, slide presentations have been studied from a variety of approaches, such as the result of a social semiotic practice (Zhao et al., 2014), as part of an oral presentation (Bucher & Niemann, 2012; Lindenberg, 2023a, 2023b, 2023c; Rowley-Jolivet, 2004; Ruiz-Madrid, 2021) relating certain aspects of the slides to properties of the speaker or the audience, and as multimodal artifacts in isolation to the oral presentation that usually accompany them. Within these latter studies of slide presentations as multimodal artifacts, different aspects of the presentations have also been explored, with some research focusing on the use of specific visual elements within the slides, for example, the use of fonts (Kmalvand, 2015), images (Feng, 2021, Zhao & van Leeuwen, 2014), and distribution of text (Garrett, 2015). Meanwhile, others have analyzed the slide as a complete unit (Bucher & Niemann, 2012; Rowley-Jolivet, 2002, 2004) or explored the use of slides in relation to the presentation as a whole, as well as the macrostructure of the presentation (Atai & Talebzadeh, 2012; Djonov & Van Leeuwen, 2013; Feng, 2021; Rowley-Jolivet, 2002, Zapletalová, 2014).
One of the most influential studies on the multimodal characteristics of slide presentations has been the one realized by Rowley-Jolivet (2002), who studied the visual characteristics of scientific conferences in the fields of medicine, geology, and physics. Her work not only pioneered the research of slide presentations but also serves as the basis for other researchers who have followed in her steps by analyzing the same genre, scientific conferences, and by using similar, and in some cases the same, categories (Atai & Talebzadeh, 2012; Bucher & Niemann, 2012; Kmalvand, 2015; Zapletalová, 2014). Later on, in her work of 2004, Rowley-Jolivet analyzed in more detail the same corpus of conference presentations according to their visual content, classifying that content as scriptural, numerical, and figurative (ordinary or technical photography) and graphical (conceptual constructed elements, in opposition to naturalistic ones). These categories correspond, at the same time, to three distinctive semiotic modes, as defined by Rowley-Jolivet (2004): linguistic for scriptural elements, mathematical for numerical, and visual for both figurative and graphical elements; these semiotic modes are also used by other authors as a way of simplifying the range of categories involved. Bucher and Niemann (2012), for example, classified the slides into text slides, pictorial slides, or mixed slides, following more closely the classification of semiotic modes proposed by Rowley-Jolivet (2004). The authors (Bucher & Niemann, 2012) analyzed the use of different elements on slides from scientific conferences in the field of economics, natural sciences, and humanities, although their work used this classification only as a starting point to later describe cognitive difference in the reception of the different slides and, therefore, did not expand on the analysis of the slides themselves.
Other studies, such as those by Kmalvand (2015), Zhao and van Leeuwen (2014), and Garrett (2015), instead of analyzing each slide as a whole, put their focus on the elements present inside the slides. Thus, even though Kmalvand (2015) used the same categories developed by Rowley-Jolivet (2002, 2004), the author identified individual visual elements present in the slides used in thesis defenses from the field of applied linguistics, together with other elements, such as tables, fonts, transitions, animations, and the use of color, both in the background and in the text. In most cases, these elements were measured according to their use in the slide presentations studied as a whole and did not consider the number of elements per slide or the structure of the slide presentation. Zhao and van Leeuwen (2014) also analyzed specific visual elements present in the slides of university lectures. However, their research limited itself to the analysis of images classified as photographs, maps, clippings or screen captures, paintings, graphs, cartoons, and others, and, once more, even though the authors researched individual elements present inside every slide, the results were shown only in relation to the presentation as a whole. Garrett (2015), instead, used fewer categories, distinguishing only between the use of images, words, and paragraphs, which he considered as any grouping of words. He also considered the number of these elements used per slide, although he only measured them as a way to explore the correlation within these variables and the number of downloads, or the amount of use, these presentations received by the students, and did not describe the composition of the presentations he analyzed.
Studies that have put a stronger emphasis on the composition of a slide presentation as a whole, and not of the individual slides, have also drawn, in many cases, inspiration from the work of Rowley-Jolivet (2002, 2004). In particular, in her work of 2002, the author (Rowley-Jolivet) analyzed the use of slides in 90 conference presentations, measuring the number of slides per presentation and the average periodicity of the projection of every slide, as well as describing the use of color, sequences, and type of slides—this last element being explored in more detail in her later work (Rowley-Jolivet, 2004). The presence of sequences, which are defined by Rowley-Jolivet as “semi-autonomous segments from the prior and subsequent discourse” (2002, p. 37), marks a step toward the description of the structure of a slide presentation, instead of describing the slides or their internal components as isolated elements. These sequences were then analyzed in terms of their recurrence as well as by the use of specific visual elements or by the change of certain linguistic or visual characteristics, such as the use of discourse markers. One sequence described, for example, was Patient and tumor characteristics, which consisted of two tables, one displaying the information of the patients followed by a second one with the information of the tumors. However, the author never explicitly states if these tables are presented in individual slides or side by side, something that limits our understanding of these sequences. A second limitation, as even Rowley-Jolivet herself (2002) notices, is not having considered the field of the presentations, something that Rowley-Jolivet hypothesizes might be linked to the presence of these sequences. The exploration of sequences has been left unexplored by Rowley-Jolivet in her later work, as well as by the studies by other authors who expanded on her work. Instead, other authors (Atai & Talebzadeh, 2012; Djonov & van Leeuwen, 2013; Feng, 2021; Zapletalová, 2014) placed their attention on either the recurrent function of certain slides or the macrostructure of the presentations as a whole, not considering if that structure is materialized through the use of certain sequences of slides or specific elements.
Other studies, meanwhile, have reported on specific structural characteristics of slide presentations, such as the common use of a title slide to start a presentation as well as the use of specific types of final slides in presentations from academic and professional settings, which is mentioned by Atai and Talebzadeh (2012) as well as Djonov and Van Leeuwen (2013), Zapletalová (2014), and Zhao et al. (2014). First, a title slide is an introductory slide that presents the title of the presentation as well as information regarding the presenter such as name and affiliation (Atai & Talebzadeh, 2012). As Zhao et al. (2014) notice, a title slide is automatically generated as a starting point when creating a new slide presentation using PowerPoint 2003 or 2007, something that continues to be the case with more recent versions of the software and that could be a factor in its widespread use. Meanwhile, the use of the final slide of a presentation has been described as taking diverse functions by different authors and, contrary to the title slide, there has been no particular template linked to it. One such use is as a thank-you slide described as a slide that presents a message of gratitude toward the audience, as well as repeating the name and affiliation of the presenter in the case of conference presentations (Atai & Talebzadeh, 2012), although they have also been described as a part of both academic lectures and corporate presentations (Djonov and Van Leeuwen, 2013). Another type of final slide has been described as presenting a goodbye phrase (Zapletalová, 2014) that is described to be also present in conference presentations. Finally, Djonov and Van Leeuwen (2013) also described the use of a final slide to present credits, in the case of corporate presentations, or references to key readings, in the case of lectures, although no further characteristics were mentioned.
One aspect that these articles have in common, regardless of the function described for the last slide or the genre of the slide presentation, is that they all have described the initial and final slides in isolation to the overall structure of the presentation and, in some cases, by only mentioning them instead of describing the overall structure of the slide presentation (Zhao et al., 2014), while in other cases making an explicit distinction between them and the rest of the structure of the slide presentations (Atai & Talebzadeh, 2012; Djonov & Van Leeuwen, 2013; Zapletalová, 2014). Thus, Djonov and Van Leeuween (2013) make the distinction between the title and end slides and what they call content slides, which are all the slides that form the presentation. Meanwhile, Zapletalová (2014) distinguishes between scientific and nonscientific slides in her analysis of conference presentations, with the title and final slides being part of the latter and, therefore, being excluded when comparing the structure of the slide presentation to that of a research article. Although highlighting the use of these initial and final slides allows us to understand the similarities of the use of slide presentations in different genres, their description as isolated elements and exclusion from the macrostructure of the presentation is also problematic as it gives a distorted image of how these genres are built.
The macrostructure of slide presentations has been studied only in conference presentations as a reflection of the research article (Atai & Talebzadeh, 2012; Rowley-Jolivet, 2002; Zapletalová, 2014). As already mentioned, Rowley-Jolivet (2002) studied the used of specific sequences and not the macrostructure of conference presentations, but the author was the first to present the possibility of a conference presentation having a similar structure of that of a research article, something that served as a jumping point for other authors. Atai and Talebzadeh (2012) and Zapletalová (2014), for example, continued the work of Rowley-Jolivet (2002) by analyzing the same genre, conference presentations, as well as by using similar categories, and expanded it by including a macro- and micro-structural analysis of these presentations. First, Atai and Talebzadeh (2012) were able to describe the macrostructure of conference presentations as following the same structure as a research article (introduction, methods, results, and discussion), as described by Swales (1990), noting that introduction and results were the sections with the largest number of slides, representing together more than half of the total number of slides of the presentations. Later on, Zapletalová (2014) would also confirm the use of the same structure, although she did not add more details regarding the distribution of the slides, focusing instead on the use of specific types of slides across the presentation.
Feng (2021), instead of describing the macrostructure of slide presentations, identified the structural moves of what he called instructional PowerPoints used in linguistic courses from Peking University. The author studied 33 slide presentations created by 6 award-winning professors of a contest for best use of slide presentations hosted by the university. He identified 8 moves: Headline, Content, Lead-in, Concept-Definition, Explanation, Exemplification, Exercise-Answer, and Assignment. Similar to the use of a title slide described by other authors (Atai & Talebzadeh, 2012; Djonov & Van Leeuwen, 2013; Zapletalová, 2014; Zhao et al., 2014), Feng (2021) describes the use of the Headline move on the first slide of the presentations to present the topic of the lecture, although it can also be seen at the top section of a slide, in which case it is described as a second-level Headline. In this second case, Headline is also described as being commonly used together with the Content move in a single slide, but the distribution among slides is not further explained for the other moves. The author also analyzed the use of images and their relation to the text, but did not relate them to any specific move. Moves were also not organized into any particular macrostructure; instead they were only described in accordance to their presence or absence within the entire presentation.
The Pitch Deck
The pitch deck, as described by Spinuzzi, Nelson, et al. (2015), is a slide presentation that usually accompanies a business pitch. Yet, even though the pitch has been widely researched (Sabaj et al., 2020), the pitch deck has been the focus of only a few studies, which have explored its evolution (Spinuzzi et al., 2014; Spinuzzi, Nelson, et al., 2015; Spinuzzi, Pogue, et al., 2015) or its reception (Williams et al., 2019), describing the pitch deck only in relation to them. Thus, Spinuzzi et al. (2014, Spinuzzi, Nelson, et al., 2015, Spinuzzi, Pogue, et al., 2015) investigated the role of the different genres used throughout an accelerator program in the making and remaking of the pitch deck. Through an ethnographic approach, they were able to document the different genres involved in the creation of a pitch and pitch deck (Spinuzzi et al., 2014), the reuse of text from other documents in the editing of the pitch deck (Spinuzzi, Nelson, et al., 2015), and the motivation behind changes in the pitch decks throughout the training process (Spinuzzi, Pogue, et al., 2015). Meanwhile, Williams et al. (2019) analyzed the reception of the visual characteristics of a small group of pitch decks. Attributes, such as color, typography, iconography, and organization, were not described, but scored by a group of experts through a rubric to determine the level of presence and success they had in every slide presentation.
Spinuzzi, Pogue, et al. (2015), in particular, mentions the structure of the pitch decks when describing its changes in four pitch decks that were created and edited through a South Korean training program. In this study, two versions of a pitch deck were compared and described in accordance to the explicit feedback given by the trainers, which related to the structure, claims and evidence, and the engagement of the decks. Slides were identified by the title used on each one of them, but the structure of the pitch deck was only described in terms of its changes, which were considered as additions, cuts, or moves of the slides. Results showed participants addressed feedback only partially. In the specific case of structural changes, three of the four presentations examined added new slides, making addition the most common change. In contrast, only a few slides were moved, making it the less common of the changes. When describing the overall structure of the pitch decks, the authors only mentioned that participants followed very closely the template given by the training program they were part of, but no further details were given other than the names of the slides that had some change, and the structure of the template was never presented.
The structure of pitch decks from the biotechnology field has been described in detail by Shimasaki (2020) in his manual Biotechnology Entrepreneurship: Leading, Managing, and Commercializing Innovative Technologies, although no research is linked to this structure. According to his book, a pitch deck should be composed of 18 topics, with each topic being at least one slide long. This structure is preceded by a title slide, just as mentioned already in other studies (Atai & Talebzadeh, 2012; Djonov & van Leeuwen, 2013; Zapletalová, 2014; Zhao et al., 2014). The oral presentation is then meant to begin with a slide stating the company purpose, history, and mission, and finish with a thank you and Q&A slide, also reminiscent of what has been described by other authors (Atai & Talebzadeh, 2012). After the oral pitch is over, the pitch deck could continue with two final topics meant to foresee and respond to likely questions. One of these topics could be a slide presenting potential risks; meanwhile, the other could be one or more slides supporting the claims throughout the presentation. This structure is defined by Shimasaki (2020, p. 326) as a “Master Slide Deck,” which could then be adapted to better fit the audience and time constraints of the different situations where it might be used. A shorter pitch deck, for example, is described as being composed of 10-12 slides and presented in up to 10 minutes, although the author does not explain which topic, of the 18 presented, should remain and which ones should be skipped.
The macrostructure of the pitch, in contrast, has been described by Daly and Davy (2016) through the analysis of 13 winning pitches from the reality TV program Dragons’ Den. The authors described the macroorganizational structure of these pitches as consisting of 10 stages: Greeting the audience; Identifying oneself and one’s company, product, or service; Announcing the amount of investment required; Explaining/presenting the product or service; Presenting the history/achievements of the company and/or founder; Describing future plans; Presenting the target customer; Recapitulating and developing; Thanking the audience; and Expressing a willingness to answer questions. The authors found that most of the pitches analyzed used similar sections, although they appeared in different positions. Of these 10 sections identified, 4 were described as obligatory and the other 6 as optional. The obligatory sections were: identifying oneself and one’s company, announcing the amount of investment required, explaining/presenting the product or service, and describing future plans. These results, although an important approximation to the study of the pitch and the structure of the pitch deck, have some limitations related to the origin of the sample, which represents a very specific use of the pitch as a televised spectacle and, therefore, reflects the demands and restrictions of a TV show. Furthermore, the pitches presented in Dragons’ Den do not use a slide presentation, which differs greatly from the pitches usually seen in accelerator programs or pitching competitions. Thus, although this work is an important part of understanding the structure of the pitch, it might not be representative of the structure of pitches used in other contexts.
Methodology
This article aims to answer the question, How are the pitch decks structured? To answer this, the topics used in the slide presentations created by participants of the accelerator program Start-up Chile were identified and measured in terms of their presence in the pitch decks and their length, measured in number of slides per topic. Also, the recurrent use of groups of topics was measured and described as sequences.
Data collection
Data were collected directly from Start-up Chile, a state-funded accelerator program. Start-up Chile was launched in 2010 (Gonzalez-Uribe & Leatherbee, 2018) and, at the point of contact, consisted of three programs: S Factory, Seed, and Huella. Data came from the 17th and 18th generation of the Seed program, Start-up Chile’s main program at the moment. These generations were composed of 153 companies from a variety of sectors and countries that participated between 2017 and 2018. Because of the international nature of the program, all documents produced throughout the program were in English.
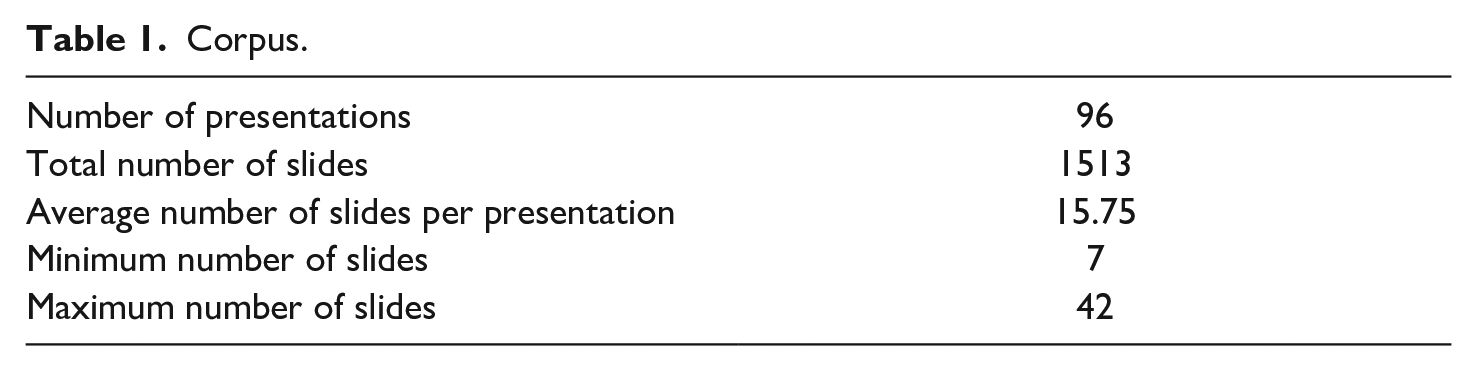
The corpus of this study consists of 96 pitch decks, with a total of 1513 slides. The pitch decks collected correspond to the final version of pitches produced by participants. Each final version is presented in 3 minutes at Pitch Day, an event realized after participants receive different forms of training and feedback, and where a group of finalists are selected to be part of Demo Day, an event that grants companies media coverage, as well as the opportunity to receive further funding and mentoring.
As seen in Table 1, presentations varied, with the shortest pitch deck being composed of only 7 slides, whereas the longest deck used 42 slides. Even in the extreme cases, the presentation could not last longer than 3 minutes, which meant an average time of 4 seconds per slide in the case of the longest presentation.
Corpus.
Data Analysis
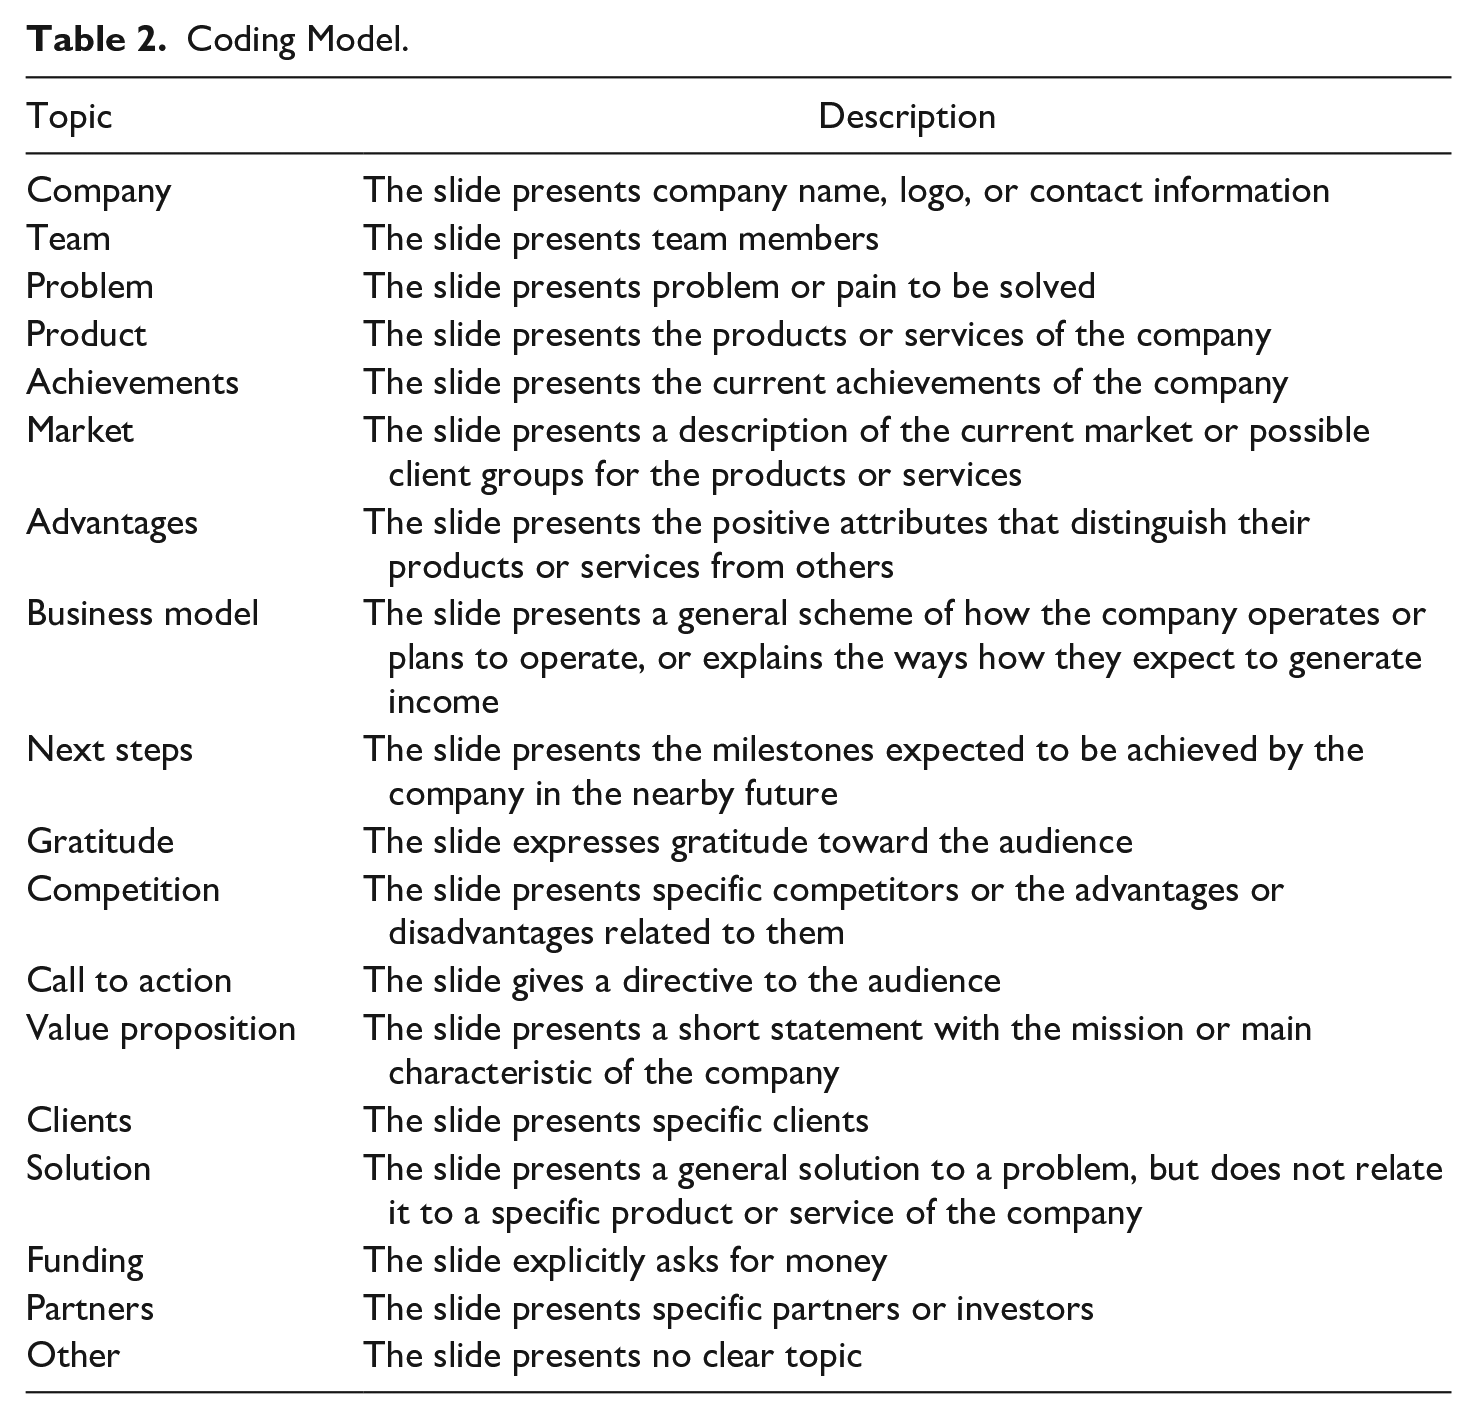
The analysis model was created through a mixed approach that considered top-down and bottom-up stages as explained by Biber et al. (2007). This meant the use of preexisting categories to create an initial model that was later tested and adjusted by modifying, adding, or deleting categories to better reflect the characteristics of the pitch decks being analyzed. A first step consisted, then, in using as a starting point the topics taught by Start-up Chile in what they call SUP Academy, which consisted of 11 main topics and 5 optional ones. Afterward, these categories were tested and adjusted by two independent coders who analyzed a third of the corpus. The final model consisted of 18 topics described in Table 2. These final categories were later applied by four coders to the entirety of the corpus.
Coding Model.
To ensure the reliability of the results, the four coders were first trained on the model and later tested by analyzing eight presentations. The analysis consisted of 66 observations that were used to triangulate the level of agreement between the coders through Fleiss’s kappa (Torres Gordillo & Perera Rodríguez, 2009). The coders achieved a kappa of 0.75, right at the limit between good and excellent. Because the level of agreement was high, the corpus was analyzed by the four coders independently, and to ensure further reliability, two meetings were conducted where the four coders would present difficult cases and come to agreement.
Results
The analysis showed that of the 18 topics identified, only 7 were used in more than half of the presentations. Meanwhile, the remaining 11 topics were used in 40 or fewer presentations (Table 3).
Presence of Topics in Pitch Decks.
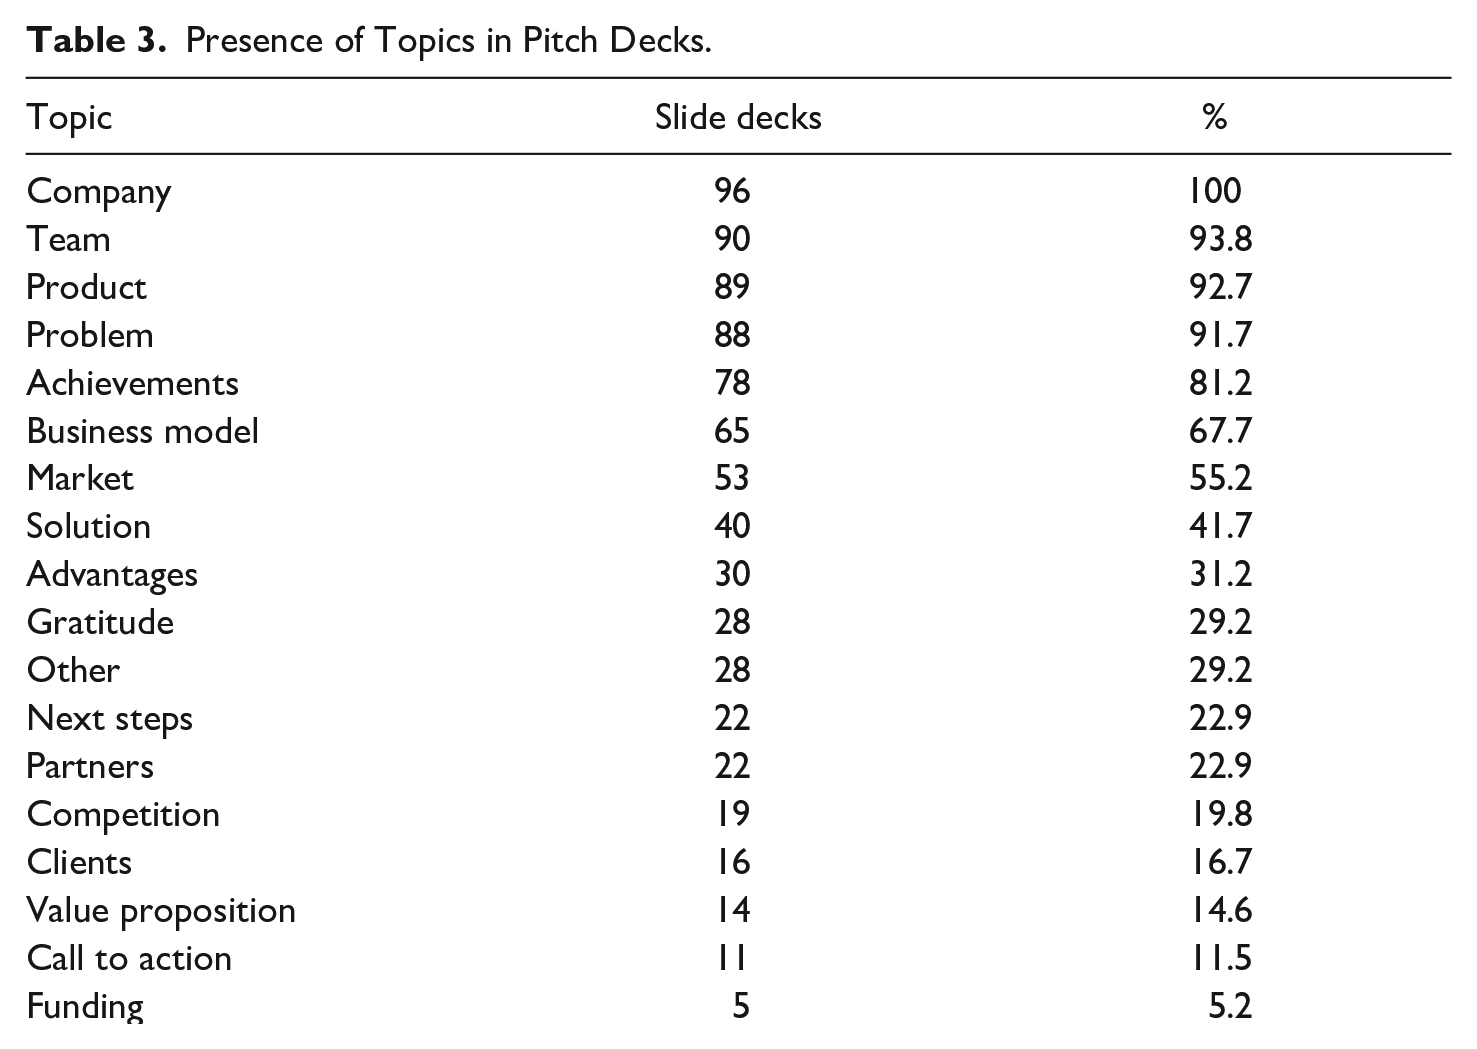
The topics present in the pitch decks (Table 3) show some discrepancies with the template given by Start-up Chile. Firstly, even though the most commonly used topics (company, team, product, problem, achievements, business model, and market) across the pitch decks were similar to those taught by the accelerator program, other topics considered mandatory in the template were barely used by the participants in their pitch decks. Funding, for example, was present in only 5 pitch decks even though it is taught that pitch decks should end with an explicit petition for funding. Instead, it would be more common to see pitch decks use slides to ask the audience for an action other than investing, such as visiting their website or downloading the app, something that was absent from the structure given to participants. Meanwhile, topics such as presenting the advantages of the company or product, something that is described as presenting their “special sauce” in the template, is a topic taught as optional to the participants. Yet, it was present in almost a third of the presentations (31.2%), which made it a more recurrent topic than others being taught as mandatory, such as presenting the competition, which even though it is taught to be part of the main structure of the pitch deck was only present in 19.8% of the pitch decks.
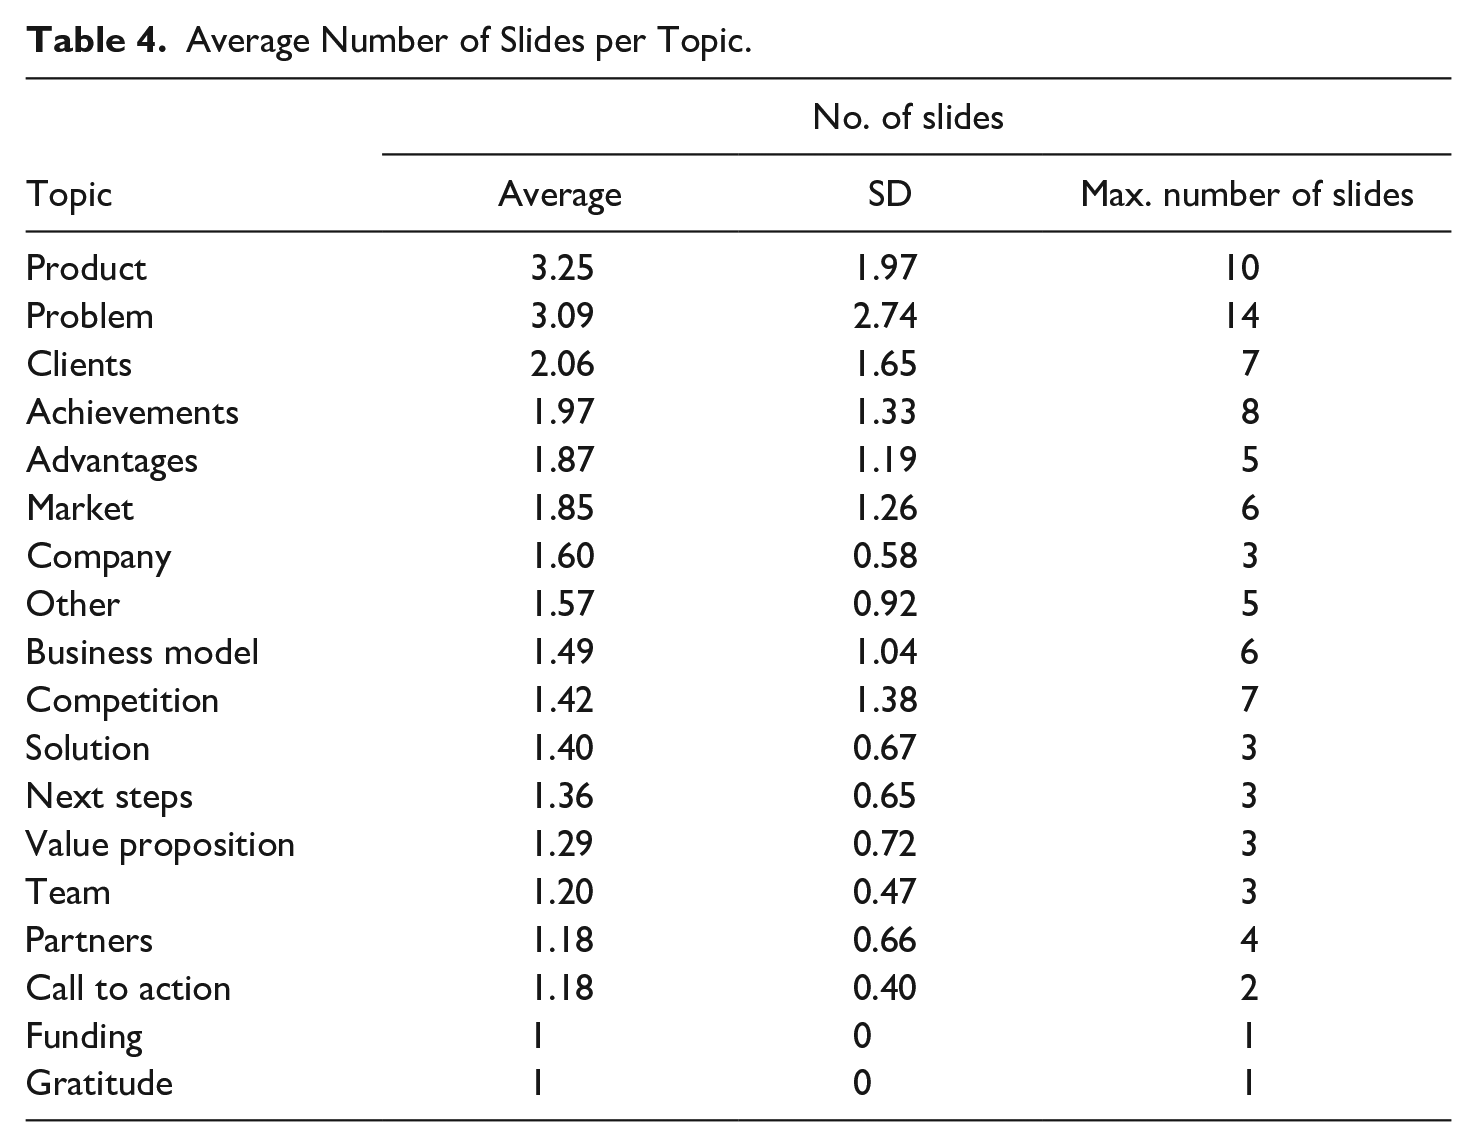
When considering the extension of the topics, it is also possible to see how diverse the structure of the pitch decks can be. Most topics, on average, have a length of 1, 2, or 3 slides, but these numbers can vary greatly from presentation to presentation as one can see in Table 4. Such is the case for the topic problem and product, which in one case amounted to 14 slides and 10 slides, respectively. Furthermore, both the topic problem and product have a higher average number of slides than the rest of the topics, being the only ones that measured on average 3 slides per presentation. This makes them the lengthiest topics, as well as one of the most recurrent, with both being present in over 90% of the pitch decks. In contrast, the topic company, although it is present in all the slide decks, is shorter, accounting on average 1.6 slides, and having a maximum of 3 slides. Meanwhile, call to action and funding are at the same time, the topics that appear in the fewest number of presentations (Table 3) and, when they do appear, are also one of the shortest, accounting in most instances for only one slide.
Average Number of Slides per Topic.
Company was the only topic present in every single presentation; it was also the opening slide of 94% of the presentations (90 of the 96 presentations analyzed). This, although not exactly the same, follows closely the template given by Start-up Chile, which advises participants to start their pitch decks with an elevator pitch, a short presentation of the company. Because the elevator pitch is most commonly a purely oral presentation, it is not surprising that instead of using a slide titled “elevator pitch” participants would use a slide that presents the company, which is one of the aims of the elevator pitch.
In order to relate the appearance of topics to the structural organization of the pitch decks, the frequency a topic was followed by another was calculated. As one can see in Figure 1, the most common cases are represented by circles connected by arrows, which show the order of the sequence. The frequency of the continuations, as seen in the body of the arrows, is expressed in fractions calculated over the complete set of continuations for each node. The more common the appearance of two topics together, the closer to one that value becomes.
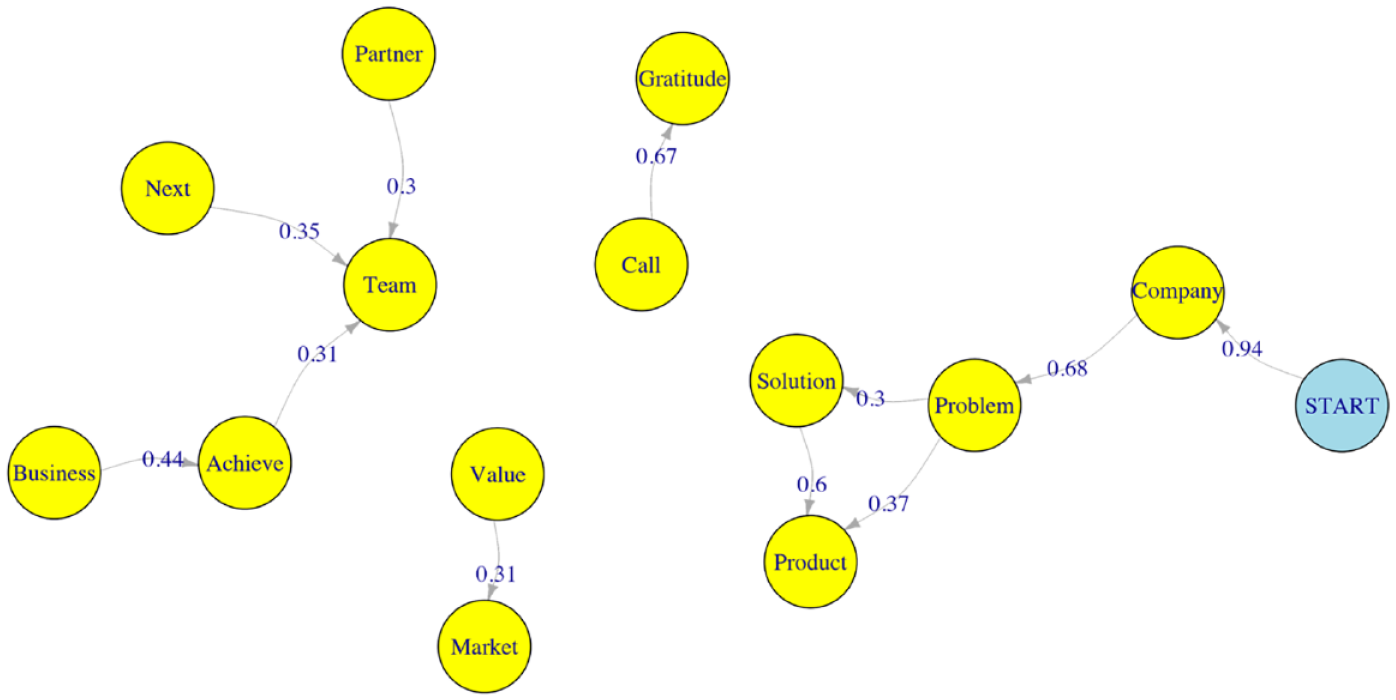
Most frequent sequences of topics (continuation threshold set to 30%).
Figure 1 shows that following the topic company, the structure of the pitch decks departs from the template given to the participants of the program. The structure of the template given to participants advises presentations to continue with a slide presenting the key numbers of the company, here called achievements, followed by the market. However, results show that company would be more typically followed by slides presenting the problem the company is trying to solve; this occurred in 68% of the times company was present in the pitch decks. The topic problem would then be followed either by slides presenting a solution in 30% of the case, or by slides presenting the product, which would serve as a specific solution to the problem, in 37% of the instances the topic problem was presented, which would then in turn be followed by product in 60% of the cases. This means the structure of the pitch decks would usually begin by presenting the sequences company-problem-product or company-problem-solution-product, leaving the achievements and market for later in the presentation.
Meanwhile, the topics achievements and market, instead of following the topic company or preceding the problem, formed part of other recurrent sequences (Figure 1). Achievements, for example, was part of the sequence business model-achievements-team, while market followed the business plan in 44% of the instances when the business plan was presented.
Another sequence that could be found across the pitch decks was call to action-gratitude (Figure 1). This sequence was formed in 67% of the cases when the topic call to action was presented, which means that in more than half of the instances participants asked the audience to realize a specific action, something that could vary from looking up their social media accounts to invest in the company; this would be followed by a slide expressing thanks.
In summary, the structure of a pitch deck would be composed typically by 7 main topics (company, team, product, problem, achievements, business model, and market), which would vary in extension from 1 up to 3 slides, amounting to around 16 slides per presentation. The slide deck would start by presenting the company and would be followed first by the problem and secondly by the product, although the problem could also be followed by the solution and then the product. The rest of the topics could then vary in order, but other sequences are also common, such as business model-achievements-team or call to action-gratitude.
Discussion
The structure of the pitch decks produced during the accelerator program Start-up Chile confirm some of the characteristics already described by other guides and studies, while at the same time presenting very distinct differences. One such difference is the number of slides used per presentation, which contrasts with the advice given by Shimasaki (2020) that states pitch decks meant to be presented under 10 minutes should contain only 10 to 12 slides. Meanwhile, the presentations analyzed here had on average 16 slides even though they were meant to be presented in 3 minutes. This means that the pitch decks were not only longer, but that each slide would need to be presented much faster, in around 11 seconds, than the 60 to 50 seconds given to each slide by Shimasaki (2020).
The structure of the pitch decks also departed in some ways from the structures presented in other studies. When describing the structure of the pitches presented in the TV show Dragons’ Den, for example, Daly and Davy (2016) distinguishes between greeting the audience, as a first stage, and identifying oneself and one’s company, which would follow as a second stage. Similarly, Shimasaki (2020) recommends the structure of a pitch deck should begin by using a title slide, which is meant as a prelude to the actual oral presentation, followed by a company slide that would serve as the starting point of the oral presentation. Likewise, description of other types of slide presentations have also identified the use of a title slide, which is considered as an element detached from the main presentation (Atai & Talebzadeh, 2012; Djonov & Van Leeuwen, 2013; Zapletalová, 2014; Zhao et al., 2014), something that is also reflected in the works of Daly and Davy (2016) as well as Shimasaki (2020). In contrast, none of the pitch decks analyzed in this study used a title slide that could be considered as disconnected from the rest of the presentation. Instead, the pitch decks would skip the use of a separate title slide and usually begin by presenting the company, something that follows partially what has been described by these other works (Daly & Davy, 2016; Shimasaki, 2020). The presence of the company at the beginning of the pitch deck would, in a sense, merge the use of a title slide with the company slide, as described by Shimasaki (2020), by serving both as the title of the presentation and as a business card showcasing the main information necessary to identify the company.
Another result that follows only partially the work of previous authors was the use of the topic problem. For instance, the recurrent presence of the topic problem among the pitch decks departs from the structure described by Daly and Davy (2016), in which the topic is completely absent. Meanwhile, this result follows closely the work by Shimasaki (2020), which not only advises the presentation of a problem but also suggests starting the pitch deck with the sequence company-problem-product or solution, the same sequence that is commonly used among the pitch decks produced by participants of Start-up Chile.
The use of a slide expressing gratitude, although not very common in the pitch decks analyzed, has also been described in other studies about slide presentations (Atai & Talebzadeh, 2012; Djonov & Van Leeuwen, 2013). Similar to the use of a title slide, a thank you slide is considered as a slide separated from the main structure of a presentation that ends a slide presentation. In opposition, Shimasaki (2020) instructs the inclusion of a thank you slide as part of the structure of pitch decks for companies in the biotech field, and Daly and Davy (2016), although not referring to slide presentations, also recognize thanking the audience as part of the structure of the pitches presented in Dragons’ Den. In both cases, the existence of the topic gratitude is not related to the ending of the presentation, instead it is followed by other topics related to give further information to the audience, such as starting a Q&A section. In the case of the present study, results showed the use of a slide expressing gratitude tended to follow slides requiring an action from the audience, something that seems to also establish it as part of the structure of the pitch deck and not as an element isolated from the rest of the slide presentation.
Conclusion
The pitch decks analyzed, although diverse, share similarities in their structures. Firstly, the slide presentations focused on the use of the same seven main topics. The length of these topics too, even though varied across the pitch decks, showed how certain topics tended to be longer than others, with topics such as product and problem being the lengthiest; meanwhile, other topics equally as common, such as team, were presented using only one slide. Finally, the organization of the topics also shared similarities. For example, most pitch decks began by presenting the company and then continued by showing the problem the company was trying to solve.
The structure of the pitch decks analyzed in this study seem to confirm some aspects of the structure taught by Shimasaki (2020). Not only that, but the results of this study resemble the guidelines given by Shimasaki more closely than the structure of pitches from Dragons’ Den (Daly & Davy, 2016). Thus, these results seem to mark a distinction between the structure of televised pitches and pitch decks used in accelerator programs. These differences could be further explored by analyzing not only the pitch decks but also the oral pitch that is used when presenting them, as well as by describing the structure of pitches used in different context such as pitching competitions.
The pitch decks in the corpus were the final product of the mentoring program of Start-up Chile. As such, these slide presentations represent an example of the use of pitch decks by trained members of this discourse community and can, therefore, serve to guide new members into the creation of their own decks. Hence, based on the results already discussed, pitch decks should focus on presenting the topics: company, team, product, problem, achievements, business model, and market. Pitch decks should also tend to allocate more slides into the presentation of the topics product and problem, although, in general topics should be presented using few slides, between one and three. In terms of the order, pitch decks should begin by presenting the company and then following it by the problem and the product presented as the solution given by the company to resolve it, or by a general solution that is then followed by the product. In case of asking the audience to perform an action, the advice would be to then follow it by thanking them for being part of the presentation. Finally, in terms of length, the pitch deck should try to remain closer to 15 slides for a 3-minute presentation.
The present study has some limitations that need to be explored in future work. As already mentioned, one limitation is its focus on a very specific context, namely, the use of pitch decks in accelerator programs. Thus, exploring the use of pitch decks in other contexts could give a better understanding of the similarities, as well as the differences, pitch decks have depending on when they are used. Similarly, including other factors such as the stage of the product, industry, and sales of the company and success of the pitch could give a better understanding of the use of a pitch deck. At the same time, studying the pitch deck together with the oral presentation that usually accompanies it might give us a better perspective of how pitch decks, and the pitches as a whole, are structured.
Lastly, the results of this study seek to contribute to the understanding of slide presentations and of the pitch, in particular, as multimodal genres. As seen in the literature review, slide presentations have been studied mostly in academic contexts and have described the structure of these presentations only tangentially. Thus, this research hopes to serve as a novel approach into the study of slide presentations by putting the focus on an aspect little explored, the overall slide structure of the presentation.
At the same time, these results have potential pedagogical implications. They could help to create better guides and templates crafted with a deeper empirical understanding of how pitch decks are used in real contexts. This could help participants of accelerator programs in the construction of their pitch decks, as well as help tutors in giving recommendations tailored more closely to the actual structure used by participants of accelerator programs. This is something that could then be perfected further by understanding the differences in the structures of successful and unsuccessful pitch decks. Having better guidelines available could then help improve the quality of the pitch decks, and the overall presentation, and by extension help entrepreneurs get the resources needed to make their ideas a reality.
Footnotes
Declaration of Conflicting Interests
The author(s) declared no potential conflicts of interest with respect to the research, authorship, and/or publication of this article.
Funding
The author(s) received no financial support for the research, authorship, and/or publication of this article.