
Abstract
Advertisers sometimes use value appeals that are adapted to their specific cultural audience. After a meta-analysis in 2009 showing cultural value adaptation to be effective, new studies have been published and the advertising landscape has rapidly changed. The current meta-analysis involving about 120 comparisons of adapted versus unadapted value appeals on persuasion and ad liking presents three results. First, cultural value adaptation effects in advertising exist (persuasion: mean r = .049; ad liking: mean r = .055). Second, these adaptation effects have diminished over time (correlations between year of publication and persuasion effects: r = −.152; between year of publication and ad liking: r = −.185). Third, the adaptation effects do not allow for dependable advice for practitioners. We discuss these results in the context of globalization and the standardization-adaptation debate.
Introduction
Cultural values, which are important values for specific cultural groups, such as harmony for Chinese and independence for Americans, play an important role in business communication. Values have been used as a lens to better understand communicative practice (e.g., direct mailing in Graves, 1997; business letters in Park et al., 1998) and organizational behavior (e.g., employee satisfaction and commitment in Kirkman & Shapiro, 2001) in different cultural settings (for a broad overview, see Taras et al., 2010). In intercultural contact between people from different backgrounds, the role played by values has been examined in different areas, such as leadership styles (Aritz & Walker, 2014), business negotiations (Spijkman & de Jong, 2023), or workplace conflicts (Brew & Cairns, 2004).
A prominent research interest related to cultural values in business communication concerns the effects of adapting communication to the cultural values that are important to a given audience. In a more general way, adapting messages to the characteristics of its audience has been shown to increase the persuasive capacity of that message (e.g., Campbell & Kirmani, 2000; Wheeler et al., 2007). Studies show that adapting messages to the demographic, such as age and gender (Yoon et al., 2007), and psychological characteristics of the target group, such as cognitive capacity, lifestyle, and values (Campbell & Kirmani, 2000; Wheeler et al., 2007), increases persuasion and decreases resistance. Perhaps the most important characteristic to adapt to are the audience’s values, as these are important, guiding principles in life that are expected to have a large influence on behavior (Rokeach, 1973). It can therefore be persuasive to appeal to an audience’s important values in advertising. For instance, an advertisement for a watch can claim to bring the value uniqueness closer to the reader. One can predict this advertisement to be more persuasive to a reader who finds being unique important than to a reader who does not strive toward uniqueness.
In their meta-analytic review of empirical studies, Hornikx and O’Keefe (2009) demonstrated that adapted cultural value appeals are, generally, more persuasive and better liked than unadapted cultural value appeals. The current paper updates their meta-analysis by including literature published after the initial search, making it possible to review the state of affairs of 25 years of empirical research in this domain. In addition, our meta-analysis considers two important issues. First, against the backdrop of an ongoing process of globalization affecting consumers’ identity and preferences (Arnett, 2002; Craig & Douglas, 2006), we examine whether the effects of cultural value adaptation diminish over time, and we compare the potential role of globalization as driver of this effect against a general “decline effect” that is regularly found in empirical research (e.g., Protzko & Schooler, 2017). Second, we report not only an estimation of the population effect of cultural value adaptation with a confidence interval but also provide prediction intervals, which allow us to assess the practical value of cultural value adaptation in relationship to the costs associated with adaptation.
Cultural Value Adaptation
Values such as freedom and harmony are universal, meaning that they are attractive to people all over the world (Schwartz, 1992). Yet, when the accomplishment of one value collides with another, different value hierarchies arise in different cultures (Hofstede, 2001). While there will always be individual differences within a culture, value hierarchies are the core element of culture (Fiske et al., 1998; Smith & Schwartz, 1997) and overarch these individual differences in a collective programing of the mind. This makes members of one culture distinguishable from members of another culture (Hofstede, 2001; Lehman et al., 2004). The level of culture thus lies between the individual and the universal level. In order to explain the differences between cultures, Hofstede (2001) developed five cultural value dimensions: individualism versus collectivism (the emphasis on self-interest of the individual or on collective goals of the group), masculinity versus femininity (the distribution of gender roles), high versus low uncertainty avoidance (the tolerance for unstructured situations), large versus small power distance (the acceptance of inequality in power), and short versus long term orientation (the focus on the long or the short term). These dimensions allow researchers to classify and compare cultures.
Because cultures differ from each other in their value hierarchies, that is, the relative importance they ascribe to different values, many researchers claim that advertisements are more persuasive when they appeal to the important cultural values of a certain culture (e.g., de Mooij, 2013). One can therefore expect an ad focusing on freedom be more persuasive to consumers in an individualistic culture, such as the United States, than to consumers in a collectivistic society, such as Korea. On the other hand, one can expect an advertisement appealing to collectivistic values, such as group harmony, to be more appreciated in Korea than in the United States.
Over the past 25 years, the effectiveness of cultural value adaptation in advertising has been studied extensively in experimental research (e.g., Han & Shavitt, 1994; Hoeken et al., 2003; Lee & Heo, 2016). The question in these studies is whether advertisements appealing to important cultural values are more persuasive than advertisements appealing to other, less important values. The general research paradigm in these studies presents two advertisements differing in their cultural value appeal to participants from two cultures that have contrasting value hierarchies. In Han and Shavitt (1994), for instance, one ad appealed to individualism and the other to collectivism; participants were American or Korean. One advertisement (e.g., appealing to individualism) invoked an important cultural value in one culture (American participants) and the other (e.g., appealing to collectivism) appealed to an important value in the other culture (Korean participants). Each advertisement is thus adapted to one culture but unadapted to the other. These studies then compare the degree of ad liking and persuasion for both advertisements in both cultures.
These kinds of experimental studies were summarized by Hornikx and O’Keefe (2009). Their meta-analytic review showed that advertisements appealing to important cultural values are more persuasive (mean r = .073, d = 0.146, p = .001, 95% CI [0.029, 0.118], k (number of comparisons) = 67, N (total number of participants involved in these comparisons) = 6,755) and better liked (mean r = .082, d = 0.165, p = .002, 95% CI [0.029, 0.135], k = 66, N = 6,091) than advertisements appealing to unimportant values. These findings thus show the positive effects of cultural value adaptation in advertising. However, this effect was not present under all circumstances: the positive effects of adaptation on persuasion were only present in studies with North American and Asian participants, and the ad liking effect was only found in studies conducted in Asia (Hornikx & O’Keefe, 2009). No adaptation effects were present in studies with participants from Europe or from Central and South America.
The meta-analysis reported here updates Hornikx and O’Keefe’s (2009) review by including studies reported subsequently. This more comprehensive meta-analysis includes studies reported from 1994 to 2018, providing an analysis of 25 years of research. Our first research question was whether this more complete meta-analysis will find the same adaptation effect:
RQ1 Are advertisements adapted to match cultural values more persuasive and better liked than advertisements unadapted to cultural values?
The Role of Globalization on the Adaptation Effect
In recent years, the question of whether advertising adaptation is more fruitful than standardization has become more pressing as the advertising landscape has drastically changed (e.g., Hirsh et al., 2012; Wong et al., 2015). Researchers have argued that changes in the advertising landscape affect consumers’ preference for cultural values, and therefore, for value appeals in advertising. Below, we first show that values may change over time, and subsequently discuss theory and research on the accelerating role of globalization on value change.
There is a long interest in how values change as a result of socioeconomic developments in countries. Theoretically, both ends of the continuum have found proponents, namely those arguing for convergence of values, and those believing in the persistence of traditional values (see Inglehart & Baker, 2000). Empirical analyses of large datasets covering different periods of time provide evidence for both schools of thought: some values have indeed been found to converge as a result of modernization, but there is also evidence for persistence of value preferences over time (e.g., Inglehart & Baker, 2000; Kaasa & Minkov, 2020). Taras et al. (2012) showed in their meta-analysis that there is a decreasing predictive power over time of Hofstede’s value dimension on societal indicators such as divorce rate and human development. For advertising research investigating the impact of adapting cultural values on persuasion, potential change in cultural value preferences is important as such change may undermine the adaptation effect.
An accelerator of changes in value preferences is globalization. Globalization in a psychological sense, the process by which people in cultures become more similar through contact, has always existed, but advances in media (television and internet) have intensified this process. Arnett (2002) argues indeed that global media play a pivotal role in processes of globalization. On an individual level, globalization increases people’s development of bicultural identities, “in which part of their identity is rooted in their local culture while another part stems from an awareness of their relation to the global culture.” (Arnett, 2002, p. 777). Mass media distribute ideas, products, and images across different countries (see Appadurai, 1990). They expose people to different cultures, and give them opportunities to become more bicultural.
With the rise of the internet and the increase of global travel, the world has become more globalized, blurring the divisions and barriers between cultures (Craig & Douglas, 2006). Craig and Douglas (2006, p. 331) argue that, as a consequence of intercultural contact, “values, attitudes, and/or behavior are becoming more amorphous and continually changing, particularly with regard to other cultures and cultural values.” These developments might reduce the advantages of advertising adaptation (Okazaki & Taylor, 2006). It might be that globalization has caused the benefits of adaptation to become so small that advertisements can better be standardized, meaning that the same advertisement can be used in different countries. Hornikx and O’Keefe (2009, p. 56) noted that “even the currently observed small persuasive advantage of culturally adapted value appeals may well diminish in the future.” As a case in point, Zhang (2010) demonstrated the effects of this globalization on the effectiveness of cultural ad appeals. The experiment reported older Chinese people to be more persuaded be collectivist than by individualist appeals, whereas the younger generation of Chinese participants was found to be equally persuaded by collectivist as by individualist appeals.
Expanding the period of time during which research on cultural value adaptation was published, the present review aims to provide evidence concerning whether the cultural value adaptation effect has diminished in size over time. The research question is:
RQ2 Has the advantage of culturally adapted value appeals in advertising over culturally unadapted appeals decreased over the last 25 years?
The Practical Value of the Adaptation Effect
Different researchers who examine the same relationship, such as between cultural value adaptation and persuasive success, will naturally vary in their design choices. These choices involve selection of participant characteristics (e.g., age, education, nationality), value appeals (e.g., freedom, safety, pleasure), manipulation of value appeals through texts and/or imagery, and use of particular products and brands. As a result of these choices and of sampling theory, the researchers’ results will also naturally vary.
Given this natural variability of effect sizes, practitioners cannot rely on results reported in single studies. As an example, in the meta-analysis of Hornikx and O’Keefe (2009), the largest advantage of adapted appeals in terms of persuasion found in an experiment was a condition in Lau-Gesk (2003), and the largest advantage of unadapted appeals was a condition in Zhang (2004). Those referring to Lau-Gesk (2003) will be more convinced to apply cultural value adaptation in their next advertising campaign. Similarly, those advertisers that have read Zhang (2004) will be persuaded to standardize the value appeals in their upcoming campaign.
For that reason, meta-analyses have been heavily promoted as an instrument to draw generalizable conclusions on a specific phenomenon (in advertising and marketing research, see Eisend, 2017; Franke, 2001). Meta-analyses estimate the mean effect in the population, based on a compilation of all research evidence gathered. It also provides readers with a confidence interval, which is the range of mean effect sizes in the population. Hornikx and O’Keefe (2009) reported a mean effect size of .073 on persuasion; the 95% confidence interval suggested that the range of plausible values for the mean effect was between 0.029 and 0.118. RQ1 addresses the population mean with this confidence interval to express the cultural value adaptation effect in the population, and the intervals within which one expects this effect to be located.
Statisticians have argued that, in addition to this confidence interval, meta-analyses also should report a prediction interval. There is confusion between the two intervals (see Borenstein, 2019), possibly because they both have to do with heterogeneity and variability on the one hand, and upper and lower bounds on the other. The confidence interval around a meta-analytic mean effect describes the range of plausible values for the population effect. The prediction interval around a meta-analytic mean effect describes the range of plausible future individual effect sizes. Confidence intervals are usually narrower than prediction intervals, because the prediction interval reflects both the uncertainty about the location of the population effect and the uncertainty about the location of any individual effect size in a future study (Borenstein, 2019).
Prediction intervals are particularly important for practitioners, as these intervals indicate what the comparison under investigation means concretely for the next time they have to decide between the options. Applied to the context of culturally adapted versus culturally unadapted value appeals, the prediction interval describes the range of likely differences between the two value adaption options for the next time a message designer is faced with the task of including value appeals in an ad.
Establishing the prediction interval of cultural value adaptation is important, because this information may form a key argument for proponents of adaptation in advertising. Effective adaptation (as shown by prediction intervals) may be contrasted with the higher costs associated with adaptation. Adaptation, compared to standardization, has often been argued to create a less uniform brand image in different cultures, and to lead to higher costs (see Duncan & Ramaprasad, 1995; Melewar & Vemmervik, 2004). In case of standardization, marketers have to develop only one marketing idea in advertising for a series of countries instead of different ideas for different countries. Cultural value adaptation seems practically relevant only if it is so much more effective as to outweigh its additional cost, that is, the prediction intervals should point to a range of plausible future effect sizes expressing a clear benefit of adaptation. The current meta-analysis therefore calculates prediction intervals to inform practitioners about the potential benefit of cultural value adaptation in advertising:
RQ3 What do 25 years of empirical research on cultural value adaptation tell practitioners about the benefits of adapting their next advertising campaign?
Method
Literature Search
In order to identify relevant studies published after March 2008 (the end date of the literature search in Hornikx & O’Keefe, 2009), a systematic literature search was performed through September 2018. The same databases and search terms were used as in Hornikx and O’Keefe (2009) in order to facilitate comparison between the two reviews.
Four computerized database retrieval systems were systematically searched. The databases were ABI/INFORM, Communication Abstracts, PsycINFO and PROQUEST Dissertation Abstracts. Since adaptation studies are published in a wide range of journals using a wide range of terms, key words from different fields were used during the search. Key words were combined in a hierarchical tree diagram in order to decrease the number of hits and to increase the chance of finding useful studies. The first keyword, cultur*, was used in every search. Cultur* was used in combination with a second, either adapt*, congruen*, match*, sensitive*, standardi*, tailor*, or target*, and a third level keyword, either advertis*, appeal*, effec*, messag*, or persuasi*. This led to a total of 35 combinations of keywords per database. In addition to this database search, we also looked for unpublished dissertations and master’s theses; we did not find any relevant studies. Finally, personal knowledge of the literature did generate other potential papers (leading to the inclusion of a paper that was eventually published in 2019—well after the September 2018 search deadline).
Inclusion Criteria
First, studies were included in the analysis if they compared the effects on persuasion or ad liking of two advertisements for one target group, where the contrast between the advertisements was whether the appeals were adapted or unadapted to match the cultural values of the target group as categorized by Hofstede (2001). This set of criteria excluded studies comparing the effectiveness of one advertisement for two target groups (e.g., Waller et al., 2008), studies in which the ad did not appeal to values categorized in Hofstede’s dimensions (Massey et al., 2013), or studies involving countries for which no Hofstede scores were available (the comparisons for Cambodia in Sar & Rodriguez, 2014).
Second, information required in order to compute effect sizes for persuasion or ad liking had to be available, either in the original report or through correspondence with authors. Studies were excluded when data were not available (Cui et al., 2012; Teng et al., 2014).
A total of 11 articles, reporting on 23 studies, met the inclusion criteria. These studies generated 54 effect sizes for persuasion and 50 effect sizes for ad liking, which were added to Hornikx and O’Keefe’s (2009) original sample (67 and 66 cases, respectively) to yield 121 persuasion effect sizes and 116 ad liking effect sizes. In the reference list, the 11 additional articles included in this meta-analysis are marked with an asterisk.
Unit of Analysis
The unit of analysis was a message pair (an unadapted vs. an adapted ad) for one audience. Many studies used a 2 (adapted vs. unadapted) × 2 (culture 1 vs. culture 2) design, meaning that two appeals were compared for two different audiences. For instance, Muralidharan et al. (2017) measured the effectiveness of an advertisement for laundry detergent with either an individualistic or a collectivistic appeal, in India (a collectivistic culture) and the United States (an individualistic culture). This study yielded two effect sizes, since it employed two message pairs for two audiences: individualistic versus collectivistic for India, and individualistic versus collectivistic for USA. Muralidharan et al. (2017) measured both persuasion and ad liking, so four effect sizes were recorded.
Dependent Variables
Ad liking (or “attitude toward the advertisement”) and persuasion were assessed as the two main dependent variables, since these are the most common measures in international adaptation research (Gudykunst et al., 1988). If studies used multiple persuasion measures, such as attitude toward the brand, attitude toward the product, or purchase intention, effect sizes were first calculated for the individual measures, which were then weighted by n and averaged into one overall persuasion effect size for persuasion using an r-z-r transformation procedure. All studies conducted after 2008 included both an ad liking measure and at least one type of persuasion measure (with the exception of Zhang, 2010).
Effect size measures—Similar to Hornikx and O’Keefe (2009), we used the effect size measure r; we also report d. First effect size d was calculated based on M, SD, and n per cell. Then, d was transformed to r. A correlation was computed for every comparison between an unadapted and an adapted version of an advertisement. Each comparison indicated the effectiveness of the adapted versus the unadapted advertisement for one product and one audience. A positive r or d indicated that the adapted version of the ad received higher levels of persuasion or ad liking than the unadapted version, whereas a negative r or d indicated that the unadapted version had more positive effects than the adapted version. For instance, in Muralidharan et al.’s (2017) study, the effect size for India would be positive if the collectivistic appeal resulted in higher scores for persuasion and/or ad liking than the individualistic appeal, while for the USA the effect size would be positive if the individualistic appeal generated higher persuasion and/or better ad liking than the collectivistic appeal.
Moderators
We coded studies for three potential moderating factors: the year of publication, the geographic region of the participants, and the cultural dimension that was manipulated in the comparison.
Year of publication—Whereas year of data collection might be more appropriate than year of publication (as there might be quite an interval between the two), this information was generally unavailable in the publications. Therefore, we recorded the year of publication in the dataset. To assess whether the adaptation effects have changed in size over time, a correlation analysis was performed. We computed correlations between the year of publication of a study and the effect sizes for ad liking toward the advertisement, and between the year of publication and the effect sizes for persuasion. We weighted the effect sizes for ad liking and persuasion by the number of participants in that comparison.
Geographic region—Because Hornikx and O’Keefe (2009) found persuasion and ad liking effects to vary by region, we included their geographic region categories as a moderator in the analyses. Studies after 2008 were performed in the following geographic regions: Asia-Pacific (China, India, Korea, South Korea, Taiwan, Thailand, Vietnam), North America (USA), and Europe (Belgium, The Netherlands, United Kingdom). No studies published after 2008 reported on the region Central and South America.
Value dimension—Studies compared the relative effectiveness of ad appeals on the basis of cultural value dimensions from Hofstede (2001): individualism-collectivism, masculinity-femininity, high-low uncertainty avoidance, small-large power distance, and short-long term orientation. In some cases, the researchers compared a cultural value to a functional value unrelated to a cultural dimension.
Meta-Analytic Procedure
To facilitate optimal comparison between the results of the current analyses and those of Hornikx and O’Keefe (2009), we used the same random-effects meta-analytic procedure (Borenstein & Rothstein, 2005). We used this procedure (e.g., in preference to multilevel modeling) precisely so as to maximize comparability of results with Hornikx and O’Keefe’s (2009) report. For each mean effect size, we computed the 95% confidence interval and the 95% prediction interval. We obtained the 95% prediction interval using procedures described by Borenstein et al. (2017; see also formulas 17.7 and 17.8 in Borenstein et al., 2021, pp. 119–125).
Results
RQ1: Adaptation Effects on Ad Liking and Persuasion
An analysis of the 121 cases for persuasion (N = 12,201) indicated that advertisements with culturally adapted value appeals were significantly more persuasive (mean r = .049, d = 0.098, p = .001) than advertisements with unadapted appeals; see Table 1. An analysis of the 116 cases for ad liking (N = 11,175) showed that advertisements with adapted appeals were significantly better liked than advertisements with unadapted appeals (mean r = .055, d = 0.110, p = .001); see Table 2. 1
Persuasion Effects: All Cases and by Geographic Region and by Value Dimension.
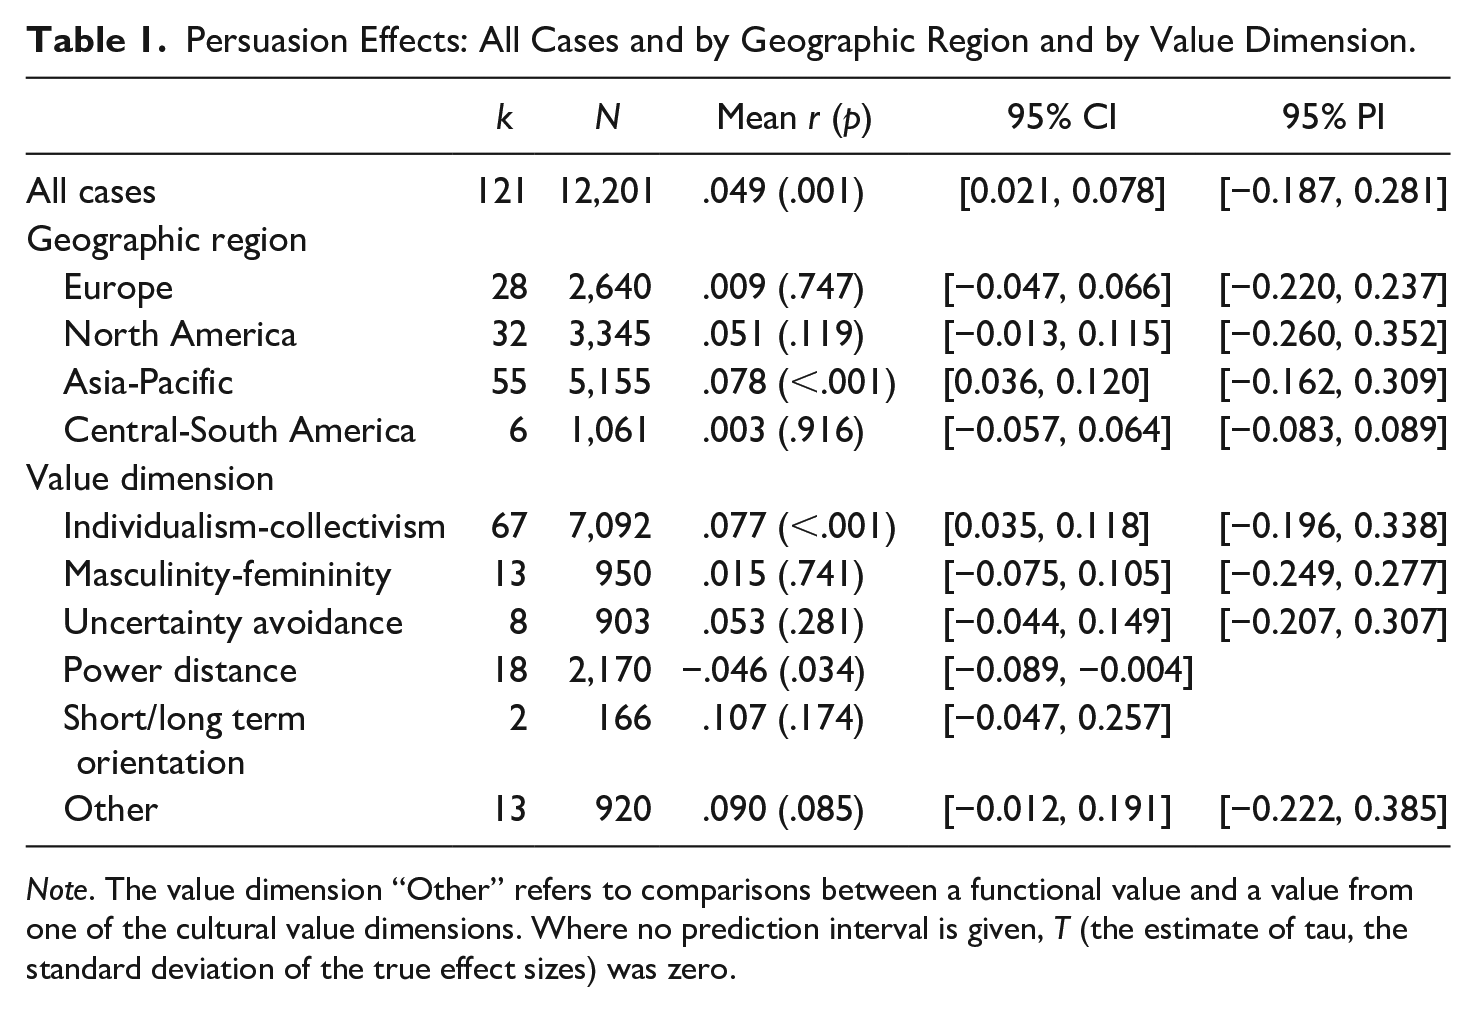
Note. The value dimension “Other” refers to comparisons between a functional value and a value from one of the cultural value dimensions. Where no prediction interval is given, T (the estimate of tau, the standard deviation of the true effect sizes) was zero.
Ad Liking Effects: All Cases and by Geographic Region and by Value Dimension.
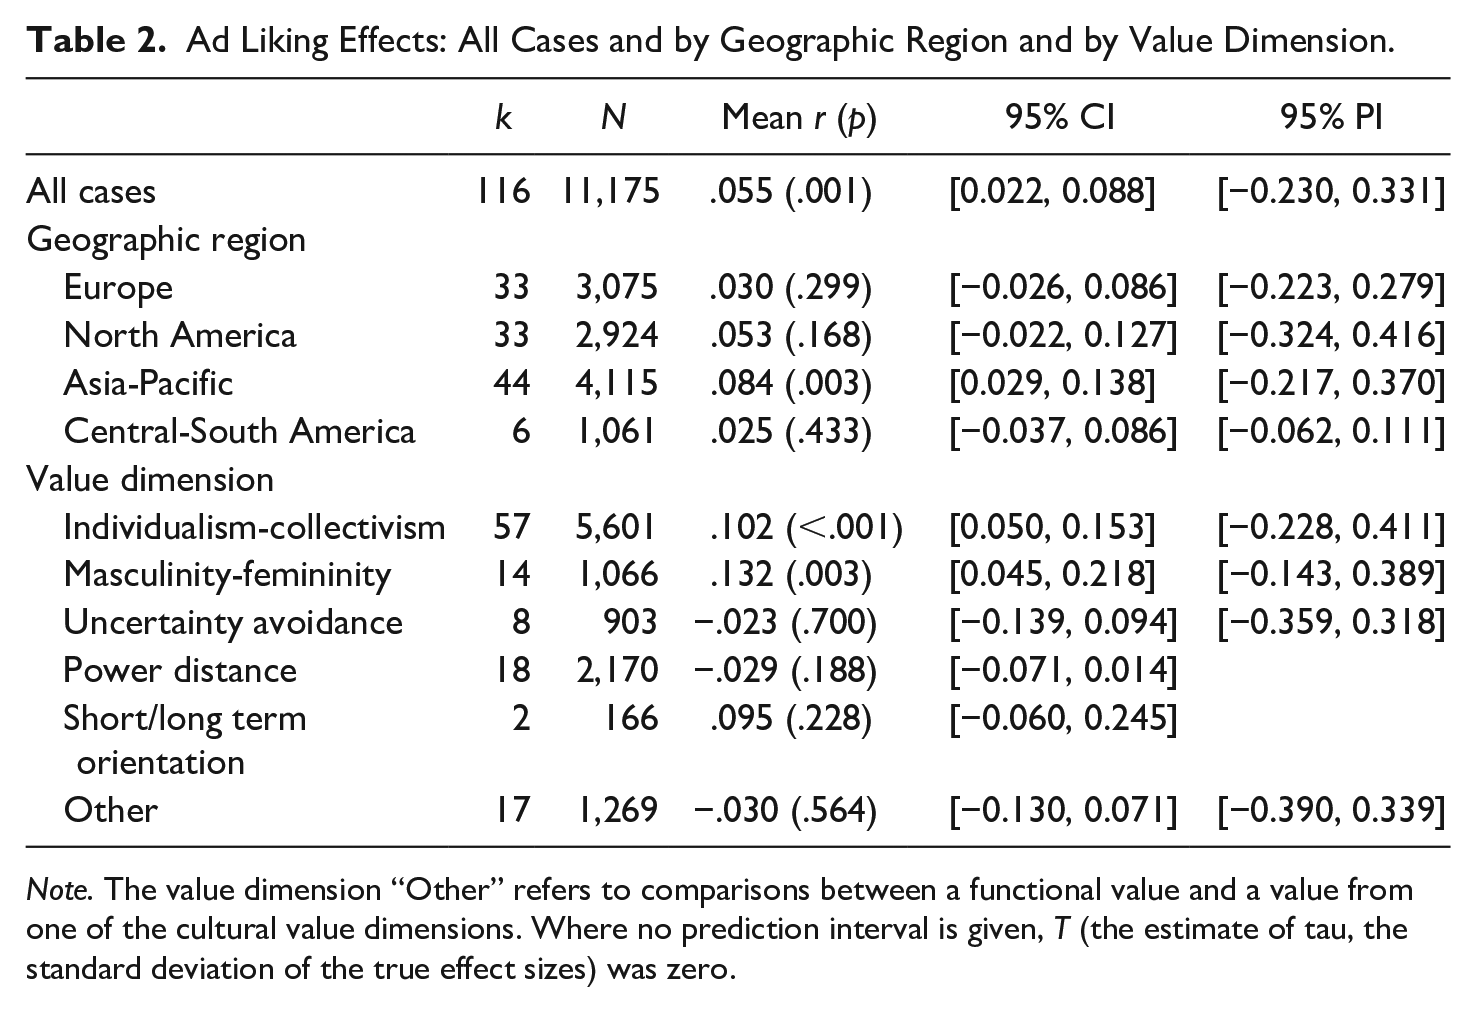
Note. The value dimension “Other” refers to comparisons between a functional value and a value from one of the cultural value dimensions. Where no prediction interval is given, T (the estimate of tau, the standard deviation of the true effect sizes) was zero.
To assess the generality of the effects, we examined effects separately for different regions (see Table 1). Adapted appeals were significantly more persuasive than unadapted appeals for Asian-Pacific audiences (mean r = .078, d = 0.156, p < .001), but not for European, North American, or Central/South American audiences. However, there were no significant differences between any two regions, as the 95% confidence intervals overlap substantially. A similar pattern was found for ad liking (see Table 2). Adapted appeals were significantly better liked than unadapted appeals by Asian-Pacific audiences (mean r = .084, d = 0.169, p = .003), but not by European, North American, or Central/South American audiences. But, again, there were no significant differences between any two regions, as the 95% confidence intervals overlap considerably.
Finally, we examined the cultural value dimension that was used to create the comparison between an adapted value appeal and an unadapted value appeal. Adapted appeals were significantly more persuasive than unadapted appeals when related to the dimension of individualism-collectivism (mean r = .077, d = 0.154, p < .001), and less persuasive when related to the dimension of power distance (mean r = −.046, d = −0.092, p < .05), and no differences were found for the other cultural value dimensions. However, the only significant difference between cultural value dimensions was between individualism-collectivism and power distance (non-overlapping 95% confidence intervals). In addition, adapted appeals received significantly more ad liking than unadapted appeals when related to the dimension of individualism-collectivism (mean r = .102, d = 0.205, p < .001), or when related to the dimension of masculinity-femininity (mean r = .132, d = 0.266, p < .01). However, the only significant differences between cultural value dimensions were between individualism-collectivism and power distance, and between masculinity-femininity and power distance (non-overlapping 95% confidence intervals).
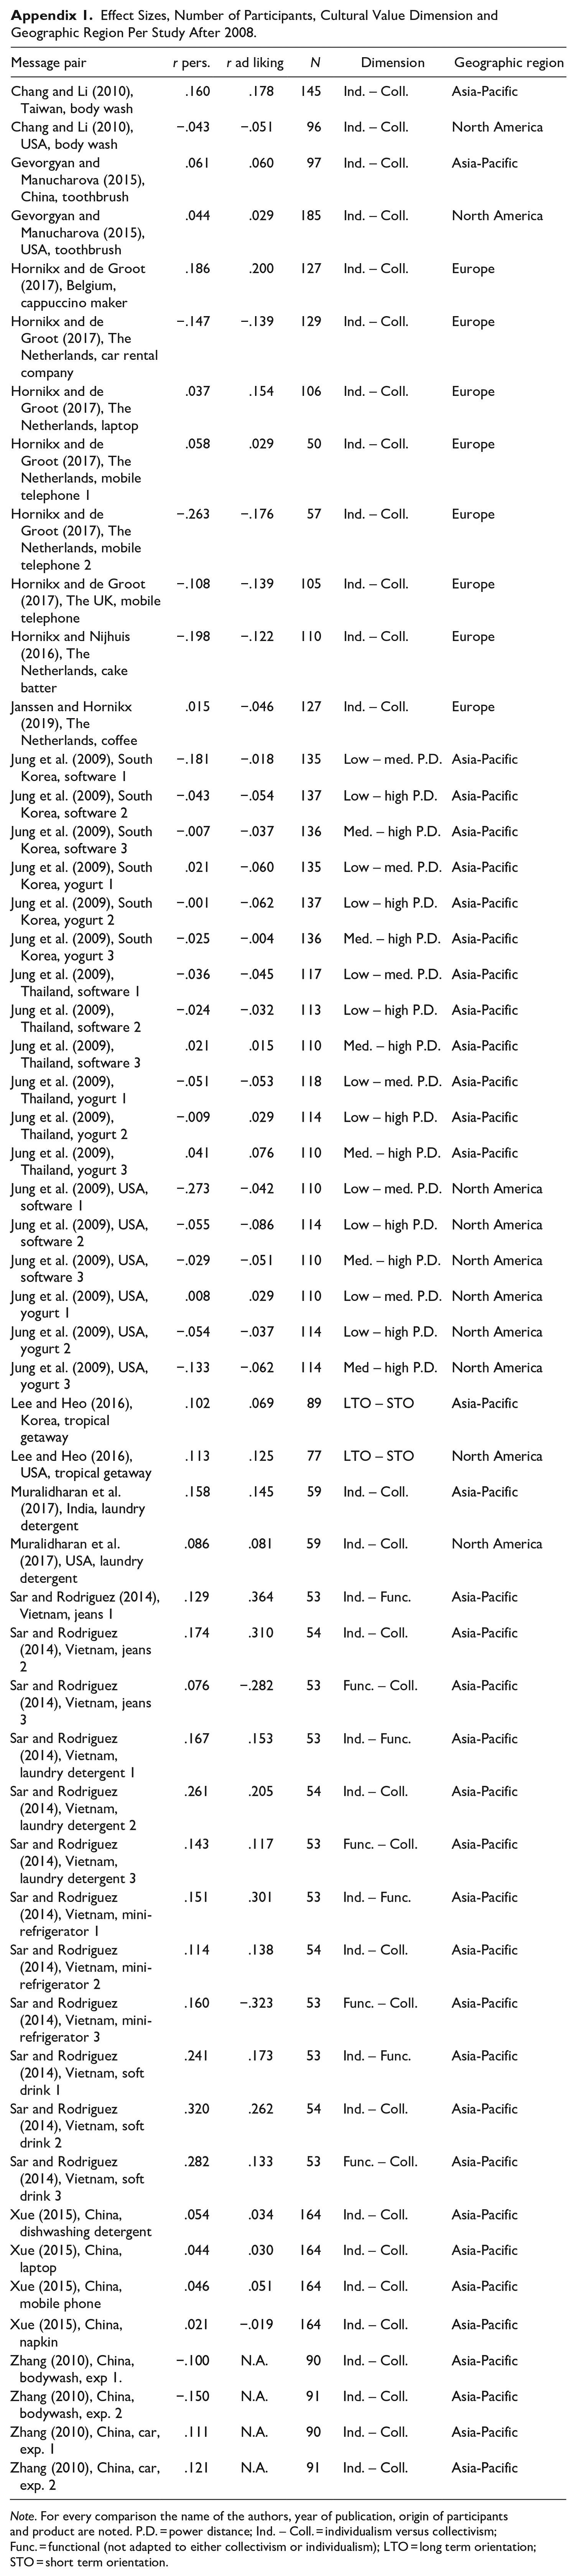
Appendix 1 provides the effect sizes, number of participants, cultural value dimension and geographic region for each comparison reported in papers retrieved for this updated meta-analysis.
RQ2: Effect Sizes Over Time
We performed a correlation analysis to assess whether a relationship between year of publication and the effects of adaptation on ad liking and persuasion existed. Negative relationships were found between year of publication and persuasion effects (r = −.152, p < .001) and between year of publication and ad liking effects (r = −.185, p < .001), indicating that the effects of adaptation on persuasion and ad liking are both diminishing over time.
RQ3: Predictions for Practitioners
The meta-analysis shows that—in general—cultural value adaptation is beneficial in terms of both persuasion and ad liking. The final question of this paper was what the results tell practitioners about the benefits of adapting their next advertising campaign (RQ3). As demonstrated in Tables 1 and 2, the prediction intervals include zero and negative values. This means that for the next advertising campaign for which marketers have to decide between adapted and unadapted value appeals, they cannot be assured that the adapted appeal will be the better choice. On average, it will—the confidence interval around the meta-analytic mean effect excludes zero—but the variability in effect from study to study is so large as to rule out a guarantee that the adapted appeal will be more effective in any individual application.
Conclusion and Discussion
An Overall Adaptation Effect
This meta-analytic review of 25 years of research (1994–2018) found that advertisements with culturally adapted value appeals are slightly, but statistically significantly, more persuasive (mean r = .049, d = 0.098) and better liked (mean r = .055, d = 0.110) than advertisements with culturally unadapted value appeals. The large number of effect sizes (over 100), the large number of participants (over 11,000), the variety of countries studied (e.g., Vietnam, USA, Colombia, New Zealand, the UK), the cultural value dimensions involved (e.g., individualism-collectivism, masculinity-femininity) and the variety of products advertised (e.g., yogurt, software, cars, laundry detergent) provide a good basis for concluding that appealing to important values can be effective in enhancing ad liking and persuasion. However, these effects are noticeably small (d around 0.10) given that the message variation concerns not some superficial aspect of phrasing or execution, but rather variation in the degree to which the persuasive appeals speak to the audience’s cultural values.
Moderator analyses do not strongly qualify these small effects. First, there is no region where cultural value adaption effects are significantly strongest. Second, cultural value adaptation is significantly stronger for individualism-collectivism than for power distance (both persuasion and ad liking), and for masculinity-femininity than for power distance (ad liking). If anything, the strongest effect found is for ad liking of ad appeals manipulated to the dimension of masculinity-femininity (mean r = .132, d = 0.266) – still a small effect size. There might be still other factors that drive the general outcome, such as participants’ processing, level of involvement, or importance of the product. Unfortunately, these potential drivers were not measured (or reported) in the original publications.
Effects Decline Over Time
The negative correlations between publication year and effect size for both persuasion (−.152) and ad liking (−.185) are quite small, yet show that the positive effects of cultural value adaptation reported in empirical research papers have diminished over time. And the separate meta-analysis of studies published after 2008 found no statistically significant difference between adapted and unadapted advertisements for either persuasion (mean r = .017, d = 0.034) or ad liking (mean r = .018, d = 0.036). Thus, the more recent average effect sizes are statistically significantly smaller than the mean effect sizes reported by Hornikx and O’Keefe (2009).
The important question of the decline in effect sizes is to ask what drives this effect. We argue that changes in value systems, affected by globalization, are the main drivers of this decline effect. Before reaching this conclusion, we rule out (a) general drivers of decline effects and (b) alternative explanations linked to potential differences in the specific studies conducted in our meta-analysis.
General drivers of decline effects—Decline effects have been observed in a variety of domains of empirical research (e.g., Pietschnig et al., 2019). Protzko and Schooler (2017) distinguish between four types of decline effects. Decline effects are more likely to be genuine if it is possible to discard the first three types. The first type are “false positive decline effects,” which are observed if initial positive results are later found to be artifacts. This is not the case in the current meta-analysis since the effect was found regularly over the years following the first publications 25 years ago.
Second, there are “inflated decline effects” if the original effects were true but inflated through small initial sample sizes, selective reporting, and/or publication bias. Underpowered initial studies and later studies with larger sample sizes are often found to be a case for decline effects (cf. Pietschnig et al., 2019). For both dependent measures, it was tested whether there was a significant increase in sample sizes. For persuasion and for ad liking, separate curve estimation regression analyses (linear model) with year as predictor were not significant (in both cases: F (1, 114) < 1; R2 = .00). Appendix 2 shows both plots. Another source for inflated decline effects is publication bias; in that case, researchers have not submitted null findings in the years following the original “successful” studies. This is also not the case in our meta-analysis, since regularly papers with non-significant (and significant) value adaptation effects were published (e.g., Gregory & Munch, 1997; Hoeken et al., 2003; Hornikx & de Groot, 2017). A final source for inflated decline effects consists of selective reporting: the inclination to only report dependent measures that work in the beginning. This is also not the case here, since the use of dependent measures (ad liking, variants of persuasion) has been consistent over the years.
Third, “under-specified decline effects” are in play when the original effects were true but only hold under specific conditions. There is no reason for this type of decline effects, since there has been considerable variation in type of product, dimension, and country across the studies in the 25-year timespan, and the first studies do not deviate from this variation.
Given that these three kinds of decline effects do not appear to apply to the current data, it seems all the more plausible that the decline effects in the current meta-analysis are “genuinely decreasing decline effects.” Changes to the population across time are the most common account for these effects (Protzko & Schooler, 2017), and these changes are precisely what the globalization account (discussed below) points to as important. Prior to that, we explore two specific study-related explanations.
Alternative study-related explanations for decline effects—There are at least two potential study-related explanations for the decline effect. First, perhaps the cultural values chosen in recent research were not ones important to the individual participants. Although such divergence is always possible, it is notable that several recent studies (e.g., Hornikx & de Groot, 2017) included assessments of participants’ value preferences and found these to be in line with the expected cultural preferences. Thus, differences between cultural and individual values are unlikely to be a satisfactory explanation. Second, even if important cultural values were chosen, perhaps recent researchers did a poor job of constructing appeals that invoked those values. However, there is no apparent reason why researchers’ skills would have eroded this way (and examination of the primary research reports did not reveal any apparent flaws). Indeed, later researchers presumably could have benefited from seeing earlier experimental materials and so have been in a better position to employ design choices made in studies that found strong adaptation effects.
Globalization as driver for decline effects—Having discarded the three first kinds of decline effects, the “genuinely decreasing decline effect” appears to hold for the results obtained. Research in psychology and sociology underlines globalization effects where at least some values converge in relative importance (e.g., Inglehart & Baker, 2000; Kaasa & Minkov, 2020). As a result, the differences between cultural values expected to be important or unimportant by earlier accounts (notably Hofstede, 2001) become smaller. In addition, such globalization effects are strengthened by media globalization. Consumers around the world are now more exposed than ever to other cultures in a variety of ways, such as through entertainment media; indeed, at least some consumers may encounter advertisements aimed at target groups with other value hierarchies. Craig and Douglas’s (2006, p. 333) prediction was this: “values typically characterizing western societies, such as individualism and independence, will increasingly be adopted in collectivist Asian societies. At the same time, Asian values such as harmony will become more evident in western societies.” To the extent that such changes occur, one would naturally expect a diminished advantage for culturally adapted advertising appeals—and this is precisely what the current meta-analysis reports. As such, the results of this meta-analysis provide empirical support to the theory-driven accounts on globalization, culture, and advertising (Craig & Douglas, 2006; Okazaki & Taylor, 2006).
No Guaranteed Practical Value of Adaptation
The prediction intervals were quite wide and included zero. 2 For persuasion effects, the 95% prediction interval was [−0.187, 0.281]; for ad liking effects, it was [−0.230, 0.331]. The implication is that even though the overall average effect is positive (indicating an advantage for adapted appeals), there is such variation that any individual application might produce substantial positive as well as negative effects. A recent examination of meta-analyses has drawn the same conclusion for as many as 30 different message choices in persuasion research (O’Keefe & Hoeken, 2021).
For practitioners, the research evidence after a quarter of a century of research implies that cultural value adaptation is not a dependable message strategy—and not more effective than standardization if one takes into consideration the higher cost of adaptation. Although the debate between standardization or adaptation is more nuanced than a simple trade-off as another stream of research examines what needs to be adapted and can be standardized (see Melewar & Vemmervik, 2004), the current meta-analysis provides evidence against the effectiveness of adaptation. A limitation of this conclusion is that it, quite naturally, does not take into account the many other factors that have been studied in advertising and marketing in the context of the debate of standardization versus adaptation, such as economic conditions, legal conditions, and corporate strategy (e.g., Mandler et al., 2021; Papavassiliou & Stathakopoulos, 1997; Theodosiou & Leonidou, 2003).
Concluding Remarks
Advertisements with culturally adapted value appeals have been shown to be more persuasive and better liked than advertisements with culturally unadapted value appeals. This means that cultural values matter as a way of distinguishing cultural groups, and that it is useful to target consumers as member of a cultural group (cf. Hofstede, 2001; Lehman et al., 2004). The effect, though, is small, and does not increase under specific conditions of cultural dimension or geographic region. Other factors might moderate this effect (e.g., level of involvement, importance of the product), but the observation that such general marketing aspects have not been studied or reported in the last 25 years is an indication of its expected low importance.
We do not expect this stream of research, which has followed about the same research design over the years, to flourish in the coming years. The effect has been proven, and has been proven to decline, very probably through processes of globalization and mediatization. There is increasing research attention to the idea that people generally are (becoming) bicultural or multicultural, and that people shift between their cultural identities themselves or that people can be incited to activate the cultural identity relevant to the situation (e.g., Arnett, 2002; Hong et al., 2000; Oyserman & Lee, 2008). This paradigm does not connect easily with the monocultural perspective taken in the studies included in our meta-analytic review.
Finally, while the verdict of the 25 years of research on cultural value adaptation is that this research is theoretically important to the role of cultural dimensions in persuasion, to international advertising, and to globalization research, one may at the same time add that it is irrelevant to the managerial practice of advertising. The advice to adapt advertising appeals to cultural values is not dependable. There are other factors of importance to focus on in the quest to learn what can be standardized and needs to be adapted in international communication.
Footnotes
Appendix
Effect Sizes, Number of Participants, Cultural Value Dimension and Geographic Region Per Study After 2008.
| Message pair | r pers. | r ad liking | N | Dimension | Geographic region |
|---|---|---|---|---|---|
| Chang and Li (2010), Taiwan, body wash | .160 | .178 | 145 | Ind. – Coll. | Asia-Pacific |
| Chang and Li (2010), USA, body wash | −.043 | −.051 | 96 | Ind. – Coll. | North America |
| Gevorgyan and Manucharova (2015), China, toothbrush | .061 | .060 | 97 | Ind. – Coll. | Asia-Pacific |
| Gevorgyan and Manucharova (2015), USA, toothbrush | .044 | .029 | 185 | Ind. – Coll. | North America |
| Hornikx and de Groot (2017), Belgium, cappuccino maker | .186 | .200 | 127 | Ind. – Coll. | Europe |
| Hornikx and de Groot (2017), The Netherlands, car rental company | −.147 | −.139 | 129 | Ind. – Coll. | Europe |
| Hornikx and de Groot (2017), The Netherlands, laptop | .037 | .154 | 106 | Ind. – Coll. | Europe |
| Hornikx and de Groot (2017), The Netherlands, mobile telephone 1 | .058 | .029 | 50 | Ind. – Coll. | Europe |
| Hornikx and de Groot (2017), The Netherlands, mobile telephone 2 | −.263 | −.176 | 57 | Ind. – Coll. | Europe |
| Hornikx and de Groot (2017), The UK, mobile telephone | −.108 | −.139 | 105 | Ind. – Coll. | Europe |
| Hornikx and Nijhuis (2016), The Netherlands, cake batter | −.198 | −.122 | 110 | Ind. – Coll. | Europe |
| Janssen and Hornikx (2019), The Netherlands, coffee | .015 | −.046 | 127 | Ind. – Coll. | Europe |
| Jung et al. (2009), South Korea, software 1 | −.181 | −.018 | 135 | Low – med. P.D. | Asia-Pacific |
| Jung et al. (2009), South Korea, software 2 | −.043 | −.054 | 137 | Low – high P.D. | Asia-Pacific |
| Jung et al. (2009), South Korea, software 3 | −.007 | −.037 | 136 | Med. – high P.D. | Asia-Pacific |
| Jung et al. (2009), South Korea, yogurt 1 | .021 | −.060 | 135 | Low – med. P.D. | Asia-Pacific |
| Jung et al. (2009), South Korea, yogurt 2 | −.001 | −.062 | 137 | Low – high P.D. | Asia-Pacific |
| Jung et al. (2009), South Korea, yogurt 3 | −.025 | −.004 | 136 | Med. – high P.D. | Asia-Pacific |
| Jung et al. (2009), Thailand, software 1 | −.036 | −.045 | 117 | Low – med. P.D. | Asia-Pacific |
| Jung et al. (2009), Thailand, software 2 | −.024 | −.032 | 113 | Low – high P.D. | Asia-Pacific |
| Jung et al. (2009), Thailand, software 3 | .021 | .015 | 110 | Med. – high P.D. | Asia-Pacific |
| Jung et al. (2009), Thailand, yogurt 1 | −.051 | −.053 | 118 | Low – med. P.D. | Asia-Pacific |
| Jung et al. (2009), Thailand, yogurt 2 | −.009 | .029 | 114 | Low – high P.D. | Asia-Pacific |
| Jung et al. (2009), Thailand, yogurt 3 | .041 | .076 | 110 | Med. – high P.D. | Asia-Pacific |
| Jung et al. (2009), USA, software 1 | −.273 | −.042 | 110 | Low – med. P.D. | North America |
| Jung et al. (2009), USA, software 2 | −.055 | −.086 | 114 | Low – high P.D. | North America |
| Jung et al. (2009), USA, software 3 | −.029 | −.051 | 110 | Med. – high P.D. | North America |
| Jung et al. (2009), USA, yogurt 1 | .008 | .029 | 110 | Low – med. P.D. | North America |
| Jung et al. (2009), USA, yogurt 2 | −.054 | −.037 | 114 | Low – high P.D. | North America |
| Jung et al. (2009), USA, yogurt 3 | −.133 | −.062 | 114 | Med – high P.D. | North America |
| Lee and Heo (2016), Korea, tropical getaway | .102 | .069 | 89 | LTO – STO | Asia-Pacific |
| Lee and Heo (2016), USA, tropical getaway | .113 | .125 | 77 | LTO – STO | North America |
| Muralidharan et al. (2017), India, laundry detergent | .158 | .145 | 59 | Ind. – Coll. | Asia-Pacific |
| Muralidharan et al. (2017), USA, laundry detergent | .086 | .081 | 59 | Ind. – Coll. | North America |
| Sar and Rodriguez (2014), Vietnam, jeans 1 | .129 | .364 | 53 | Ind. – Func. | Asia-Pacific |
| Sar and Rodriguez (2014), Vietnam, jeans 2 | .174 | .310 | 54 | Ind. – Coll. | Asia-Pacific |
| Sar and Rodriguez (2014), Vietnam, jeans 3 | .076 | −.282 | 53 | Func. – Coll. | Asia-Pacific |
| Sar and Rodriguez (2014), Vietnam, laundry detergent 1 | .167 | .153 | 53 | Ind. – Func. | Asia-Pacific |
| Sar and Rodriguez (2014), Vietnam, laundry detergent 2 | .261 | .205 | 54 | Ind. – Coll. | Asia-Pacific |
| Sar and Rodriguez (2014), Vietnam, laundry detergent 3 | .143 | .117 | 53 | Func. – Coll. | Asia-Pacific |
| Sar and Rodriguez (2014), Vietnam, mini-refrigerator 1 | .151 | .301 | 53 | Ind. – Func. | Asia-Pacific |
| Sar and Rodriguez (2014), Vietnam, mini-refrigerator 2 | .114 | .138 | 54 | Ind. – Coll. | Asia-Pacific |
| Sar and Rodriguez (2014), Vietnam, mini-refrigerator 3 | .160 | −.323 | 53 | Func. – Coll. | Asia-Pacific |
| Sar and Rodriguez (2014), Vietnam, soft drink 1 | .241 | .173 | 53 | Ind. – Func. | Asia-Pacific |
| Sar and Rodriguez (2014), Vietnam, soft drink 2 | .320 | .262 | 54 | Ind. – Coll. | Asia-Pacific |
| Sar and Rodriguez (2014), Vietnam, soft drink 3 | .282 | .133 | 53 | Func. – Coll. | Asia-Pacific |
| Xue (2015), China, dishwashing detergent | .054 | .034 | 164 | Ind. – Coll. | Asia-Pacific |
| Xue (2015), China, laptop | .044 | .030 | 164 | Ind. – Coll. | Asia-Pacific |
| Xue (2015), China, mobile phone | .046 | .051 | 164 | Ind. – Coll. | Asia-Pacific |
| Xue (2015), China, napkin | .021 | −.019 | 164 | Ind. – Coll. | Asia-Pacific |
| Zhang (2010), China, bodywash, exp 1. | −.100 | N.A. | 90 | Ind. – Coll. | Asia-Pacific |
| Zhang (2010), China, bodywash, exp. 2 | −.150 | N.A. | 91 | Ind. – Coll. | Asia-Pacific |
| Zhang (2010), China, car, exp. 1 | .111 | N.A. | 90 | Ind. – Coll. | Asia-Pacific |
| Zhang (2010), China, car, exp. 2 | .121 | N.A. | 91 | Ind. – Coll. | Asia-Pacific |
Note. For every comparison the name of the authors, year of publication, origin of participants and product are noted. P.D. = power distance; Ind. – Coll. = individualism versus collectivism; Func. = functional (not adapted to either collectivism or individualism); LTO = long term orientation; STO = short term orientation.
Acknowledgements
The authors thank Chingching Chang, Xue Fei, Gary Gregory, Helen van Hartingsveldt, Hans Hoeken, Jae Min Jung, James Kellaris, Mathilde Kirk, Loraine Lau-Gesk, Suzy Lee, Sidharth Muralidharan, Michelle Nelson, Femke Noordhoek, Lulu Rodriguez, Wouter Sanderse, Sela Sar, Ralf Terlutter, Jing Zhang, and Yong Zhang for supplying primary-research information.
Declaration of Conflicting Interests
The author(s) declared no potential conflicts of interest with respect to the research, authorship, and/or publication of this article.
Funding
The author(s) received no financial support for the research, authorship, and/or publication of this article.