
Abstract
Background:
Return to performance after ulnar collateral ligament (UCL) surgery in Major League Baseball (MLB) pitchers has been investigated; however, pitch-specific return to performance using several advanced metrics has been minimally studied.
Purpose:
To evaluate pitch performance 1, 2, and 3 seasons after UCL surgery in MLB pitchers.
Study Design:
Case series; Level of evidence, 4.
Methods:
We performed a retrospective analysis on 129 MLB pitchers who underwent primary UCL reconstruction or repair from November 2017 to November 2023. Pitch types analyzed included fastballs, sliders, curveballs, sinkers, cutters, changeups, and splitters. The exclusion criteria included pitchers without 1 preoperative and 2 postoperative qualifying seasons (ie, >100 pitches in a calendar year) of pitch-tracking data except for analysis of Stuff+ (measures physical qualities of a pitch), Location+ (measures strike-zone command), and Pitching+ (measures overall pitching ability), which were first released in 2020 and thus analysis is secondary to power limitations, resulting in 54 total MLB pitchers. Data were obtained from public web sources. Statistical analyses included paired and unpaired t tests, as well as binary logistic regression to identify predictors of returning to performance. Return to preinjury pitch performance was also evaluated.
Results:
The mean age was 26.8 + 3.6 years, 74.1% of the included pitchers were right-handed, and 42.6% were starting pitchers. All individual pitches had recovered to their preoperative velocity levels by their second season back from surgery. Multiple pitches showed alterations returned to full performance at a higher than 44% in the horizontal and vertical approach angles above the mean. All pitches had significantly longer release extensions and regained their velocity and spin rate nearly 70% of the time by their third season back. Horizontal and vertical movement also recovered well for each pitch type. Nearly all pitchers returned to performance in their fastballs and sliders’ Stuff+, Location+, and Pitching+, while the remaining pitches analyzed trended to not return to performance as frequently. No single pitch returned to full performance at a higher than 44% rate. Binary logistic regression did not identify any significant predictors for returning to performance in any pitch.
Conclusion:
Pitch-specific differences in return to performance exist after UCL surgery. No pitch returned to full performance at a higher than 44% rate 3 seasons after returning from injury, with changeups faring the best. All pitches had recovered to their preoperative mean velocity and movement levels by 2 seasons prior. Nearly all pitchers returned to performance in fastball and slider physical pitch qualities (Stuff+), strike-zone command (Location+), and overall ability (Pitching+) while sinkers, curveballs, changeups, cutters, and splitters struggled more frequently in these metrics. Altogether, we believe this study better informs MLB players and teams about expectations regarding return to performance of specific pitch types after UCL surgery.
Keywords
Ulnar collateral ligament (UCL) injuries are potentially career-threatening for pitchers and have been steadily rising over the past decade.9,24 The economic and competitive impact of UCL injuries has become a key focus, with a recent cost analysis 26 estimating that UCL injuries have accounted for over $1 billion in lost salary and $3+ billion in performance value to Major League Baseball (MLB) teams since 2014. This has prompted years of investigations into risk factors and workload-management strategies. At the same time, the modern game of baseball has become defined by data and value. From all levels of baseball to Major League front offices, advanced tracking technologies have transformed how pitchers and players are evaluated, developed, and managed. 14 High-resolution cameras installed in every stadium now track every pitch, and advanced analytics are calculated daily, with this information also released to the public, generating significant team, player, and fan interest. 3
Pitchers now throw harder, spin the ball faster, and generate greater movement than at any previous point in the sport's history.3,6,14 In addition to being potentially career-ending, UCL surgery has been shown in recent studies to reduce performance. 19 The rising performance and financial implications of UCL injuries have become a pressing league-wide issue. Thus, it is critical to understand in detail all aspects of a pitcher's return to performance after surgery.
Only recently did Mastroianni et al 19 report on overall return to play and performance using modern pitch-tracking and advanced analytic metrics in this same MLB cohort who underwent UCL surgery. For pitchers, this includes precise measurements of pitch velocity, spin, arm angle, and movement, as well as advanced composite plus metrics such as Stuff+, Location+, and Pitching+, which provide a holistic assessment of pitch quality, strike zone command, and overall ability.18-20 They found that pitchers demonstrated decreased overall value, strike zone command (Location+), and overall pitching ability (Pitching+) after UCL surgery. Previous studies have relied primarily on more rudimentary measures such as return to play, timing, pitch usage, workloads, and velocity.5,8,10-12,16,17,25 These new analytics are highly predictive of future performance and also have pitch-specific values that are widely valued throughout MLB. 21 These metrics lead to teams putting further emphasis and usage on the pitches that grade out well in the various plus metrics, emphasizing the importance to team and player success of understanding the recovery of certain pitch types they rely on for success.
While fastballs remain the most frequently thrown pitch, modern analytic strategies tend to deemphasize fastball usage given superior offensive performance against it, making the impact of the entire pitching arsenal now significantly greater. In addition, teams emphasize certain release points, arm and approach angles for different pitches to improve success. Despite the importance of pitch-specific trends to the success of certain players and teams, there are minimal studies that investigate whether certain pitches recover more effectively after UCL surgery. Therefore, this study aimed to determine pitch-specific outcomes using pitch-tracking and advanced analytic metrics to help best identify what pitches can reliably return to performance after UCL surgery. We hypothesized that there would be differential return to performance in each pitch while examining more detailed pitch-specific outcomes that provide players and teams with more insight into postoperative recovery.
Methods
Study Design
Our study was deemed exempt from institutional review board approval because it did not constitute research involving human participants under Title 45 of the Code of Federal Regulations (45 CFR) 46.102. We conducted a retrospective analysis using entirely public data on all MLB pitchers who underwent primary UCL reconstruction (UCLR) or UCL repair from November 2017 to November 2023, as described in a previous study. 20 Return to play analysis of this cohort was already reported, 20 while return to performance analysis required pitchers to have at least 1 qualifying preinjury season of pitch-tracking data and 2 qualifying (ie, >100 pitches in a calendar year) seasons of postoperative pitch-tracking data and no previous UCL surgery. This was consistent with previous studies and led to the identification of 54 pitchers with adequate data.7,20,22 To qualify as an MLB pitcher, players must have had at least 10 innings pitched in MLB during the index season or the year before the injury. The date of surgery was used as the index date for data collection; the index season was the qualifying season (pitch count >100) in which the surgery was performed, the calendar year immediately before surgery was designated as T1, the year before that was designated as T2, and the year before that was designated as T3. The seasons after surgery will be labeled M1 for the first season played after returning, M2 for the second, and M3 for the third. Therefore, if a player underwent surgery in an offseason, the qualifying season before that would be considered the index season. Pitchers who started in ≥50% of games in the season before surgery (T1) were designated as starting pitchers, while the remaining pitchers who started in <50% of games in the season before surgery were identified as relief pitchers.
Data Collection
As previously described, 20 Baseball Savant (www.baseballsavant.mlb.com) 3 was used to obtain pitch-tracking data. Advanced analytic and pitch-tracking data were collected for fastballs (4-seam versus 2-seam), sinkers, cutters, sliders, splitters, curveballs, and changeups. Demographic data were collected from FanGraphs and Baseball-Reference and stored on an Excel spreadsheet (Microsoft). Stuff+ (physical pitch qualities), Location+ (strike-zone command), and Pitching+ (overall pitching ability) began being publicly recorded in 2020 and are available on FanGraphs; these new metrics were defined previously (Appendix Table 1).4,6,18-20 To increase our power, analyses of spin, Stuff+, Location+, and Pitching+ did not exclude pitchers who <2 qualifying seasons of preoperative data.
Release extension, horizontal and vertical movements, release point, and approach angle above the mean (HAA AA and VAA AA) were tracked from the catcher's point of view and values were defined and normalized as described previously to account for handedness (Appendix Figure 1).18-20 Vertical movement can be positive or negative, with positive values indicating a pitch that resists gravity more and stays up compared with the expected location of the pitch secondary to gravity alone. This is usually secondary to backspin and, with recent pitching trends, is more typical of high-spin fastballs that produce this rising effect, making it more difficult to hit. Negative values indicate a pitch that drops more than expected secondary to gravity alone, and is typically a result of frontspin, most commonly in breaking pitches such as curveballs and sliders.
Statistical Analysis
The 54 pitchers who met the inclusion criteria were included in the pitch-specific return to performance analysis. The mean pitch-specific seasonal values for each metric were compared using a paired t test on preinjury versus postoperative values. Stuff+, Location+, and Pitching+ analyses were performed using data from the season of the injury (instead of T1) compared with the 3 postoperative seasons, with unpaired t tests secondary to the small sample of preoperative values, because these data have only been available since 2020. The percentage of pitchers who returned to their T1 season performance level for various pitch-specific metrics was also recorded for the M1, M2, and M3 seasons. Definitions for returning to performance for each variable were consistent with previous studies for this percentage analysis and were conducted to illustrate how many pitchers return to reasonable performance values. 19 Returning to velocity was defined as being within 1 mph in the season before the injury, while returning to spin rate was defined as being within 100 revolutions per minute in the season before the injury. Returning to Stuff+, Location+, and Pitching+ was defined as being within 5 points of their preinjury level. Returning to pitch count and movement was defined as returning to >90% of the respective metrics in the season before the injury. Certain pitches are typically designed to have positive or negative movement values, as previously described. Thus, this context was used when interpreting return to performance for movement in each pitch. Overall full return to performance was defined as a pitcher returning to preinjury form in each pitch-specific velocity, spin rate, and movement (horizontal and vertical). Therefore, if a pitcher did not return to performance level in only 1 of these variables, then they did not return to their full pitch performance. The sample sizes for Stuff+, Location+, and Pitching+ were limited for most pitches and thus not used to define prior performance.
Paired t tests were used to compare preinjury and postoperative means. Preinjury T1 was compared with the index season of injury and postoperative M1, M2, and M3 seasons. Logistic regression was used to identify predictors of return to previous performance for each pitch, using age, starter versus reliever, velocity, spin rate, and movement as variables. All data analyses were performed using R statistical software (R Foundation for Statistical Computing) and Microsoft Excel (Microsoft). Statistical significance was set at .05.
Results
Descriptive data were evaluated in 129 MLB pitchers who underwent UCLR or UCL repair from the recent 5-year period. The mean age was 26.8 ± 3.6 years, 74% of the included pitchers were right-handed, and 42.6% were starting pitchers (Table 1). Seven pitchers underwent UCL repair (5.4%), and 122 underwent reconstruction (94.6%). Only 3% returned to play at 1 year postoperatively, 64% at 2 years, and 78% at 3 years as previously reported. 21
Descriptive Data a

Characteristics of MLB pitchers who underwent a UCL repair or reconstruction in the past 5 years. Data are presented as mean ± SD or n (%). The exclusion criteria for further data analysis included pitchers without 2 qualifying seasons (ie, >100 pitches in a calendar year) of postoperative pitch-tracking data, except for analysis of Stuff+, Location+, and Pitching+ secondary to power limitations. IFA, signed as an amateur international free agent rather than via draft; UCL, ulnar collateral ligament.
Return to performance outcomes comparing preinjury to postoperative metrics were then evaluated in 54 MLB pitchers who met our inclusion criteria during the designated study period. No demographic differences were observed between these 54 MLB pitchers and the total case cohort (P > .31) (Table 1); the mean age was 27.1 ± 4.9 years, with 44.4% of pitchers being starters and 77.8% being right-handed. The mean FanGraphs Wins Above Replacement in the T1 season was 1.57 ± 1.68, 0.35 ± 0.59 in the M1 season, and 0.82 ± 1.13 in the M2 season. The mean expected fielding independent pitching was 4.29 ± 1.19 in the T1 season, 4.27 ± 1.20 in the M1 season, and 4.22 ± 0.85 in the M2 season. Other mean advanced analytics and pitch-tracking metrics are listed in Appendix Tables 2 and 3.
Sample sizes varied across postoperative seasons and by pitch (Table 4); given that data for the 3+ metrics (Stuff+, Location+, and Pitching+) have only been available since 2020, sample sizes for analysis of these metrics were further limited. The sample size for the 3+ metrics during the first season back from injury was 19 for fastballs, 15 for sliders, 14 for curveballs, 12 for cutters, 16 for sinkers, 11 for changeups, and 3 for splitters, as these metrics have only been available since 2020. The sample size during the second season back was 16 for fastballs, 13 for sliders, 13 for curveballs, 10 for cutters, 13 for sinkers, 10 for changeups, and 3 for splitters, as these metrics have only been available since 2020. During the third season back from injury, there were 14 cases for fastballs, 9 for sliders, 8 for curveballs, 6 for cutters, 8 for sinkers, 5 for changeups, and 2 for splitters.
The mean advanced analytic and pitch-tracking values comparing preinjury with the M1 and M2 seasons are listed in Tables 2 and 3. Notably, the percentage of fastballs being thrown was significantly decreased by the M2 and M3 seasons (P < .01); fastball velocity was also decreased during the M1 season (P = .03) but recovered by M2 (P = .81). During M2, pitchers threw their fastballs with a slightly higher vertical release point but lower vertical approach angle, and with more release extension (P < .05). Pitchers had a significant decrease in fastball spin rate during M1 but not the M2 season (P = .08). Pitchers also had slight but significant decreases in fastball Stuff+, Pitching+, and Location+ during M2 (P < .05). No significant differences were found during M2 for fastball velocity, movement, and horizontal release point and HAA AA (P > .05).
Pitch-Specific, Pitch Count, Velocity, Spin Rate, Movement, and Advanced Analytic Outcomes After UCL Surgery a

Bold values indicate significant differences from Pre T1 or index season. Highlighted season Pre T1 or the index season values are compared with Post M1 and Post M2 values. The analyses for Stuff+, Location+, and Pitching+ were underpowered because the data have only been available since 2020. Splitters had only 2 pitchers with Post M1 and Post M2 data for Stuff+, Location+, and Pitching+, and thus no analysis was completed. Δ, change from T1 or index season; index, season of injury; Location+, strike-zone command; NA, not applicable; Pitching+, overall pitching ability; Post M, postoperative season; Pre T1, season before injury; RPM, revolutions per minute; Stuff+, physical qualities of a pitch.
Pitch-Specific Approach Angles, Release Points, and Release Extension After UCL Surgery a
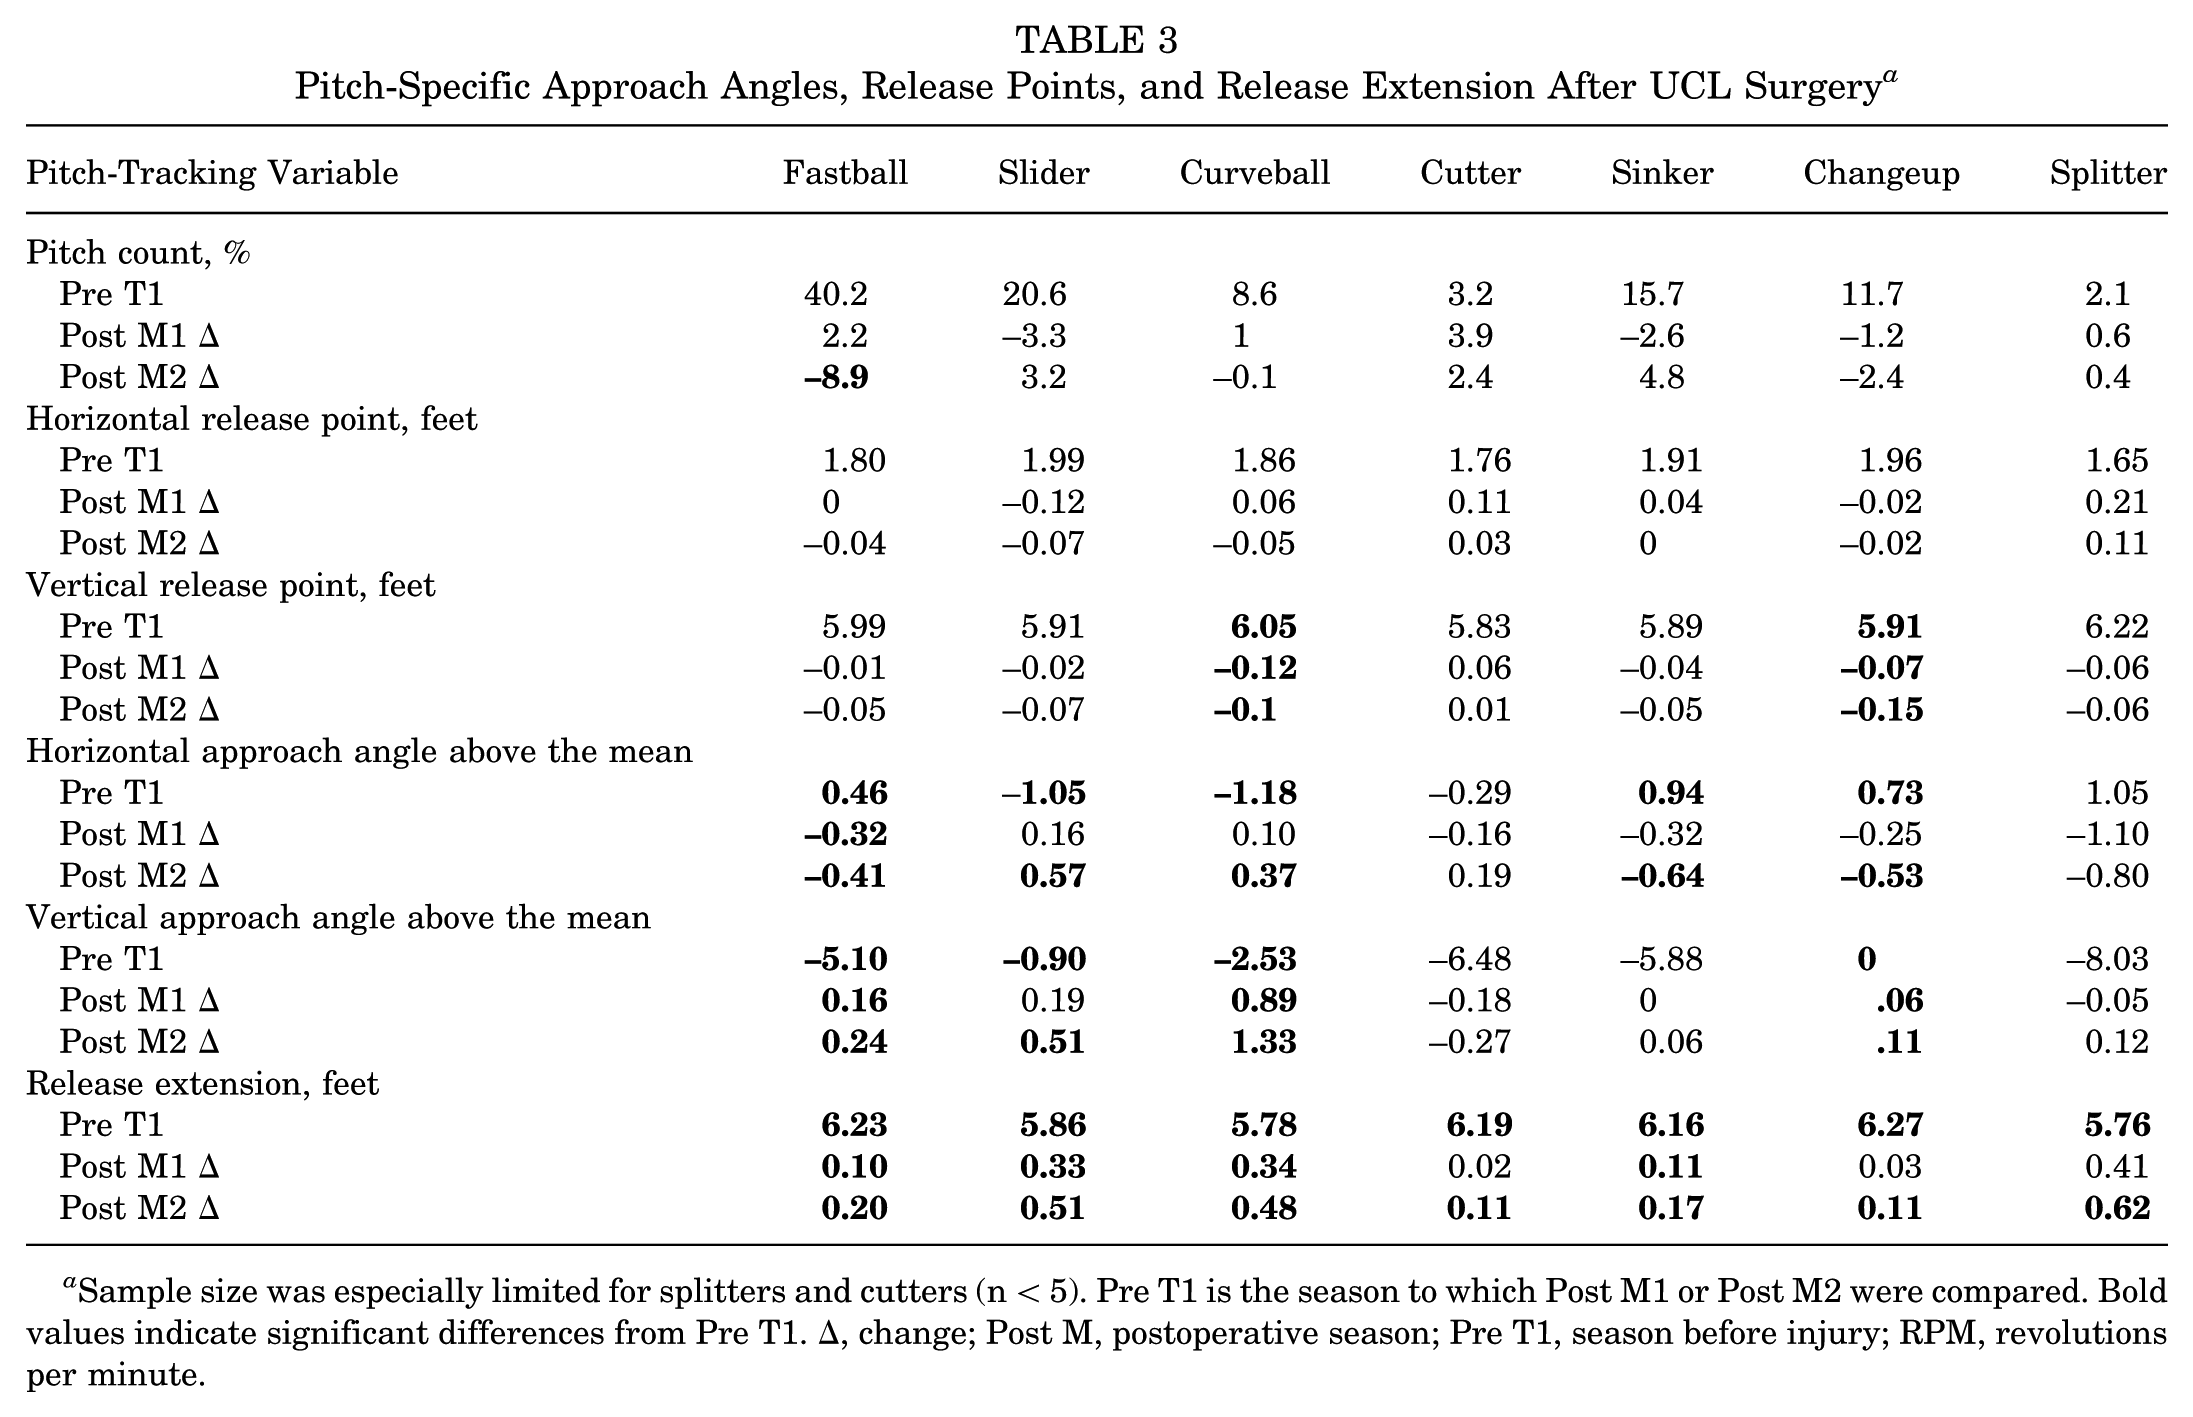
Sample size was especially limited for splitters and cutters (n < 5). Pre T1 is the season to which Post M1 or Post M2 were compared. Bold values indicate significant differences from Pre T1. Δ, change; Post M, postoperative season; Pre T1, season before injury; RPM, revolutions per minute.
Slider velocity was slightly decreased during M1 (P = .04) but recovered by M2 (P = .53), when pitchers also threw their sliders with more release extension (P < .05). Otherwise, there were no significant differences for slider velocity, spin rates, movement, and vertical/horizontal release points, VAA AA, and HAA AA (P > .05). Pitchers had similar Stuff+ but slightly decreased Pitching+ and Location+ for their sliders by M2.
Pitchers threw their curveballs at a slightly lower vertical release point and in more release extension during the M2 season (P < .05). No significant differences were found for curveball velocity, spin rates, movement, and horizontal release point and angle. Pitchers had decreased but similar Stuff+, Pitching+, and Location+ for their curveballs by M2 (P > .05).
Pitchers threw their cutters with more release extension (P < .05) and more horizontal release during the M2 season. Still, otherwise there were no significant differences for cutter velocity, spin rates, movement, and vertical/horizontal release points and angles (P > .05). Stuff+, Pitching+, and Location+ were all decreased during the M1 season (P < .05) but lacked sufficient sample size for M2 analysis.
Pitchers threw their sinkers at a slightly lower vertical release point and in more release extension during the M2 season (P < .05). For both M1 and M2 seasons, pitchers had nonsignificant reductions in sinker spin rates (P = .08 and P = .06, respectively) and in mean vertical movement (P = .15 and P = .05, respectively). Pitchers had their largest decreases in Pitching+ and Location+ for sinkers during the M2 season; Stuff+ was also decreased during M1 (P < .05). No significant differences were found for sinker velocity, horizontal movement, and vertical/horizontal release angles (P > .05).
The changeup spin rate and vertical movement were slightly decreased at M1 (P < .01) but recovered by M2 (P > .12); pitchers also released their changeups with more release extension (P = .03). Pitchers had their largest decrease in Stuff+ for changeups in M2; Pitching+ and Location+ were also decreased (P < .05). No significant differences were found by M2 postoperatively for changeup velocity, horizontal movement, and vertical/horizontal release points and angles (P > .05).
In M2, pitchers threw their splitters with more release extension (P < .05). During M1 and M2 seasons, they also had more horizontal movement but otherwise there were no significant differences for splitter velocity, spin rates, movement, and vertical/horizontal release points and angles (P > .05). There was insufficient sample size for splitter Stuff+, Pitching+, and Location+ postoperative analysis.
The percentage of pitchers who returned to their T1-season pitch-specific performance level was recorded for several advanced analytics and pitch-tracking metrics across the first 3 postoperative seasons, according to the definitions above (Table 4). Notably, a large percentage of pitchers did not return to pitch count across all pitch types, suggesting a decrease in overall workload, as illustrated in previous studies. Pitchers were able to regain their velocity and spin rate nearly 70% of the time by M3, no matter the pitch type. Horizontal and vertical movement also recovered well for each pitch type by M3. Despite small differences in mean value findings, nearly all pitchers returned to performance in their fastballs and sliders’ Stuff+, Location+, and Pitching+ . These generally improved as the pitcher got further from surgery, while the remaining pitches analyzed did not return to performance as frequently. No pitch had a return >44% of the previous performance rate by M3. Binary logistic regression did not identify any pitch-specific predictors of return to performance (Table 5). No specific repair-versus-reconstruction comparison was made, given the extremely limited sample size of repairs across various pitches after the inclusion criteria were applied.
Pitch-Specific Return to Performance After UCL Surgery a

There were no Stuff+, Location+, or Pitching+ M3 values for changeups available, as no pitchers had reached that respective time point at the time of data collection. Given that data for the 3 plus metrics (Stuff+, Location+, and Pitching+) have only been available since 2020, sample sizes for their analysis were further limited. Sample size for the 3 plus metrics during the first season back from injury was 19 for fastballs, 15 for sliders, 14 for curveballs, 12 for cutters, 16 for sinkers, 11 for changeups, and 3 for splitters, as these metrics have only been available since 2020. The sample size during the second season back was 16 for fastballs, 13 for sliders, 13 for curveballs, 10 for cutters, 13 for sinkers, 10 for changeups, and 3 for splitters, as these metrics have only been available since 2020. During the third season back from injury, there were 14 cases for fastballs, 9 for sliders, 8 for curveballs, 6 for cutters, 8 for sinkers, 5 for changeups, and 2 for splitters. Δ, change; M, postoperative qualifying season after returning from injury; RPM, revolutions per minute; UCL, ulnar collateral ligament.
Pitch-Specific Binary Logistic Regression to Identify Predictors of Return to Performance a

There were no significant pitch-specific predictors for return to performance. RP, relief pitcher; SP, starting pitcher.
Discussion
Pitch-specific differences appear to exist in return to performance after UCL surgery. While a small sample size in our study warrants cautious interpretation of our results, no pitch returned to full performance at a rate >44% three seasons after returning from injury, with changeups faring the best. Nearly all pitchers returned to performance in fastball and slider physical pitch qualities (Stuff+), strike-zone command (Location+), and overall ability (Pitching+). In contrast, other pitches (sinkers, cutters, curveballs, splitters, and changeups) struggled more frequently. Pitchers were also relying less on their fastballs, and multiple pitches showed alterations in HAA AA and VAA AA, with significantly longer release extensions. All pitches had recovered to their mean preoperative velocity and movement levels by 2 seasons back, while pitch movement also recovered well for each pitch type. To our knowledge, despite its limitations, this is the most comprehensive pitch-specific return to performance analysis evaluating several advanced analytic and pitch-tracking outcomes for the first time after UCL surgery. Altogether, we believe this study better informs MLB players and teams about expectations regarding return to performance of specific pitch types after UCL surgery.
LaPrade et al 14 highlighted the need to incorporate advanced technology and pitch-tracking into injury and return to play analyses in MLB. Mastroianni et al 19 recently published a return to play and performance analysis during the same time period, evaluating a number of advanced analytic and pitch-tracking metrics, as well as UCL surgery outcomes, for the first time. This study found that pitchers demonstrated decreased overall value, Location+, and Pitching+ after UCL surgery. Fastball velocity was negatively associated with returning to performance, whereas increased spin was positively associated. However, this previous study reported on overall values and lacked pitch-specific outcomes, which requires an even more comprehensive analysis given the number of different pitches thrown and pitcher-specific arsenals. In addition, Mastroianni et al 20 also recently analyzed overall and pitch-specific risk factors for UCL injury and found that pitch-specific differences existed between players who underwent UCL surgery compared with matched uninjured controls. Just as it is important for pitchers and teams to understand which pitches and pitch qualities can increase the risk for injury, it is also important to understand how each pitch will perform after they have returned from UCL surgery. Despite this, there is a lack of data detailing pitch-specific outcomes after UCL surgery, or after the recovery of any injury, in MLB pitchers. Most studies have focused on more basic overall and pitch-specific statistics after UCL surgery. Examining more detailed pitch-specific return to performance outcomes can help guide pitchers through recovery and emphasize pitching strategies that lead to the most success.
An earlier study used preliminary pitch-tracking data to find that pitchers recovered their fastball velocity but decreased fastball usage after revision UCLR. 13 Lu et al analyzed the postoperative fastball quality of 91 MLB pitchers who underwent UCL surgery from 2015 to 2021, finding that fastball velocity, spin rate, and runs above the mean were equivalent to preoperative values by their second season returning from surgery. 15 While fastballs remain the most frequently thrown pitch, modern analytic strategies tend to emphasize decreased usage, since hitters generally have more success and cause more damage against fastballs,2,3 making the impact of other pitches now significantly greater. Akinleye et al. 1 analyzed pitch usage rates and velocity after UCL surgery in MLB pitchers from 2010 to 2020, finding no difference in velocity but an overall trend toward increased use of off-speed pitches after surgery. Portney et al 23 analyzed pitch-specific PITCHf/x data for MLB pitchers who underwent UCL surgery from 2008 to 2013. They found no change in pitch selection, velocity, or ball-and-strike percentages after UCLR. In our study, we found a significant decrease in fastball usage by >6% during the M2 and M3 seasons. Reassuringly, after the initial season where pitchers had significantly decreased fastball velocity, by season 2, after their return, their fastball velocity had recovered to preoperative levels. It is possible that throwing fewer fastballs overall allowed pitchers to go more all-out and throw harder when they did throw a fastball. Regardless, pitchers must regain their fastball velocity after UCL surgery.
Fury et al 7 analyzed 63 MLB pitchers who underwent UCLR from 2015 to 2019 and, for the first time, examined several postoperative pitch-tracking outcomes—including spin rate and pitch movement for individual pitches. They found no significant differences in pitch velocity or release extension. They did find significantly increased postoperative spin rates on curveballs and sliders, curveball horizontal and vertical movement, and significantly decreased horizontal movement for 4-seam fastballs, changeups, and sinkers 2 years after returning from UCL surgery. Portney et al 23 found a more medial release point for nearly all pitch types and changes in movement for certain pitches; however, the public data collected during this time were highly influenced by factors such as a pitcher's placement on the mound, among other confounders. Overall, horizontal and vertical movement recovered well for each pitch type by 3 seasons postoperatively.
Multiple pitches in our case series had alterations in HAA AA and VAA AA, with significantly longer release extensions postoperatively. Greater release extension increases the perceived velocity of the pitch from the batter's perspective and may be a conscious decision by pitchers and teams to enhance the chance of success. Otherwise, the clinical significance of these changes in HAA AA and VAA AA is unknown, although certain trends are beneficial for certain pitches and hitting situations. For example, more negative HAA AA often induces more sweeping movement, while a more positive VAA AA allows fastballs to have more ride or stay up in the zone longer; thus, hitters swing under it. Public data before 2017 required calculating the release point by extracting coordinates from the previously used PITCHf/x cameras. After 2017, MLB switched from PITCHf/x to Statcast's Trackman cameras, which changed how release point and other metrics were calculated. The majority of our release point data comes from after 2017, which could also explain any potential postoperative differences in these metrics compared with previous studies before 2017.
Stuff+, Location+, and Pitching+ were also reported for each pitch. Although the sample size was limited, given that these metrics were developed only in 2020, they are extremely predictive of success for MLB pitchers and are commonly used in player evaluation. 23 Pitch-specific values are compared with means across the league, making it critical to evaluate these metrics to understand whether a particular pitch is still likely to be effective after UCL surgery, although given our small sample size, our findings should be interpreted with caution. In our study, several pitches exhibited small decreases in these advanced metrics postoperatively. Both fastballs and curveballs showed decreased Location+ and Pitching+, suggesting decreased ability and strike-zone command of these pitches. Sinkers had decreased Stuff+ and Location+, suggesting worsening physical pitch qualities and postoperative strike-zone command. Changeups and cutters demonstrated decreases in all 3 advanced metrics, suggesting worsening physical qualities, command, and overall ability. Despite small differences in mean value findings, nearly all pitchers returned to performance in their fastballs and sliders’ Stuff+, Location+, and Pitching+ . These generally improved as the pitcher got further from surgery, while the remaining pitches analyzed did not return to performance as frequently. No pitch had a return >44% of the previous performance rate by M3. While results should be taken with caution secondary to sample size limitations, our findings suggest pitch-specific declines in important advanced analytic metrics following UCL surgery—a finding not previously reported.
Lastly, we defined return to the previous level of performance for each pitch as returning to all preoperative levels for velocity, spin rate, horizontal, and vertical movement. Notably, we did not include Stuff+, Location+, or Pitching+, as we were limited by sample size; these included pitch-tracking metrics are considered in calculating Stuff, Location, and Pitching+ . Sliders had the overall lowest return to the previous performance level; many sliders often reached 3 out of 4 criteria, but had small reductions that prevented them from returning in 1 or 2 variables. Changeups had the highest return to the previous level of performance at 44%, and no other pitch had a return >44% to the previous level of performance by 3 seasons postoperatively. While pitches mostly recovered their important pitch-tracking metrics, small differences prevented the majority of pitches from returning to full form. This preliminary analysis suggests that pitchers may struggle to return to their previous performance levels across all measured pitch-tracking metrics, although larger studies are required.
Limitations
This study is not without limitations. Our sample size was limited, given that much of these data have only been publicly available since 2015 (and 2020 for others), our inclusion criteria, and that pitching arsenals differ for each pitcher, with varying frequencies of each pitch thrown. This limits us from making strong conclusions from our study, but it does provide a comprehensive preliminary view of novel metrics that compares well methodologically to similar studies. More detailed surgical and clinical data could not be obtained, given that our data were collected from public sources, although these public sources have been used previously.18-20,22,23 Therefore, we were unable to determine whether pitching deficits correlated with injury patterns, surgical technique, or postoperative recovery. While the use of MLB's Health and Information Tracking System (HITS) database allows for the collection of these data, to our knowledge the information stored in HITS is largely deidentified, and thus precludes any advanced analytic or pitch-tracking analysis. Further collaboration between MLB and researchers to improve injury analysis is warranted. Although statistical significance was obtained, the clinical significance of our findings is unknown and has not been established in the literature. It remains unclear whether baseball performance metrics correlate with postoperative clinical outcomes, such as elbow joint load to failure or ligament recovery. Future studies looking at this relationship would be worthwhile. While there were some small statistical differences in some mean pitch-specific values, they were often small enough to be still considered as returning to performance based on our subjective definition. We also set subjective definitions and cutoffs for what determined a qualifying season and for how to handle pitchers who received surgery during the off-season. Despite these limitations, we believe our study contributes novel pitch-specific outcome data after UCL surgery in MLB pitchers.
Conclusion
Pitch-specific differences appear to exist in return to performance after UCL surgery. While a small sample size in our study warrants cautious interpretation of our results, no pitch returned to full performance at a rate >44% three seasons after returning from injury, with changeups faring the best. Nearly all pitchers returned to performance in fastball and slider physical pitch qualities (Stuff+), strike-zone command (Location+), and overall ability (Pitching+) while sinkers, curveballs, changeups, cutters, and splitters struggled more frequently in these metrics. All pitches had recovered to their mean preoperative velocity and movement levels by 2 seasons back, while pitch movement also recovered well for each pitch type. Altogether, we believe this study better informs MLB players and teams about expectations regarding return to performance of specific pitch types after UCL surgery.
Footnotes
Appendix
Preoperative and Postoperative Pitch-Tracking Outcomes a

| Season | Velocity (mph) | Spin Rate (RPM) | Active Spin | Spin Axis (degrees) | Horizontal Movement (inches) | Vertical Movement (inches) | Horizontal Release Point (feet) | Vertical Release Point (feet) | HAA (degrees) | HAA above average | VAA (degrees) | VAA above average | Release Extension (feet) | |
|---|---|---|---|---|---|---|---|---|---|---|---|---|---|---|
| *T1 | Mean ± sd | 90.06 ± 3.19 | 2261.26 ± 207.86 | 78 ± 3% | 174.55 ± 29.63 | 9.55 ± 3.16 | 8.09 ± 3.02 | 1.87 ± 0.76 | 5.97 ± 0.45 | -1.50 ± 0.93 | 0.13 ± 0.97 | -6.60- ± 0.57 | -0.02 ± 0.55 | 6.10 ± 0.43 |
| M1 | Mean ± sd | 89.85 ± 2.60 | 2250.33 ± 230.48 | 79 ± 9% | 177.03 ± 24.95 | 9.68 ± 3.15 | 8.44 ± 3.36 | 1.88 ± 0.65 | 5.92 ± 0.45 | -1.02 ± 1.55 | -0.07 ± 0.72 | -6.53 ± 0.59 | 0.03 ± 0.56 | 6.28 ± 0.43 |
| p-value | .25 |
|
.57 | .80 | .49 | .88 | .65 | .77 |
|
0.10 | .77 | .86 |
|
|
| M2 | Mean ± sd | 89.85 ± 2.78 | 2271.64 ± 216.19 | 74 ± 11% | 173.48 ± 25.90 | 9.64 ± 3.45 | 7.72 ± 2.97 | 1.86 ± 0.65 | 5.87 ± 0.43 | 0.16 ± 1.87 | -0.11 ± 0.52 | - 6.49 ± 0.58 | -0.04 ± 0.56 | 6.38 ± 0.39 |
| p-value | .39 | .41 | .27 | .47 | .36 | .09 | .89 |
|
|
0.11 | .43 | .34 |
|
Data are shown as mean ± SD. Significant P values (ie, <.05) are in bold. Horizontal metrics were normalized to pitcher handedness. HAA, horizontal approach angle; RPM, revolutions per minute; VAA, vertical approach angle. Table reproduced with permission from Mastroianni MA, Kunes JA, El-Najjar DB, Obana KK, Desai SS, Morrissette CR, Alexander FJ, Rondon AJ, Trofa DP, Popkin CA, Levine WN, Ahmad CS. Return to Performance After Ulnar Collateral Ligament Surgery in Major League Baseball Pitchers. Am J Sports Med. 2025 Jan;53(1):104-114. doi: 10.1177/03635465241289142. PMID: 39741491.
Acknowledgements
The authors acknowledge Eno Sarris and Max Bay as the developers of the Stuff+, Location+, and Pitching+ statistics used in this article, as well as Alex Chamberlain and Jon Rogele for their public data consolidation and data analysis insight.
Final revision submitted January 20, 2026; accepted January 27, 2026.
One or more of the authors has declared the following potential conflict of interest or source of funding: C.S.A. receives consulting fees and royalties from Arthrex. He also serves as the head team physician of the New York Yankees. AOSSM checks author disclosures against the Open Payments Database (OPD). AOSSM has not conducted an independent investigation on the OPD and disclaims any liability or responsibility relating thereto.
Ethical approval was not sought for the present study.