
Abstract
Background:
Major League Baseball (MLB) implemented a new Pitch Clock in 2023, sparking debate on whether it has affected injuries among pitchers.
Hypothesis:
Introduction of the Pitch Clock would have no impact on ulnar collateral ligament (UCL) surgery rates or pitcher performance.
Study Design:
Cohort study; Level of evidence, 3.
Methods:
Season-to-season surgery trends were evaluated, and a retrospective case-control analysis was conducted on all MLB pitchers who underwent UCL surgery from the beginning of the 2018 season to the end of the 2024 season. Matched controls were identified in a 2 to 1 ratio, similar to previous studies, and pitch timer data from matched pairs since 2023 were compared. Advanced analytic and pitch-tracking metrics were also analyzed to see whether there was any impact from the pitch timer. Data were collected from publicly available web sources affiliated with MLB and have been used in previous studies. Statistical analysis consisted of unpaired t tests comparing cases and controls, as well as binary logistic regression.
Results:
There was no difference in the number of UCL surgeries per season since the Pitch Clock was implemented in 2023 compared with the 4 full seasons prior (P = .64). There was a significant trend of surgeries earlier in the season since Pitch Clock implementation (P = .04). Furthermore, 52 MLB pitchers who underwent a UCL surgery were then identified alongside 104 matched controls. No significant differences were observed in pitch timer duration or fast pitch percentage between cases and controls. Also, no significant differences were found in velocity, spin rates, pitch quality (Stuff+), overall pitching ability (Pitching+), strike-zone command (Location+), release points, approach/release angles, or extension. Outside of vertical movement, binary logistic regression did not identify any potential risk factors for UCL injury. No significant differences were found in pitch-tracking metrics between cases or matched controls before (2018–2022) and after implementation of the Pitch Clock (2023–2024) (P > .05).
Conclusion:
Overall, this preliminary study suggests that the newly implemented Pitch Clock may not increase the overall rate of UCL surgeries in MLB pitchers. However, there has been a significant increase in the percentage of starting versus relief pitchers undergoing UCL surgery since the inception of the Pitch Clock. Reassuringly, the Pitch Clock also did not have a concerning impact on pitching performance in MLB pitchers. Further monitoring of injury trends after the implementation of the Pitch Clock in MLB is warranted.
Keywords
Major League Baseball (MLB) implemented a new Pitch Clock in 2023, raising debate on whether it has impacted injury rates in pitchers. Once the pitcher receives the ball back from the catcher, they have 15 seconds with the bases empty and 20 seconds with runners on base until they can begin their pitching motion; otherwise, the umpire will call an automatic “ball.” The timer was further reduced to 18 seconds with runners on base 26 in 2024. Together, these were significant rule changes aimed at lowering bloated game times.
Overall, the mean pitch tempo decreased from 20.1 to 16.8 seconds between 2022 and 2023, and overall game times were reduced by 24 minutes to a mean of 2 hours and 40 minutes in 2023 and by 28 minutes to a mean of 2 hours and 36 minutes in 2024.2,42 College baseball previously implemented its own Pitch Clock rules in 2011, and various levels of Minor League Baseball (MiLB) have utilized pitch clocks to some degree. 37 Despite the significant impact these pitch clocks can have on game play and the increasing problem of ulnar collateral ligament (UCL) injuries over the past decade, the impact a Pitch Clock may have on injury rates is relatively unknown. A previous media report, citing data provided by club medical personnel, stated that injuries slightly decreased the year after the Pitch Clock was implemented in MiLB. 33 However, minimal clinical data have been reported otherwise.
A more recent media report 28 has cited an increase in MLB pitching injuries since the Pitch Clock was implemented in 2023; however, one recent 2024 peer-reviewed study 33 found no differences in Tommy John rates in 2023 compared with 2022 or 2021. No further injury breakdown or analysis of pitch timer or pitch-tracking data was included. This lack of data on the subject has led the Major League Baseball Players Association to issue a public statement expressing significant concern about the impact of the Pitch Clock on injuries. Several prominent major leaguers have also spoken out against the Pitch Clock, citing it as a probable cause for the increased severity of injuries.32,38,42 MLB responded by citing unpublished data suggesting that the Pitch Clock had no impact on injury. 12
Previous predictive model research has shown that a faster pace of play rules may lead to enhanced fatigue in the flexor-pronator mass muscle, which could put the UCL at a higher risk. 33 Furthermore, a randomized controlled trial involving 7 pitchers showed that using a 20-second Pitch Clock compared with a 12- or 8-second timer led to reduced velocity and accuracy in starting pitchers later in that same game. 37 Through bloodwork, the authors also found increased signs of muscle damage and inflammation >2 days after a game, suggesting delayed recovery. Citing this data, they did not support the use of a Pitch Clock. 37 Otherwise, the impact of a Pitch Clock on pitching injuries and surgery rates is widely unknown, even though MLB began releasing individual pitch timing data on its public Statcast platform.
Therefore, the primary objective of this study was to evaluate the effect of the new Pitch Clock on UCL surgery rates. Our secondary objective was to analyze how the pitch clock impacted pitch-tracking metrics in both cases and matched controls, or whether any pitch-tracking metrics could help explain any increase in UCL surgery rates since the implementation of the Pitch Clock. Our tertiary objective was to conduct subgroup analyses to find whether starting pitchers were impacted differently than relief pitchers. We hypothesized that the introduction of the Pitch Clock would have no impact on UCL surgery rates or pitcher performance. Altogether, we hope this study provides preliminary information on the impact of the Pitch Clock and serves as a foundation for future studies and the development of more informed pace-of-play rules.
Methods
Study Design
Our study was deemed exempt from institutional review board approval, as it did not involve human subjects (45 CFR 46.102). We conducted a retrospective analysis of all MLB pitchers who underwent primary UCL reconstruction (UCLR) or UCL repair using public data from April 1, 2018, to November 30, 2024. During the study period, 143 MLB pitchers were identified with UCL injuries requiring surgery using a public Tommy John Surgery database and cross-referenced with public reports,25,29,30 which have been used previously in other studies and cross-referenced with official press releases.8,25,26 The 2020 season was significantly shortened by the coronavirus disease 2019 (COVID-19) pandemic, with many players opting out of the season; therefore, it was not included in any further analysis. Similar to previous studies,8,25,26 a control cohort matched 2 to 1 by season, age, position, handedness, and pitch count was randomly selected. This matched control cohort was used to compare various pitch timers, advanced analytics, and pitch-tracking metrics both before and after the implementation of the Pitch Clock, to gain insight into whether the Pitch Clock could be impacting injury trends alongside pitching performance.
A qualifying season was defined as a season in which a pitcher threw at least 100 pitches or 10 innings in that season. Also, 100 pitches have previously been used as a pitch threshold to determine a qualifying season and have been deemed a reliable indicator of advanced analytics. 24 Since the Pitch Clock began in the 2023 season and ended in November 2024, a total of 58 cases were identified. For 2023 cases, pitchers were included in the demographic analysis but excluded from pitch timer and pitch-tracking analysis if they did not have preinjury data in the index season of surgery. For all other seasons (2018–2022 and 2024), they were included in the demographic analysis but excluded from pitch timer and pitch-tracking analysis if they did not have preinjury data in the index season of injury or the qualifying season preceding the injury. Since the goal of this study is to examine the impact of the Pitch Clock, which was implemented at the beginning of the 2023 season, including 2023 cases who only had preinjury data in the seasons before 2023 would have included data used before the implementation of the Pitch Clock. Using these inclusion criteria, 8 cases from the 2023–2024 season were excluded from further pitch timer, advanced analytic, and pitch-tracking analyses.
Data Collection
Season and monthly breakdown of UCL surgeries were recorded, with the acknowledgement that dates of surgery occurred later than the date of injury. A season was considered to start and end on February 15th (just before the start of Spring Training) of the following season. Given the theoretical concern about increased fatigue with the implementation of the Pitch Clock, a monthly breakdown was deemed important to determine whether pitchers were getting injured later in the year as the effects of fatigue theoretically became more pronounced.
Player data—including age, height/weight, body mass index, handedness, type of pitcher (starting or relief), draft position, and pitch count—was collected from well-regarded public websites such as FanGraphs 13 and Baseball-Reference.com, and stored on a Microsoft Excel spreadsheet. Pitchers who started in ≥50% of games they played in the season or before injury were designated as starting pitchers, or relief pitchers if they started in <50% of games. FanGraphs Wins above replacement, expected fielding-independent pitching, and skill-interactive earned run average were also recorded. Data on stuff+, pitching+, and location+ began to be recorded in 2020 and is available on FanGraphs. For these metrics, a score of 100 represents the approximate league average relative to other similar pitches. 24 Definitions of these terms are available in Table 1.
The Definitions of Commonly Used Advanced Analytics in MLB a

ERA, earned run average; fWAR, FanGraphs wins above replacement; MLB, Major League Baseball; SIERA, skill-interactive earned run average; UCL, ulnar collateral ligament; xFIP, expected fielding-independent pitching. Table reproduced with permission from Mastroianni MA, Kunes JA, El-Najjar DB, et al. Advanced analytic and pitch-tracking metrics related to risk factors for UCL surgery in Major League Baseball pitchers: a case-control study. Orthop J Sports Med. 2024;12(12):23259671241302432.
For stuff+, pitching+, and location+, a score of 100 approximately represents the league average.
Baseball Savant 3 (www.baseballsavant.mlb.com) was used to obtain Statcast pitch-tracking data from high-resolution camera systems (Hawkeye) installed in each stadium and released publicly by MLB.3-6,11 This Statcast data measures ball speed, spin, release point, approach angles, and movement in multiple directions for each pitch in a player's repertoire. Pitch-tracking variables are defined in Figures 1 and 2, along with previous research26,27 (Figure 1). Horizontal and vertical release angles measure the degree of the ball relative to home plate at the point when the pitcher releases it. Negative angles indicate a trajectory to the left, while positive angles indicate a trajectory to the right. This is different from the horizontal approach angle (HAA) and the vertical approach angle (VAA), which measure the angle of the baseball as it crosses home plate. The HAA takes into account the release point, pitch location, and pitch movement to measure the left-to-right (or right-to-left) angle as the pitch enters the zone.

Spin pitch-tracking data. The spin rate measures revolutions of the baseball per minute. The active spin measures the percentage of spin that contributes to movement, while the spin axis measures a baseball's direction of spin in 3 dimensions. The spin axis is often described similarly to a clock (ie, 5 o’clock), which we converted into degrees to facilitate statistical analysis. Figure reproduced with permission from Mastroianni MA, Kunes JA, El-Najjar DB, et al. Advanced analytic and pitch-tracking metrics related to risk factors for UCL surgery in Major League Baseball pitchers: a case-control study. Orthop J Sports Med. 2024;12(12):23259671241302432.

Release point, approach angle, and movement pitch-tracking data. These metrics are measured from the catcher's point of view. Horizontal and vertical release points are measured as the relative distance between the point at which a pitcher releases the ball relative to home plate. Horizontal and vertical movements are the amount a pitch moves from the time a pitcher releases the ball to the moment it crosses home plate. The VAA describes the angle from which a pitcher releases the ball to when it crosses home plate vertically, while the HAA captures the same horizontally. The release extension quantifies how close a pitcher's release point is to home plate; a pitcher with a longer release extension shortens the distance between them and the batter, leading to an increased perceived velocity of the pitch. HAA, horizontal approach angle; VAA, vertical approach angle. Figure reproduced with permission from Mastroianni MA, Kunes JA, El-Najjar DB, et al. Advanced analytic and pitch-tracking metrics related to risk factors for UCL surgery in Major League Baseball pitchers: a case-control study. Orthop J Sports Med. 2024;12(12):23259671241302432.
Pitch timing data began to be collected after the Pitch Clock was implemented in the 2023 season. Data were recorded for both when runners were on base and when the bases were empty, given the inherent differences in pitching motions. Pitch tempo measures the time between pitch releases, with the clock starting as soon as the pitcher releases one pitch and ending when the pitcher releases the next pitch. The pitch timer equivalent is the duration from when the pitch timer starts to when the pitcher begins his delivery. The fast pitch percentage (%) is the rate of pitches thrown within 15 seconds of receiving the baseball, and the slow pitch % is the rate of pitches thrown after 30 seconds of receiving the baseball. Typically, 6 seconds elapse from a pitcher's "start of delivery" to "receiving the return throw"—1.5 seconds for the pitcher to release the pitch, 0.5 seconds for the pitch to travel from the pitcher to the catcher, and 4 seconds for the ball to return from the catcher back to the pitcher. Therefore, the difference between pitch tempo and pitch timer equivalent for each pitcher takes this into account.
Statistical Analysis
Seasonal and monthly calculations of UCL surgeries from April 1, 2018, to November 31, 2024, were plotted on Microsoft Excel, along with means and standard deviations of each continuous variable. Unpaired t tests were used to compare continuous variables between cases and controls, while chi-square tests were used to compare categorical variables. Pitch-tracking analysis comparing pitchers who underwent UCL surgery before the implementation of the Pitch Clock (2018–2022) with pitchers who underwent UCL surgery after the start of the Pitch Clock (2023–2024), along with a comparison of the respective matched control groups, was also completed to see whether the Pitch Clock impacted pitch-tracking metrics. Binary logistic regression for pitch timer duration and pitch-tracking variables was found to be significant (P < .10) in unpaired t tests. It was included to identify whether they were associated with UCL surgery.
Subgroup analyses between starting and relief pitchers were also conducted. Movement, release point, release angle (HRA), approach angle (HAA), and approach angle above average (AA) were all normalized similarly to previous studies currently in submission. All data analysis was performed using R statistical software (R Foundation for Statistical Computing), Excel for Mac (Microsoft Corp), and SPSS Version 26 (IBM). Statistical significance was set at .05 for t tests and logistic regression. An a priori power analysis was conducted using G*Power3 to test the difference between 2 independent group means using a 2-tailed test, using both a moderate (d = 0.5) and a large effect size (d = 0.75), with an alpha of .05. Results showed that a total sample of 102 participants was needed to achieve a power of .80, with a moderate effect size and 46 participants for a large effect size, indicating that our analysis of >150 MLB pitchers was likely well powered. Post hoc power analysis yielded a power of 1.0.
Results
No difference was observed in the number of UCL surgeries per season since the Pitch Clock was implemented in 2023 compared with the 4 full seasons prior (P = .64). A total of 32 MLB pitchers underwent UCL surgery during the 2024 season, 26 pitchers during the 2023 season, 26 pitchers during the 2022 season, 31 pitchers during the 2021 season, 26 pitchers during the 2019 season, and 28 pitchers during the 2018 season 29 (Figure 3). Monthly breakdown of UCL surgeries reveals a significant trend of more injuries in the first 2 months of the season since Pitch Clock implementation (P = .04). There were a combined 13 surgeries in April/May in 2024 and 12 in 2023 compared with 7 in 2022, 9 in 2021, 2 in 2019, and 6 in 2018 (Figure 3). However, there were 10 UCL surgeries during the Spring Training of the 2021 season upon return from the COVID-shortened 2020 season. Furthermore, a significant increase was observed in the percentage of starting versus relief pitchers undergoing UCL surgery after the Pitch Clock was implemented compared with the 4 full seasons prior (P = .01) (Figure 4).

Annual and monthly breakdown of UCL surgeries since the 2018 Season. The 2020 data were omitted due to the significantly shortened season during the COVID pandemic. Data were collected up until November 31, 2024. A season was considered to start and end on February 15th of the respective year, just before the start of Spring Training. Bolded lines represent seasons played after the implementation of the Pitch Clock, while dotted lines represent seasons played before. COVID, coronavirus disease 2019; UCL, ulnar collateral ligament.
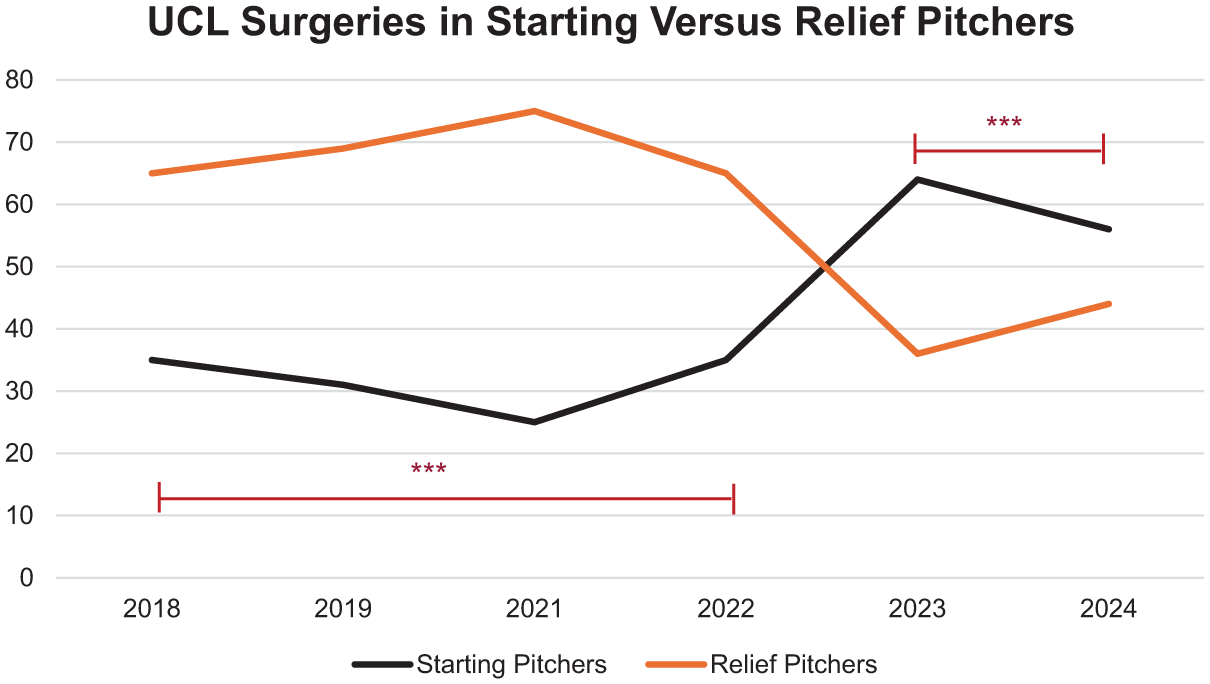
Percentage of starting versus relief pitchers undergoing UCL surgery before and after the implementation of the Pitch Clock in 2023. A significant increase was observed in the percentage of starting versus relief pitchers undergoing UCL surgery after the Pitch Clock was implemented, compared with the 4 full seasons prior (2022, 2021, 2019, and 2018; P = .01). The 2020 data were omitted due to the significantly shortened season during the COVID pandemic. Data were collected up until November 31, 2024. A season was considered to start and end on February 15th of the respective year, just before the start of Spring Training.
A total of 58 MLB pitchers who underwent UCLR or repair since the implementation of the Pitch Clock were compared with 116 matched controls. The mean age was 27.5 ± 3.3 years in cases and 27.6 ± 3 years in controls, with 76.4% being right-handed and 56.4% being starting pitchers (Table 2). No differences were found in pitch counts or innings pitched during either the season of injury or the careers of cases versus controls (P > .10). The only significant difference in demographic characteristics was that the cases had a significantly higher proportion of players who joined MLB as international free agents compared with controls (P = .03) (Table 2).
Demographic Characteristics of Cases and 2 to 1 Matched Controls a

Bold values indicate statistical significance. BMI, body mass index; IFA, signed as an amateur international free agent rather than via draft; MLB, Major League Baseball.
Thirteen cases and their respective controls were then excluded from further analysis, given they did not meet our inclusion criteria (threw <100 pitches in the season of injury or the season before injury). With both runners on base and with the bases empty, there was no significant difference in pitch tempo, pitch timer duration, fast pitch percentage, or slow pitch percentage between cases and controls (P > .05) (Table 3).
Pitch Timer Data Comparing MLB Pitchers Who Underwent UCL Surgeries to Matched Controls Since the Start of the Pitch Clock a

All data were recorded by MLB through Statcast and BaseballSavant.com from the implementation of the Pitch Clock before the 2023 season to the end of the 2024 regular season. Data were recorded for both when runners were on base and when the bases were empty, given the inherent differences in pitching motions. Pitchers were excluded if they did not throw >100 pitches during the season of injury. The pitch tempo measures the time between pitch releases (with the clock starting as soon as the pitcher releases one pitch and ending when the pitcher releases the next pitch). The pitch timer equivalent is from when the pitch timer starts to when the pitcher begins his delivery, and the pitch timer ends. The fast pitch % is the rate of pitches thrown within 15 seconds of receiving the baseball, and the slow pitch % is the rate of pitches thrown after 30 seconds of receiving the baseball. MLB, Major League Baseball.
Pitch-tracking analysis showed that 2023–2024 cases had significantly more vertical movement on their pitches than their respective matched controls (P = .02), but otherwise there were no significant differences in velocity, spin rates, pitch quality (Stuff+), strike-zone command (Location+), overall pitching ability (Pitching+), release points, approach angles, release angles or extension (P > .05) (Table 4). Pitch-tracking analysis comparing pitchers who underwent UCL surgery before the implementation of the Pitch Clock with pitchers who underwent UCL surgery after the Pitch Clock's introduction, along with a comparison of the respective matched control groups, was also completed to determine whether the Pitch Clock affected pitch-tracking metrics. Cases from before the implementation of the Pitch Clock (2018–2022) had significantly superior velocity, expected fielding-independent pitching, pitching+, and a more negative VAA AA than matched controls from before the implementation of the Pitch Clock (2018–2022; P < .05). Compared with cases after the Pitch Clock implementation, pitchers who underwent UCL surgery from 2018 to 2022 had significantly greater pitching ability and a more vertical releasee point (P < .05). Pitchers in 2023–2024 had a significantly greater release extension than pitchers in 2018–2022.
Comparison of Preinjury Advanced Analytics and Pitch-Tracking Data for Pitchers Who Underwent UCL Surgery Both Before and After Pitch Clock Implementation Versus Matched Controls a

All MLB pitchers who underwent UCL surgery from April 2018 to the end of the 2024 regular season and had adequate preinjury data were recorded. These cases were then separated into groups by season before the implementation of the MLB Pitch Clock (2018–2022; n = 102) and after implementation (2023–2024; n = 48), along with their respective matched controls. An unpaired t test was completed for both 2023–2024 cases versus controls, along with 2018–2022 cases versus 2018–2022 controls. Comparisons were also made between 2018–2022 cases and 2023–2024 cases, as well as between 2018–2022 controls and 2023–2024 controls, to determine whether the implementation of the Pitch Clock affected pitch-tracking metrics. AA, above average; fWAR, FanGraphs wins above replacement; HAA, horizontal approach angle; mph, miles per hour; N/A, not applicable; RPM, revolutions per minute; SIERA, skill-interactive earned run average; UCL, ulnar collateral ligament; VAA, vertical approach angle; xFIP, expected fielding-independent pitching. Stuff+ measures overall pitch quality, Location + measures command, and Pitching+ measures overall pitching ability. Stuff+, Pitching+, and Location+ are all scaled similarly to intelligence quotient—a score of “100” is considered the league average.
indicates significant P values (P < .05) in bold when comparing 2023–2024 cases versus 2023–2024 controls.
indicates significant P values (P < .05) in bold when comparing 2018–2022 cases versus 2018–2022 controls.
indicates significant P values (P < .05) in bold when comparing 2018–2022 cases versus 2023–2024 cases.
indicates significant P values (P < .05) in bold when comparing 2018–2022 controls versus 2023–2024 controls. Horizontal and vertical release angle values were only available for the 2023–2024 season.
Outside of potentially vertical movement, binary logistic regression did not identify any potential risk factors for UCL surgery since the implementation of the Pitch Clock at the beginning of the 2023 season. Pitch timer duration was not associated with UCL surgery.
Subgroup analyses between starting and relief pitchers yielded no significant differences in pitch timer duration, fast pitch percentage, or slow pitch percentage. On average, starters and cases threw with shorter duration and a higher rate of fast pitches, but this was not found to be significant (P > .05) (Table 5). Starting pitchers had significantly more vertical movement in cases versus matched controls (P = .02); otherwise, there were no significant demographic, advanced analytic, or pitch-tracking differences between any of the subgroups (P > .05).
Subgroup Analyses of Pitch Timer Durations Between Starting Versus Relief Pitchers a

Data are presented as mean ± SD. No significant differences were found between subgroups. On average, starters and cases did throw with shorter duration and a higher percentage of fast pitches. The pitch timer duration is from when the pitch timer starts to when the pitcher begins his delivery, and it ends. The fast pitch % is the rate of pitches thrown within 15 seconds of receiving the baseball, and the slow pitch % is the rate of pitches thrown after 30 seconds of receiving the baseball. RPs, relief pitchers; SPs, starting pitchers; UCL, ulnar collateral ligament.
Discussion
Overall, this preliminary short-term study suggests that, within the constraints of the new pitch clock, pitch tempo, and timer duration, there does not appear to be a difference between MLB players who underwent UCL surgery and their healthy counterparts. However, since the Pitch Clock's inception, there has been a significant increase in the percentage of starting pitchers undergoing UCL surgery, along with a trend of injuries occurring earlier in the season. Reassuringly, the Pitch Clock also did not appear to have a concerning impact on performance or advanced analytics for MLB pitchers. Further investigation of the impact on pitch timing and injury incidence is warranted as the data continues to expand, and this should be balanced with the potential benefits of an enhanced pace of play. Altogether, there are likely multiple contributing factors that increase the risk for UCL surgery in MLB pitchers in this current environment. This study provides a preliminary analysis of the impact of the newly implemented Pitch Clock on UCL surgery rates in professional pitchers.
Puga et al 33 recently investigated various injury rates since the implementation of the MLB Pitch Clock—including the rate of Tommy John surgeries, using different public sources. They found no difference in surgery rates for 2023 compared to 2022 or 2021, but there was no further breakdown of injuries or analysis of pitch timer or pitch-tracking data. In a recent 5-year study we published on UCL injuries from 2018 through 2023, utilizing the same databases, only 32% of cases were starting pitchers, a significantly lower percentage than we found (55%) since the implementation of the Pitch Clock before the 2023 season. 25 Other previous studies have also shown that UCL injuries in modern baseball players are mainly found in relief pitchers,8,26 who occupy more roster spots than starting pitchers but throw fewer innings.
Given the increasing trend of starting pitchers injuring their UCLs since the implementation of the Pitch Clock, analyzing whether there are any differences in pitch timer duration or fast pitch percentage is critical to understanding whether the Pitch Clock may differentially impact starters. We did not find pitch timer duration to be associated with UCL injury (P > .05) (Table 3). Subgroup analyses comparing starting versus relief pitchers with UCL injuries showed a trend toward faster pitch timer durations in starting pitchers; however, these findings were ultimately underpowered (P > .05) (Table 5). Therefore, this trend in particular is worth monitoring. Starting pitchers may be “maxing out” their velocity, expecting shorter overall innings totals, which, in addition to having more repetitions than relievers, may make them particularly susceptible to increased fatigue secondary to a shorter Pitch Clock. 33 In addition, relievers often come in with runners on base and thus have a longer time allowed between pitches.
Statistical analysis was limited; however, a monthly breakdown of UCL surgeries also revealed a significant trend of more surgeries occurring in the first 2 months of the season. Common baseball thinking, with the popularization of load management and workload monitoring,10,14-16,36,43 suggests that fatigue is more likely to impact players toward the second half of the season, as the physical demands and grueling nature of a 162-game season begin to take its toll. Therefore, this early-season trend is important to acknowledge and may signal a need to adapt Spring Training or early-season workloads to account for the Pitch Clock changes.
The UCL reportedly has a mean ultimate load of failure of 32-34 Nm,1,2 which is exceeded by nearly every throw made by an MLB pitcher.13,34,40 Thus, various adaptive changes, along with the strength of dynamic joint stabilizers such as the flexor-pronator mass, are crucial for maintaining the integrity of the UCL. Sonne and Keir 39 have previously demonstrated how a Pitch Clock may lead to enhanced flexor-pronator mass fatigue. Thus, it is possible that the Pitch Clock diminishes muscle recovery and therefore lowers the injury threshold at an accelerated rate, or has a greater effect earlier in the season as pitchers continue to ramp up their workload from the offseason. A randomized controlled trial conducted by Yang et al 44 in 2016 on 7 pitchers further illustrates this, as they examined the effects of 8-, 12-, and 20-second Pitch Clocks on performance and blood markers of inflammation. Elevated levels of creatine kinase and interleukin-10 were observed up to 2 days after the game in the 8- and 12-second Pitch Clock cohort compared with the 20-second Pitch Clock, indicating inflammation and prolonged muscle recovery. 37 Citing these data, they did not support the use of a Pitch Clock in MLB.
Previous research has also shown that rapid improvement in overall pitching ability may predispose to injury. 25 Given the importance of adaptive changes in maintaining stability of the elbow,19,21 perhaps drastic increases in routine or workload itself can predispose to injury. This thinking could also help explain why there were so many UCL surgeries in the 2021 Spring Training, after the shortened 2020 season when pitching workloads were at a low. Future biomechanical research should more specifically investigate how reduced pitch timer duration may influence fatigue and, consequently, the risk of injury.
Recently, LaPrade et al 23 highlighted the need to incorporate advanced technology and pitch tracking used throughout MLB into injury and return to play analyses. While the majority of studies on MLB pitchers have focused primarily on traditional statistics,7,9,17,20,22,23,31,35,41 risk factor and return to performance analyses for UCL injuries utilizing several advanced analytics and pitch-tracking variables were recently evaluated.26,27 We recently published a larger 5-year study, covering the 2018 through 2023 seasons, and found that MLB pitchers who threw harder with less fastball usage, along with those who had superior overall pitching ability (Pitching+) and strike-zone command (Location+), were more likely to undergo UCL surgery. 26 These findings are again similar to our findings in this study when comparing cases versus controls from before implementation of the Pitch Clock (2018–2022), and when you combine all cases versus all matched controls throughout the entirety of this study (2018–2024). Cases from before the Pitch Clock implementation also demonstrated superior pitching ability compared with cases after implementation, without a significant decline in controls, possibly suggesting that other factors are at play in the most recent seasons. Horizontal and vertical release angles were not previously examined, but we did not find them to be associated with UCL surgery (P > .05). Pitchers in 2023–2024 had significantly more release extension than pitchers in 2018–2022, which likely reflects recent pitching trends to maximize extension to decrease overall reaction time for hitters once the ball is released. Otherwise, the Pitch Clock did not seem to have a concerning impact on performance or advanced analytics for MLB pitchers, which is important information for MLB to know when weighing the pros and cons of the Pitch Clock. Determining patterns that predispose to injury is critical to developing safer player development protocols.
This study has several limitations. Our study did not include pitch tempo data from before the Pitch Clock implementation; having these data would have allowed us to examine whether pitchers who preferred to work more slowly were more likely to have UCL surgery than pitchers who worked quickly. However, MLB changed its pitch timer definitions once the Pitch Clock was implemented, now excluding time lost secondary to pick-off attempts, batter delays (which were automatically granted), and more, making it difficult to rely on the reported times for each pitcher before 2023. Given that the Pitch Clock has only been implemented since the 2023 season, our sample size is limited and potentially underpowered, although our power analysis indicated a well-powered sample size. Given these preliminary data, our findings on individual t tests should especially be interpreted with caution, but we did include binary logistic to account for the large number of available pitch-tracking variables. All potential cases were evaluated, and despite limitations in sample size, this was the largest and most comprehensive study to date investigating the impact of the Pitch Clock on UCL surgery rates using objective metrics. Additionally, there is a substantial public debate regarding the effects of the Pitch Clock, without any previous evidence to consider. Of the recent rule changes instituted by MLB, the Pitch Clock arguably has the most substantial impact on the fan experience, drastically shortening bloated game times and thus making it a critical component of MLB's enhanced pace of play initiatives. This makes it even more important to understand the clinical significance of our findings, which is currently unknown and should be a focus of future research. Data for this study were obtained entirely from public sources, although these have been used in multiple previous studies, and the pitch timer and tracking data are released directly by MLB.8,23,26,29,41 While it is difficult to confirm that public injury data are complete, 18 when coupled with the significant growth of sports media coverage, reporting on injuries that require prolonged absences and often surgical interventions is more likely to be accurate. This is likely especially true with the heightened focus on UCL injuries in MLB pitchers by the public and national media outlets. Future efforts that make player medical records more easily accessible for anonymized research would be helpful. We also reported on UCL surgeries to serve as a proxy for gaining insight into the association between these metrics and UCL injuries; however, this omits injuries in MLB pitchers that were treated nonoperatively. Lastly, given the case-control study design, causation cannot be determined, and only associations can be made. Due to the significant debate surrounding the Pitch Clock, we believe that the contributions made by our study outweigh these inherent limitations.
Conclusion
This study provides preliminary evidence that the newly implemented Pitch Clock does not significantly impact the incidence of UCL surgeries. However, these conclusions should be taken with caution until further data accumulate. However, since its inception, there's been a significant increase in the percentage of starting versus relief pitchers undergoing UCL surgery. Reassuringly, the Pitch Clock did not have a concerning impact on performance or advanced analytics for MLB pitchers. Further monitoring of potential trends in pitch timing and injury incidence is warranted as the data continue to expand in the era of the Pitch Clock. We hope this study provides a template for these future studies. Altogether, there are likely multiple contributing factors that create an enhanced risk for UCL surgery in MLB pitchers in this current environment.
Footnotes
Acknowledgements
The authors would like to acknowledge Eno Sarris and Max Bay for developing certain metrics used in this article, as well as Alex Chamberlain and Jon Roegele for public data collection and insight into data analysis used in this study.
Final revision submitted June 3, 2025; accepted June 26, 2025.
One or more of the authors has declared the following potential conflict of interest or source of funding: C.S.A. has received consulting fees, nonconsulting fees, and royalties from Arthrex. AOSSM checks author disclosures against the Open Payments Database (OPD). AOSSM has not conducted an independent investigation on the OPD and disclaims any liability or responsibility relating thereto.
Our study was deemed exempt from institutional review board approval by the Institutional Review Board at Columbia University Medical Center, as it did not involve human subjects (45 CFR 46.102).