
Abstract
Background:
Tibiofemoral rotational malalignment, recognized as a risk factor for recurrent patellar dislocation (RPD), has become a research focus. Although the relationship between femoral morphology and RPD is widely studied, the association between RPD and the tibial plateau and meniscus geometries related to the tibiofemoral rotation remains unexamined.
Hypothesis:
After accounting for the classic risk factors associated with knee rotation—tibial tuberosity-trochlear groove (TT-TG) distance and tibiofemoral angle (TFA)—targeted anatomical parameters are independently associated with adult RPD.
Study Design:
Cross-sectional study; Level of evidence, 3.
Methods:
This retrospective case-control study included 50 adult patients with RPD and 50 age-, sex-, and body mass index-matched controls. Knee magnetic resonance imaging scans were used to assess parameters—including the lateral tibial slope (LTS), medial tibial slope (MTS), lateral tibial height (LTH), medial tibial depth (MTD), medial meniscal bone angle (MMBA), MTS−LTS (slope difference), MTS: LTS ratio, MTS: MMBA ratio, TT-TG distance, and TFA. Differences among groups were compared; a multivariate logistic regression model was created to evaluate independent factors, and the diagnostic performance of the substantial risk factors, individually and in combination, was assessed.
Results:
The LTS (P = .002), LTH (P < .001), MMBA (P < .001), MTS−LTS (P = .001), MTS: LTS ratio (P = .001), TT-TG distance (P < .001), and TFA (P < .001) were found to be significantly different between the groups. Logistic regression analysis identified the LTH (odds ratio [OR], 0.409; P = .014), MMBA (OR, 1.456; P < .001), and TT-TG distance (OR, 0.752; P ≤ .001) as independent adult RPD risk factors. Receiver operating characteristic analysis showed that combining LTH, MMBA, and TT-TG distance had excellent predictive ability for adult RPD, with an area under the curve (AUC) of 0.888, sensitivity of 82%, and specificity of 88%, surpassing their diagnostic values (AUCs, 0.694-0.804).
Conclusion:
The decreased LTS, increased LTH, decreased MMBA, increased MTS−LTS, and increased MTS: LTS ratio were associated with adult RPD. Importantly, even after controlling for TT-TG distance and TFA, increased LTH and decreased MMBA persisted as independent risk factors for adult RPD.
Patellar dislocation, a frequent knee injury and disabling condition in young populations, has an annual incidence of 7 to 77 per 100,000 people, with a recurrence rate 8 reaching 86.5%. Recurrent patellar dislocation (RPD) has been historically linked to knee anatomical factors. ¶ The identification of risk factors for RPD is important for subsequent prevention of dislocation and for selecting appropriate treatments. Trochlear dysplasia, increased tibial tuberosity-trochlear groove (TT-TG) distance, patella alta, and patellar tilt are widely accepted classical risk factors,2,8,10,11,15,31,35 whereas tibiofemoral rotational malalignment is increasingly acknowledged as a critical risk factor and a focus of recent investigations.8,12,26,33,36
Owing to its proximity to the patella, the distal femur morphology frequently constitutes a focal point in the investigation of risk factors for RPD. In addition to trochlear dysplasia, a shorter posterolateral condyle, a prominent anterolateral condyle, and an abnormal lateral femoral condyle index, which potentially impact knee rotation, have also been reported.8,15,38,42 Considering the lower limb biomechanics and inherent articulation of the femur upon the tibial plateau, tibiofemoral rotation is also intrinsically linked to the tibial plateau and the meniscus morphologies. However, this specific relationship remains underreported and insufficiently understood in RPD.
Asymmetry of the tibial plateau could potentially induce alterations in tibiofemoral rotational alignment, thereby predisposing the knee to a spectrum of ligament and meniscal injuries.9,13,19,25,34,39 Furthermore, a decreased posterior tibial slope has been observed in patients with RPD, which may influence stress distribution in the patellofemoral joint.1,22,32 In patients with trochlear dysplasia, a flatter posterior tibial slope of the lateral tibial plateau has been observed. 6 Additionally, recent studies have suggested that abnormal medial tibial depth (MTD) and lateral tibial height (LTH) may contribute to knee rotational malalignment, thereby predisposing to an elevated incidence of knee injuries.4,17,19 It is hypothesized that an increased LTH and a decreased MTD may promote excessive tibial internal rotation, thereby increasing the risk of RPD.8,12,26,33,36 However, the relationship between these rotational alignment parameters and RPD remains insufficiently explored.
In addition to osseous factors, meniscal posterior horns may also represent critical stabilizers of knee rotational stability. Research has shown that knee rotational malalignment (femoral external rotation relative to the tibia) is associated with an increased risk of anterior cruciate ligament (ACL) injury, with the posterior horn of the lateral meniscus acting as a buffer to limit the posterior translation of the lateral femoral condyle.13,18,27,29,34 Conversely, rotational malalignment (femoral internal rotation relative to the tibia) is a risk factor for RPD.8,12,26,33,36 Therefore, it can be speculated that the posterior horn of the medial meniscus similarly contributes to rotational stability, with a decreased medial meniscal bone angle (MMBA) potentially representing a risk factor for RPD. A decreased MMBA combined with an increased LTH could theoretically act synergistically by increasing the potential energy for anterior translation of the lateral femoral condyle and decreasing resistance to posterior translation of the medial femoral condyle, thereby facilitating excessive tibial internal rotation and ultimately elevating the risk of RPD.
The tibiofemoral angle (TFA) is a classic and straightforward metric for assessing rotational malalignment.8,12,26,28,36 Additionally, the TT-TG distance is a crucial metric in the assessment and treatment of RPD, with knee rotation being a significant component. 37 Therefore, the purpose of this study was to investigate the correlation between these anatomical parameters and adult RPD and to determine which factors are independently associated with this condition. When the results permitted, we further evaluated the diagnostic value of individual and combined independent risk factors. We hypothesized that these targeted anatomical parameters would remain independently associated with adult RPD after controlling for established risk factors (TT-TG distance and TFA), thereby suggesting a previously unrecognized mechanism of rotational instability, and that combining them with established factors would provide greater predictive value than established factors alone.
Methods
Study Population
This case-control study was conducted at our hospital and was approved by the institutional ethics committee (IRB no. KY2025052). Owing to the retrospective design and the use of anonymized data, informed consent was waived. We reviewed the medical records of patients who visited our hospital between September 2018 and January 2025. The patients meeting the inclusion and exclusion criteria were categorized into 2 groups: the RPD group and the control group. The inclusion criteria for the RPD group were (1) age >17 years and (2) ≥2 clinically documented complete lateral patellar dislocations. Complete dislocation was defined according to the criteria of Sheehan et al. 31 The exclusion criteria for the RPD group were as follows: (1) lack of magnetic resonance imaging (MRI) images or inadequate image quality (causing inability to perform measurements); (2) previous knee surgery or trauma (excluding previous episodes of patellar instability); (3) open physes; (4) multiligamentous injury; (5) medial meniscal lesion; and (6) any diseases known to obviously affect the native lower limb structures, including but not limited to Osgood-Schatter disease, congenital genu recurvatum, previous infection altering bone integrity, Ehlers-Danlos syndrome, osteoarthritis Outerbridge >Grade 2, and benign or malignant bone tumors. If both knees of the same patient met the inclusion and exclusion criteria, the knee MRI images that had most recently undergone a lateral patellar recurrent dislocation were selected for subsequent analysis. The inclusion criteria for the control group were (1) aged >17 years and (2) knee MRI scans confirmed as having no obvious evidence of injury or disease. The exclusion criteria for the control group were (1) inadequate image quality; (2) previous knee surgery or trauma; (3) open physes; and (4) the same as the 6th exclusion criterion of the RPD group (Figure 1).

Study flowchart and patient exclusion details. BMI, body mass index; MRI, magnetic resonance imaging; RPT, recurrent patellar dislocation.
Owing to the sufficiently large control pool relative to the cases, a 1-to-1 nearest-neighbor matching method was employed for individual matching without replacement. The matching criteria included sex consistency, age consistency, and a body mass index (BMI) within ±2 kg/m2. If, under the conditions of sex and age consistency, the matched participant did not meet the BMI criterion, the age criterion was relaxed to a ±2-year window. When multiple control participants met the BMI criteria, the one with the closest BMI to the patient's was selected. If both knees of a control participant met the above matching criteria, one knee would be randomly selected for the subsequent study procedure. Each control participant was used only once for matching and then discarded from the control pool.
Imaging Evaluation
For patients who met the above criteria and had numerous MRI scans, the most recent MRI image was used for analysis. If the patient had undergone surgery, the last preoperative MRI image was selected for analysis. The MRI scans were acquired on both 1.5 T and 3 T scanners using a dedicated 15-channel knee coil, with the knee joint in approximately neutral extension position (0° flexion). All MRI scans were acquired in the radiology department of our institution. All measurements were conducted on a computer workstation connected to our institution's Picture Archiving and Communication System (PACS). Two specialist orthopaedists (Zheng L. and L.L.), blinded to the patients’ information, independently recorded all data. They had >5 years of specialized diagnostic and MRI interpretation experience and had received professional training, ensuring proficiency in these measurement techniques. Twenty MRI scans, randomly selected (10 from the RPD group and 10 from the control group), were remeasured by the 2 observers (Zheng L. and L.L.) after a 4-week interval to assess reproducibility. The mean measurements from both observers were used for the final analysis.
MRI Measurements
Lateral Tibial Slope (LTS) and Medial Tibial Slope (MTS). The method outlined by Hudek et al 20 was employed with slight modifications. Using a split-screen, sagittal and axial images were displayed. On the axial images of the most proximal tibia (Figure 2A), the corresponding sagittal images of the widest portions of the whole, medial, and lateral tibial plateaus (Figure 2, B–D) were selected. A central sagittal image of the tibial plateau (Figure 2B) was identified, in which the intercondylar eminence and the tibial attachment of the posterior cruciate ligament were depicted, with the anterior and posterior cortices presenting a concave shape. Two circles were plotted on the proximal tibia in this image. The proximal circle touched the anterior, posterior, and cranial cortices, whereas the distal circle touched the anterior and posterior cortices and was centered on the proximal circle's circumference. For indistinct cortex-medullary canal demarcation, the midpoint of the transition area between a definitive black cortex and a light gray medullary canal was used. A line through the centers of these circles defined the tibial proximal anatomic axis (TPAA). On the sagittal MRI slices corresponding to the previously identified widest portions of the medial and lateral tibial plateaus, tangents were drawn from the uppermost points to the last points of the medial and lateral tibial plateaus. MTS and LTS were measured as the angles between the vertical lines reproducing the TPAA and the aforementioned tangents (Figure 2, C and D).

Measurement examples of anatomic parameters. (A) The axial image of the most proximal tibia displayed 3 lines indicating the sagittal imaging planes corresponding to the whole, lateral, and medial tibial plateaus. (B) Central sagittal image of the tibial plateau, in which a line through the center of the 2 circles was defined as the tibial proximal anatomic axis. (C) Medial tibial slope. (D) Lateral tibial slope. (E) Medial meniscal bone angle and medial tibial depth. (F) Lateral tibial height.
Lateral Tibial Height. In the same slice where the LTS was measured, the LTH was measured as the distance between the most distal point of the lateral femoral condyle cartilage and the tangent lines of the lateral tibial plateaus. 17
Medial Tibial Depth. In the same slice where the MTS was measured, the MTD was measured as the perpendicular distance from a line connecting the anterior and posterior rims of the medial tibial plateau to the deepest point of the plateau (Figure 2E). 16
Medial Meniscal Bone Angle. In the same slice where the MTS was measured, the MMBA was measured as the angle between the tangent to the superior meniscal surface and the tangent to the subchondral bone of the tibial plateau (Figure 2E).18,40
TT-TG Distance. The axial MRI image in which the trochlear groove was deepest and fully defined. The first line was drawn through the deepest point of the trochlear groove and perpendicular to the line connecting the posterior femoral condyles and was translated to the same slice as the second line (Figure 3A). The second line was drawn parallel to the trochlear line through the midpoint of the patellar tendon on the slice where the patellar tendon was fully in contact with the tibial tubercle. The distance between these 2 lines is the TT-TG distance (Figure 3B).5,28

Measurement examples of anatomic parameters. (A) The first line was drawn through the deepest point of the trochlear groove and perpendicular to the line connecting the posterior femoral condyles. (B) The second line was drawn parallel to the trochlear line through the midpoint of the patellar tendon. The distance between these 2 lines is the tibial tubercle-trochlear groove distance. (C) The posterior femoral condylar line at the slice of the widest anterior-posterior diameter of the condyles is drawn. (D) The posterior tibial condylar line was drawn at the level of the posterior cruciate ligament insertion. The angle between these lines was defined as the tibiofemoral angle.
Tibiofemoral Angle. The posterior femoral condylar line was drawn at the level of the widest anteroposterior diameter of the femoral condyles (Figure 3C). The posterior tibial condylar line was drawn at the level of the posterior cruciate ligament insertion. The angle between these 2 lines was defined as the tibiofemoral angle (TFA) (Figure 3D). 26 The angle of tibial external rotation relative to the tibia is denoted as a positive value.
Statistical Analysis
A priori power analysis using G*Power (Version 3.1.9.7) was used to determine the required sample sizes (α = .05; power = 0.8). Given the unavailability of LTS data in patients with patellar instability, the sample size was calculated assuming a trochlear dysplasia-like distribution and a prespecified effect size (d = 0.631), yielding 41 participants per group. 6 For the MTS−LTS (slope difference) measurements, based on Geraghty et al 14 (d = 1.102), the minimum sample size was 18 per group. To detect a 2° MMBA difference, the required sample size was 49 per group (effect size d = 0.574), based 40 on a control difference of 26.6°± 3.5°. Post-hoc power analyses (n = 50; α = .05) revealed that the power for detecting between-group differences in the LTS, LTH, MMBA, MTS−LTS, MTS: LTS ratio, TT-TG distance, and TFA was 0.92, 0.98, 0.99, 0.90, 0.87, 0.99, and 0.99, respectively.
All statistical analyses were performed using SPSS software Version 27 (IBM), with a 2-tailed P < .05 considered statistically significant. Categorical variables are presented as frequencies (%), and continuous variables are presented as the mean ± standard deviation. Intra- and interobserver reliability were assessed using intraclass correlation coefficients (ICCs). Data normality was assessed using the Kolmogorov-Smirnov test. Based on the results of normality testing, between-group comparisons of continuous variables were performed using either the parametric Student t test or the nonparametric Mann-Whitney U test. Categorical variables were compared using chi-square tests. Forward stepwise binary logistic regression models were constructed to identify significant predictors of RPD. To evaluate the diagnostic accuracy of the significant and combined variables identified in the regression analysis, receiver operating characteristic (ROC) curves were generated using GraphPad Prism (GraphPad Software, Version 9.5.0).
Results
A total of 50 patients with RPDs and 50 age-, sex-, and BMI-matched controls were included in the final analysis. The minimum ICCs for intra- and interobserver reliability were 0.861 and 0.850, respectively, indicating excellent agreement. These values met the criteria for excellent reliability, as defined by ICC values ≥0.75 (Table 1). Demographic characteristics did not significantly differ between the 2 groups (P > .05) (Table 2).
Inter- and Intraobserver Reliability Among All Measurements a

Data are presented as ICC (95% CI). ICC, intraclass correlation coefficient; TT-TG, tibial tubercle-trochlear groove.
Baseline Demographic Characteristics a
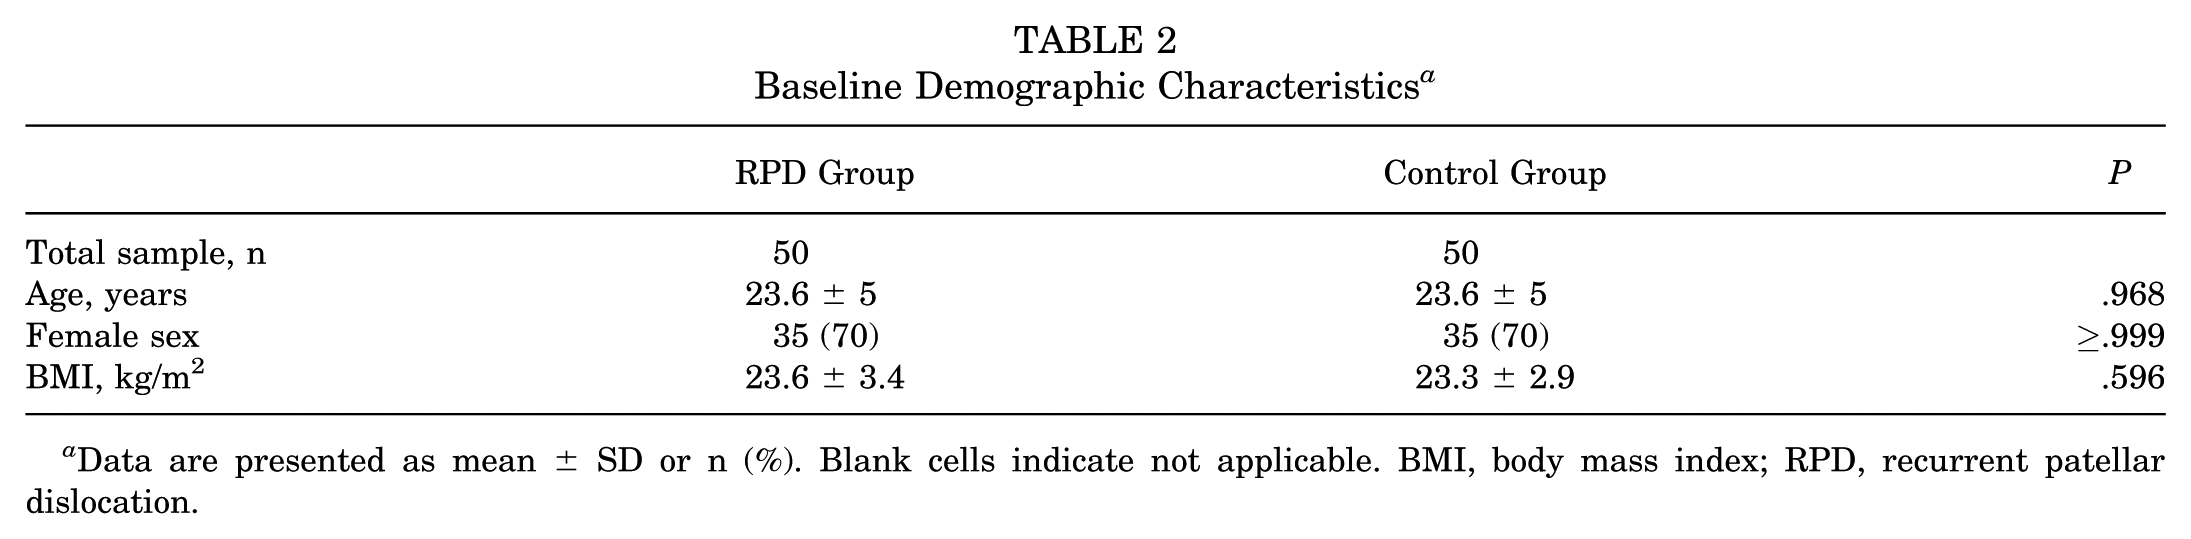
Data are presented as mean ± SD or n (%). Blank cells indicate not applicable. BMI, body mass index; RPD, recurrent patellar dislocation.
MRI measurements are summarized and displayed in Table 3 and Figure 4. Statistically significant differences were observed between the adult RPD and control groups in the LTS (3.8°± 2.9° vs 5.7°± 2.7°; P = .002), LTH (3.9 ± 0.8 mm vs 3.3 ± 0.7mm; P < .001), MMBA (24°± 2.8° vs 27.3°± 3°; P < .001), MTS−LTS (1.64°± 2.94° vs −0.51°± 3.58°; P = .001), MTS: LTS ratio (4 ± 6.3 vs 1.2 ± 1.1; P = .001), TT-TG distance (14.2 ± 4.2 mm vs 10 ± 3.4 mm; P < .001), and TFA (3.9°± 6.6° vs −2.1°± 6°; P < .001). Conversely, no statistically significant differences were observed between the adult RPD and control groups in the MTS (5.4°± 3° vs 5.1°± 2.9°; P = .656), MTD (2.1 ± 0.8 mm vs 2 ± 0.7 mm; P = .690), or MTS: MMBA ratio (0.23 ± 0.12 vs 0.19 ± 0.11; P = .084).
Between-Group Comparison Results Regarding Measurements Related to Knee Rotational Alignment a

Data are presented as mean ± SD. Bold P values indicate statistical significance (P < .05). LTS, lateral tibial slope; MMBA, medial meniscal bone angle; MTS, medial tibial slope; RPD, recurrent patellar dislocation; TT-TG, tibial tubercle-trochlear groove.

Box-and-whisker plots showed differences in measurements between the RPD and control groups. *P < .05. (A) Lateral tibial slope. (B) Medial tibial slope. (C) Lateral tibial height. (D) Medial tibial depth. (E) Medial meniscal bone angle. (F) MTS−LTS. (G) MTS: LTS ratio. (H) MTS: MMBA ratio. (I) Tibiofemoral angle. (J) Tibial tubercle–trochlear groove distance. LTH, lateral tibial height; LTS, lateral tibial slope; MMBA, medial meniscal bone angle; MTD, medial tibial depth; MTS, medial tibial slope; MTS−LTS, difference between medial and lateral tibial slopes; RPD, recurrent patellar dislocation; TFA, tibiofemoral angle; and TT-TG, tibial tubercle-trochlear groove distance.
Multivariable stepwise logistic regression analysis, incorporating the aforementioned statistically significant variables, identified the LTH (odds ratio [OR], 2.442 [95% CI, 1.197-4.982]; P = .014), MMBA (OR, 0.687 [95% CI, 0.562-0.840]; P < .001), and TT-TG distance (OR, 1.330 [95% CI, 1.128-1.569]; P ≤ .001) as independent predictors of adult RPD (Table 4). Multicollinearity was assessed using variance inflation factors (VIFs). The VIF values for all 3 variables were <1.2, confirming no significant multicollinearity among the included variables.
Results of Multivariate Logistic Regression a

Bold P values indicate statistical significance (P < .05). OR, odds ratio; TT-TG, tibial tubercle-trochlear groove.
The ROC analysis identified the following: an optimal LTH cutoff of >3.45 mm, yielding a sensitivity of 62%, a specificity of 68%, and an area under curve (AUC) of 0.694; an MMBA cutoff value of <24.45°, with a sensitivity of 86%, a specificity of 60%, and an AUC of 0.794; and an optimal TT-TG distance cutoff of >11 mm, exhibiting a sensitivity of 68%, a specificity of 84%, and an AUC of 0.804. When 3 independent factors were combined, the AUC reached 0.888, with 82% sensitivity and 88% specificity for predicting adult RPD (Table 5 and Figure 5).
Diagnostic Performance of 3 Significant Variables in Multivariable Regression Analysis and Their Combined Predictability a

The blank cell indicates not applicable. AUC, area under curve; LTH, lateral tibial height; MMBA, medial meniscal bone angle; TT-TG, tibial tubercle-trochlear groove.
LTH + MMBA + TT-TG distance.

ROC curves for significant predictor variables, including (A) LTH, (B) MMBA, (C) TT-TG distance, and (D) a combination of the LTH, MMBA, and TT-TG distance. AUC, area under the curve; LTH, lateral tibial height; MMBA, medial meniscal bone angle; ROC, receiver operating characteristic; TT-TG, tibial tubercle-trochlear groove.
Discussion
The principal finding of this study was the persistent association of increased LTH and decreased MMBA with adult RPD, even after accounting for established rotation-related risk factors such as the TT-TG distance and TFA. Furthermore, combining LTH and MMBA enhanced the predictive ability of the TT-TG distance, potentially suggesting previously underappreciated dynamic rotational instability of the knee in the adult RPD.
Excessive tibiofemoral rotation (internal rotation of the femur relative to the tibial plateau and distinct from inherent femoral or tibial torsion) has been widely reported among patients with patellar instability and has emerged as a notable risk factor.7,8,12,26,33,36 Moreover, this malalignment has also been identified as a risk factor for graft failure after primary medial patellofemoral ligament reconstruction in patients with RPDs.24,41 Therefore, further investigation of the relationship between factors related to tibiofemoral rotation and PRD is required.
Tibial slope and tibial plateau asymmetry have been the focus of research regarding morphological risk factors for knee injuries. Abnormal tibial slope alters knee joint biomechanics by influencing anterior-posterior tibial translation relative to the femur. In contrast, tibial plateau asymmetry can alter tibiofemoral rotation, both of which can contribute to injuries to the knee ligaments and meniscus.9,13,19,22,25,32,34,39 Dai et al 6 and Balcarek et al 3 reported that patients with trochlear dysplasia had flatter LTS than controls. Although the vast majority of patients with RPDs also have trochlear dysplasia, strictly speaking, this relationship is not directly interchangeable. Furthermore, the aforementioned studies lacked statistical power analyses and did not employ current MRI-based methods to measure tibial slope, thereby limiting the generalizability of their results.
Previous studies have shown that in patients with ACL injuries, increased LTS and increased slope difference (LTS−MTS) are often observed, leading to external rotation of the femur relative to the tibia, and increasing stress on the ACL, making it prone to injury. 9,13,34,39 Conversely, in our patients with RPDs, we observed a flatter LTS and an increased MTS−LTS difference, leading to internal rotation of the femur relative to the tibia. This thereby places the patella in a state prone to dislocation, which is consistent with dislocation episodes involving internal torsion of the femur during knee flexion. 30
Geraghty et al 14 reported increased platform asymmetry in patients with patellar instability but did not further analyze its contribution to rotational instability. In this study, after rotation-related variables were included in the multivariate analysis, LTS and tibial plateau asymmetry were no longer significant, whereas the TT-TG distance remained significant. This finding might suggest that tibiofemoral rotation caused by tibial plateau asymmetry appears less predictive for adult RPD than the TT-TG distance. This is likely because the TT-TG distance encompasses not only the TFA but also tibial tubercle lateralization, which has more injury-related implications. 37 Therefore, although tibial plateau asymmetry has not been widely recognized previously, its effects may have already been taken into account during TT-TG distance assessment. It might contribute to excessive tibiofemoral rotation, but it is difficult to alter it through surgery. However, considering that the femur rests upon the tibial plateau and the lower limb mechanics, this is likely the true driving factor for tibiofemoral rotation rather than femoral anteversion.
Notably, increased LTH was identified as an independent predictor for adult RPD. Increased LTH may contribute in 2 ways: first, it further decreases the LTS; second, it involves a dynamic rotational instability that causes the lateral femoral condyle to slide anteriorly during dislocation episodes, thereby generating relatively greater internal femoral rotation. This mechanism has the opposite effect on knees with ACL injuries, promoting posterior sliding of the lateral condyle and generating external femoral rotation, which contributes to high-grade pivot shift and ACL injury.17,23 Even after considering established rotational factors, the first contribution of increased LTH (reducing LTS) might be encompassed. However, the associated knee rotational mechanism likely occurs during the dynamic injury process and may not be fully captured by static observational metrics such as the TT-TG distance and TFA. Therefore, LTH remains an independent risk factor. Its height can be altered via chondroplasty. However, whether this method can truly restore patellar stability is unknown and requires further research.
A decreased MMBA was also found to be a significant independent risk factor, with its ability to predict adult RPD achieving 86% sensitivity and 60% specificity at a cutoff value of <24.45°. Significantly lower lateral meniscal bone angle (LMBA) observed in knees with ACL injury may contribute to increased external tibiofemoral rotation and attenuate the braking effect of the lateral meniscus posterior horn on posterior translation of the lateral femoral condyle, thereby increasing stress on the ACL and potentially rendering it more susceptible to injury. 13,18,27,29,34 This is the first study to investigate MMBA in patients with RPD. The mechanism by which a decreased MMBA promotes RPD might be the opposite of the mechanism by which a decreased LMBA promotes ACL injury13,18,27,29,34: one mechanism might be that in a static knee, a decreased MMBA allows the posteromedial condyle to slide relatively posteriorly, generating greater internal tibiofemoral rotation. Furthermore, a dynamic injury mechanism may also be involved: when the femoral medial condyle slides posteriorly over the tibial plateau, a decreased MMBA might diminish the deceleration effect normally provided by the posterior horn of the medial meniscus, thereby weakening rotational constraint and potentially contributing to RPD. Therefore, after static rotational indicators (TT-TG distance and TFA) were considered, the MMBA retains its significance, similar to LTH. A study has reported that tibiofemoral internal rotation becomes more pronounced with longer injury duration. 28 This may be because ongoing, unhealed damage to the posteromedial knee soft tissues (eg, the medial meniscus) leads to tissue stretching and, consequently, a further decline in stability. Since the MTS: MMBA ratio is mainly driven by MMBA, it has lost its significance. This is indeed different from the LTS: LMBA ratio in ACL injuries, as that value is driven by 2 significant factors.13,29,34
The combination of LTH and MMBA improves the predictive ability of the TT-TG distance, achieving 82% sensitivity and 88% specificity. This finding is consistent with the role that rotational instability plays in the injury mechanism of adult RPD and also demonstrates the potential for dynamic rotational instability in adult RPD.
This study has several limitations. First, this study has the limitations inherent to retrospective studies. Second, although the statistical power was appropriate, the study's sample size was relatively small, especially among men. Although we matched cases and controls by sex, age, and BMI to control for confounding, large-scale, multicenter studies are needed in the future. Third, although we restricted participants’ age to >17 years at the time of RPD, some patients had their MRI performed later, making it unclear if they were skeletally mature when the dislocation occurred. Fourth, despite standardized training and adherence to hospital protocols by MRI technicians, the use of different MRI machines might have affected measurement precision. Fifth, although MRI requires the knee in neutral extension, joint position was assessed visually by experienced technologists rather than measured objectively with a goniometer. Moreover, some acutely injured patients may maintain slight knee flexion due to pain. This can lead to external rotation of the femur relative to the tibia. 21 However, this situation would strengthen the interpretation of the results. Additionally, certain bony anatomical parameters are more suitably evaluated with CT or weightbearing radiograph, as MRI may not allow precise measurement of bone structures. Relying solely on proximal tibial MRI images may not permit accurate calculation of the TPAA. Finally, static imaging cannot capture dynamic kinematics or soft-tissue laxity that contribute to instability. Therefore, more rigorous studies are still needed to evaluate the injury mechanisms underlying dynamic instability.
Conclusion
Decreased LTS, increased LTH, decreased MMBA, increased MTS−LTS, and increased MTS: LTS ratio were associated with adult RPD. After adjusting for TT-TG distance and TFA, increased LTH and decreased MMBA remained independent risk factors, implicating potential dynamic knee rotational instability in the condition. Individually, the TT-TG distance, LTH, and MMBA demonstrated good diagnostic accuracy, and this accuracy was further improved when they were combined. These findings could deepen the understanding of how knee rotational instability affects adult RPD and help refine prevention and treatment approaches.
Footnotes
Final revision submitted January 12, 2026; accepted January 17, 2026.
The authors have declared that there are no conflicts of interest in the authorship and publication of this contribution. AOSSM checks author disclosures against the Open Payments Database (OPD). AOSSM has not conducted an independent investigation on the OPD and disclaims any liability or responsibility relating thereto.
Ethical approval for this study was obtained from the Institutional Ethics Committee (IRB no. KY2025052). Owing to the retrospective design and the use of anonymized data, informed consent was waived.
Author Contributions
Zhong Li and Lingzhi Li designed the study. Lingzhi Li, Zheng Li, and Yibo Li collected data and drafted the original manuscript. Zihan Lin and Juncai Liu performed the statistical analyses and wrote this part of the manuscript and the results section. Xu Liu, Yanshi Liu, and Hao Jiang revised and edited the manuscript. Zhong Li provided guidance and supervision during the study. All authors read and approved the final manuscript.