
Abstract
Background:
Return to play (RTP) and return to performance (RTPf) after labral repair in Major League Baseball (MLB) athletes remain poorly defined. Modern advanced analytics allow for a more comprehensive evaluation of postoperative performance.
Purpose:
To evaluate RTP and RTPf using advanced analytic and ball-tracking metrics in MLB pitchers and position players after primary shoulder labral repair.
Study Design:
Cohort study; Level of evidence, 3.
Methods:
A total of 67 MLB players (39 pitchers, 28 position players) who underwent labral repair between March 1, 2017, and December 1, 2024, were compared with 78 matched control pitchers and 56 matched control position players. RTP rates and timing were recorded for all players. RTPf analysis was performed for athletes with at least 2 seasons of complete pre- and postoperative advanced analytic data, resulting in 17 pitchers and 21 position players included as cases for RTPf analysis. Various traditional, advanced analytic, and ball-tracking metrics were analyzed for the first 2 seasons after return from injury and compared with the season prior to injury. For pitchers, these metrics included advanced analytics measuring the physical quality of pitches, command of the strike zone, and overall pitching ability. Unpaired and paired t tests compared pre- and postoperative performance, along with matched controls.
Results:
Overall, 64.2% of all players returned to MLB play, with RTP rates for pitchers significantly lower (43.6% vs 92.9%; P < .05) and longer (493 vs 285 days; P < .05) than for position players. There were no significant differences in any offensive or defensive metric for position players pre- versus postoperatively. For pitchers, there were no significant differences in velocity, spin, movement, arm angle, approach angle, release point, or extension. Postoperatively, pitchers demonstrated significantly decreased workload (eg, innings pitched) and overall value (FanGraphs wins above replacement) for the first season back, returning to <50% of their preinjury baseline. Furthermore, pitchers showed significantly decreased physical quality of pitches, command of the strike zone, and overall pitching ability after shoulder labral repair (P < .05) during the first season back but not during the second.
Conclusion:
The prognosis after shoulder labral repair is highly dependent on player role in MLB. Position players generally returned to MLB (92.9%) and recovered baseline performance. In contrast, pitchers faced a guarded prognosis, with only 43.6% returning to MLB and requiring a significantly longer recovery period. For those pitchers who did return, traditional metrics such as velocity and movement were unchanged; however, advanced analytics showed a decline in pitch quality and command as well as reduced workloads and value.
The incidence of shoulder labral injuries among Major League Baseball (MLB) players has become increasingly concerning, accounting for the highest proportion of injuries anatomically. 11 These injuries can significantly affect career longevity and performance. In MLB pitchers, arthroscopic labral repair has been associated with return-to-play (RTP) rates of approximately 60% to 65%, with mean RTP timelines often exceeding 10 months and only a subset of athletes returning to their full preinjury performance levels. 34
Comparative analyses demonstrate that position players often recover more reliably.3,4,14 In a cohort undergoing arthroscopic shoulder surgery, 77.8% of position players returned to MLB, as compared with 60.7% of pitchers, with a significantly shorter RTP timeline (302 vs 470 days). 3 Pitchers also experienced a notable decline in wins above replacement (WAR) during their first postinjury season. 3 Broader systematic reviews of elite baseball pitchers after shoulder surgery, including labral repair, show an overall RTP around 68%, with about 22% never returning to MLB and performance generally improving but not fully normalizing over time.16,19,30 Across overhead athletes more broadly, RTP rates after superior labral repair remain highly variable and consistently lower than in nonoverhead populations.15,31,32
To date, most research on labral injuries in MLB players has focused on RTP, workload, and more traditional baseball performance metrics. 3 Traditional measures, such as earned run average (ERA) for pitchers or batting average for hitters, fail to account for nuances throughout the game and thus can cloud the evaluation of a player's true performance. The rapid evolution of advanced analytics and player-tracking technology in MLB has transformed the way that teams evaluate performance, make roster decisions, and drive player development. Since the public introduction of Statcast in 2015, every MLB stadium has been equipped with high-resolution camera and radar systems capable of capturing detailed biomechanical and ball-tracking data for every pitch, swing, and defensive play. 18 For pitchers, this includes precise measurements of pitch velocity, spin, arm angle, and movement, as well as advanced composite metrics such as Stuff+, Location+, and Pitching+, which provide a holistic assessment of the physical quality of pitches, command of the strike zone, and overall pitching ability, respectively.18,20-22 For position players, offensive metrics such as weighted runs created plus (wRC+), expected weighted on-base average, exit velocity, and launch angle, with defensive measures such as outs above average (OAA) and defensive runs saved, allow for a more objective and comprehensive evaluation of a player's overall contribution to team success.8,9,18,25,27,33
Despite these new advanced metrics more accurately assessing player performance, they have been minimally studied after shoulder labral repair. Therefore, the primary objective of this study is to assess RTP and return to performance (RTPf) after labral repair in MLB pitchers and position players by using modern advanced analytic and Statcast metrics. Our secondary objective was to find any preoperative predictors of returning to performance. We hypothesized that pitchers would demonstrate lower rates of RTP, a longer time to return, and a lower likelihood of regaining preinjury performance metrics as compared with position players. Given the scope of variables analyzed, this study was intended as an exploratory assessment to identify performance trends after labral repair.
Methods
Study Design
This study was deemed exempt as not human subjects research under 45 CFR 46.102 by the institutional review board at the Columbia University Medical Center. We conducted a retrospective analysis using publicly available data to identify all MLB players—pitchers and position players—who underwent primary labral repair between March 1, 2017, and December 1, 2024. Surgical cases were identified by using publicly accessible injury databases and cross-referenced with official media reports to confirm accuracy.
Data Collection
A list of labral and capsular injuries in MLB players between March 1, 2017, and December 1, 2024 (2017-2024 seasons) was compiled from the public MLB injury databases Spotrac 35 and Fangraphs, 10 which are compiled from available injury reports, team statements, and news articles. The search strategy for these databases involved first filtering all records containing the word “shoulder.” Each player identified with a shoulder injury was then cross-referenced through targeted Google (Google LLC) and ChatGPT (OpenAI) searches to verify the specific diagnosis and determine whether surgical repair was reported. Key search phrases included combinations of the player's name, year, and injury type (eg, “[player name] shoulder labral repair,”“[player name] shoulder surgery 2018”). In addition, structured searches in ChatGPT were conducted by prompts such as “Complete list of MLB players who had shoulder labral repair between 2017 and 2024” to ensure comprehensive case capture. This multisource search strategy was designed to identify all MLB players who underwent labral repair during the study period. Descriptive data including age, height/weight, body mass index, position, draft position, and years of experience were then collected from well-regarded public websites such as FanGraphs and Baseball Reference1,10 and then stored on a Microsoft Excel spreadsheet. Information regarding RTP, specifically the date of each player's first MLB game after surgery, was also collected from the public injury databases. This date was used to calculate the time to RTP in days and determine binary RTP success (yes/no) at 1, 2, and 3 years postoperatively and was then verified by confirming the player's recorded stats.
Performance data were obtained from Baseball Savant, FanGraphs, and publicly available Statcast leaderboards.2,6,9 For pitchers, data included workload metrics (innings pitched, total pitch count); traditional and advanced analytics such as FanGraphs WAR (fWAR), expected fielding independent pitching, and skill-interactive ERA. Pitch-tracking metrics included pitch velocity, spin rate, arm angle, active spin, spin axis, horizontal and vertical movement, release point, release extension, and vertical and horizontal approach angles; and advanced composite “plus” metrics included Stuff+, Location+, and Pitching+. For position players, data included workload metrics (plate appearances), fWAR, expected batting average, wRC+, win probability added plus, home runs, average and maximum exit velocity, barrel and hard-hit percentage, launch angle, throwing velocity, defensive runs saved, and OAA. wRC+, win probability added plus, and the remaining “plus” pitching metrics are scaled to league average (100), with each point above or below representing a percentage difference from average performance. Defensive runs saved and OAA are established advanced defensive metrics, with OAA calculated from Statcast tracking data. The definitions of a majority of these metrics have been described previously (Appendix Table 1).2,9,20-22
Inclusion Criteria
A total of 67 MLB players (39 pitchers, 28 position players) who underwent labral repair were identified for inclusion. For inclusion as cases, pitchers were required to have pitched at least 10 innings in MLB during the index season (year of surgery) or the season before injury, while position players were required to have at least 75 plate appearances, thresholds consistent with prior literature. 21 We assembled a 2:1 matched control cohort (78 pitchers, 56 position players) using methods consistent with prior case-control work in professional baseball.20-22 Controls were matched to cases by season, age, playing role (starter/reliever for pitchers; primary position for position players), handedness, and preinjury workload (pitch count for pitchers; plate appearances for position players). Eligible controls had no injury-list placement for shoulder or elbow conditions during the study window and no history of shoulder or elbow surgery. To ensure comparable exposure, controls were also required to meet minimum workload thresholds in the seasons analyzed (pitchers, ≥100 pitches per season; position players, ≥75 plate appearances per season). RTP rates were calculated for all 67 cases (39 pitchers, 28 position players). RTP was defined as appearing in at least 1 MLB game within 1, 2, or 3 years after the reported date of surgery, at the same level of competition as before injury. 21 Players who returned only to Minor League Baseball were not counted as successfully returning to the major league level for RTP analyses. RTPf analysis was conducted separately and required players to have a minimum of 2 qualifying postoperative seasons. This filtering resulted in 17 pitching cases and 21 position player cases in the RTPf analysis, with 34 and 42 matched controls, respectively.
Statistical Analysis
For all players, the index season was defined as the qualifying season of surgery, T1 as the last qualifying MLB season before surgery, and M1 and M2 as the first and second qualifying MLB seasons after surgery, respectively. The T1 season served as the preoperative baseline and was compared with postoperative seasons (M1 and M2) to assess recovery of performance. Continuous variables were compared by t tests and categorical variables by Fisher exact tests. Descriptive characteristics between cases and matched controls were evaluated to confirm comparability between groups. RTPf analyses were performed for the M1 and M2 seasons to determine the percentage of players who regained at least 95% of their T1 performance for each metric. For pitchers, return to velocity was defined as being within 1 mph of the T1 value and return to spin rate within 100 rpm. Return to full performance was defined for pitchers as returning to preoperative levels in fWAR, expected fielding independent pitching, velocity, fastball velocity, and spin rate and for position players as returning to preoperative fWAR, wRC+, and OAA. No correction for multiple comparisons was applied because analyses were exploratory. Statistical significance was set at P < .05, and analyses were performed in R statistical software and Microsoft Excel.
Results
A total of 67 MLB players (39 pitchers, 28 position players) underwent labral repair during the study period and were compared with 78 matched control pitchers and 56 matched control position players. Mean ± SD age was 28.4 ± 3.3 years for injured pitchers and 27.1 ± 3.3 years for injured position players. Pitchers were taller on average than position players (190.2 ± 6.3 cm vs 184.0 ± 4.8 cm) and more frequently injured the throwing arm (97.4% vs 50.0%). Among pitchers, 43.6% were starters and 56.4% were relievers; among position players, 35.7% were infielders, 46.4% outfielders, 14.3% catchers, and 3.6% designated hitters (Table 1).
Demographics of MLB Players Who Underwent a Labral Repair vs Matched Controls a

Values are reported as mean ± SD for continuous variables and percentage (No.) for categorical variables, unless stated otherwise. All between-group comparisons (case vs control) were not significant (P > .05). MLB, Major League Baseball; PA, plate appearances; T1, season prior to injury.
Significant differences between injured pitchers and position players.
Overall, 64.2% of all players returned to MLB play, with RTP rates significantly lower for pitchers than position players (43.6% vs 92.9%; P < .05). Mean time to RTP was 368 ± 184 days for all players but was significantly longer for pitchers (493 ± 186 days) than position players (285 ± 129 days; P < .05). Position players achieved higher RTP rates than pitchers at 9 months, 1 year, 1.5 years, and 2 years (Table 2; P < .05).
RTP Outcomes After Labral Repair in Major League Baseball Players From 2018 to 2025 a

Mean time to RTP was recorded only for those who successfully returned to play. Data are presented as percentage or mean ± SD. RTP, return to play since reported date of surgery.
Statistically significant between pitchers versus position players.
In pitchers, there were no significant differences in expected fielding independent pitching, skill-interactive ERA, fastball velocity, spin rate, active spin, spin axis, movement, approach angle, release point, or extension (Table 3). Other postoperative performance analyses revealed significant declines when compared with preoperative values. Innings pitched decreased from 95.74 ± 63.77 to 43.06 ± 37.61 in the first full postoperative season (P = .01) and remained reduced at M2 (45.11 ± 14.77; P = .05). WAR dropped from 1.39 ± 1.44 to 0.51 ± 0.58 at M1 (p=0.03), before slightly recovering at M2 (0.64 ± 0.56; P = .12). Advanced metrics worsened significantly, with Stuff+ declining from 108.87 ± 7.98 to 98.17 ± 7.16 (P < .01) and Pitching+ from 110.41 ± 8.00 to 98.54 ± 10.06 (P < .01) at M1, before again recovering at M2. Location+ showed a significant reduction at M2 (105.47 ± 5.18 to 101.15 ± 4.45; P = .03). Total pitches thrown decreased from 1590.14 ± 1041.60 to 728.50 ± 654.20 at M1 (P = .01) and remained reduced at M2 (721.00 ± 210.04; P = .04). Fastball usage percentage increased significantly from 33% ± 9% to 41% ± 8% at M1 (P < .01) but then normalized (Table 3).
Return-to-Performance Outcomes After Labral Repair in MLB Pitchers From 2018 to 2025 a
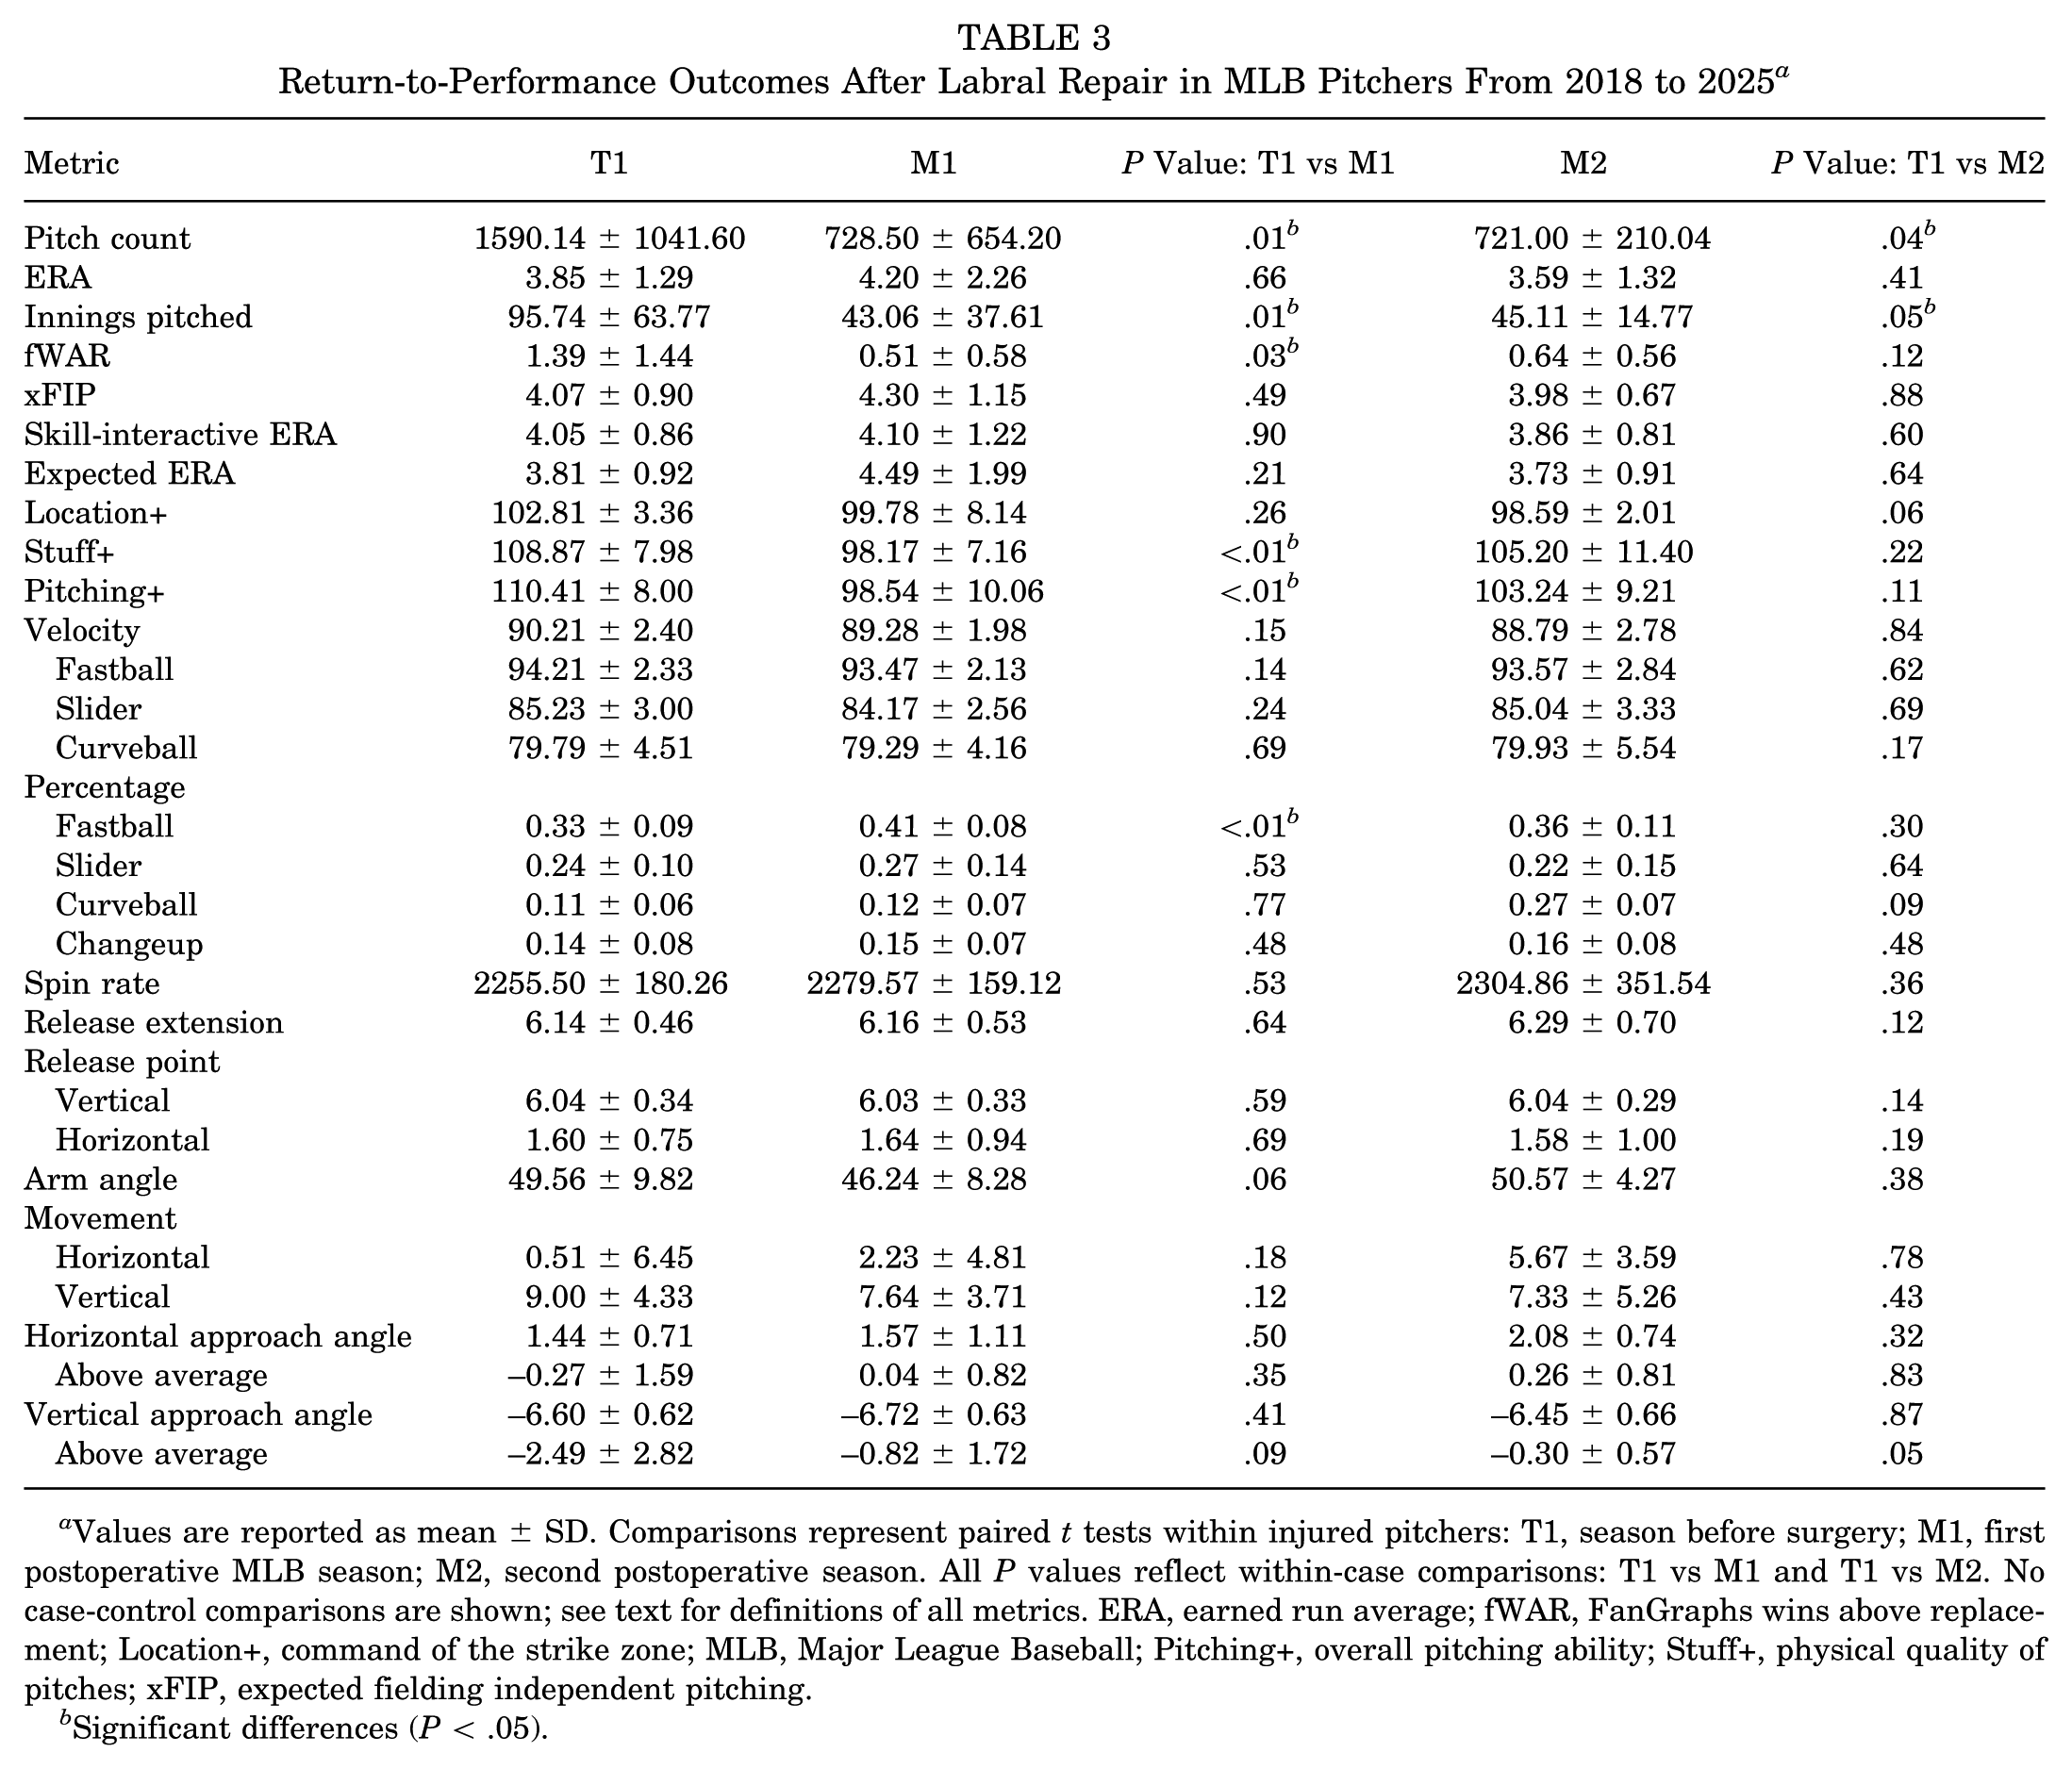
Values are reported as mean ± SD. Comparisons represent paired t tests within injured pitchers: T1, season before surgery; M1, first postoperative MLB season; M2, second postoperative season. All P values reflect within-case comparisons: T1 vs M1 and T1 vs M2. No case-control comparisons are shown; see text for definitions of all metrics. ERA, earned run average; fWAR, FanGraphs wins above replacement; Location+, command of the strike zone; MLB, Major League Baseball; Pitching+, overall pitching ability; Stuff+, physical quality of pitches; xFIP, expected fielding independent pitching.
Significant differences (P < .05).
These findings were compared with matched controls to determine if our findings could be secondary to random season-to-season variation (Table 4). Pitchers who underwent labral repair demonstrated significantly greater declines than matched controls in innings pitched (P = .01), pitch count (P = .01), WAR (P = .02), Location+ (P < .01), Pitching+ (P < .01), and fastball usage percentage (P = .04) from T1 to M1. No other metrics demonstrated significant differences between cases and controls at M1. From T1 to the second postoperative season (M2), the only statistically significant case-control difference was observed in Stuff+ (P = .03), which declined in cases but improved in controls. All other measured metrics showed no significant differences between groups at M2.
Return-to Performance Outcomes After Labral Repair in Major League Baseball Pitchers compared to Matched Uninjured Controls a
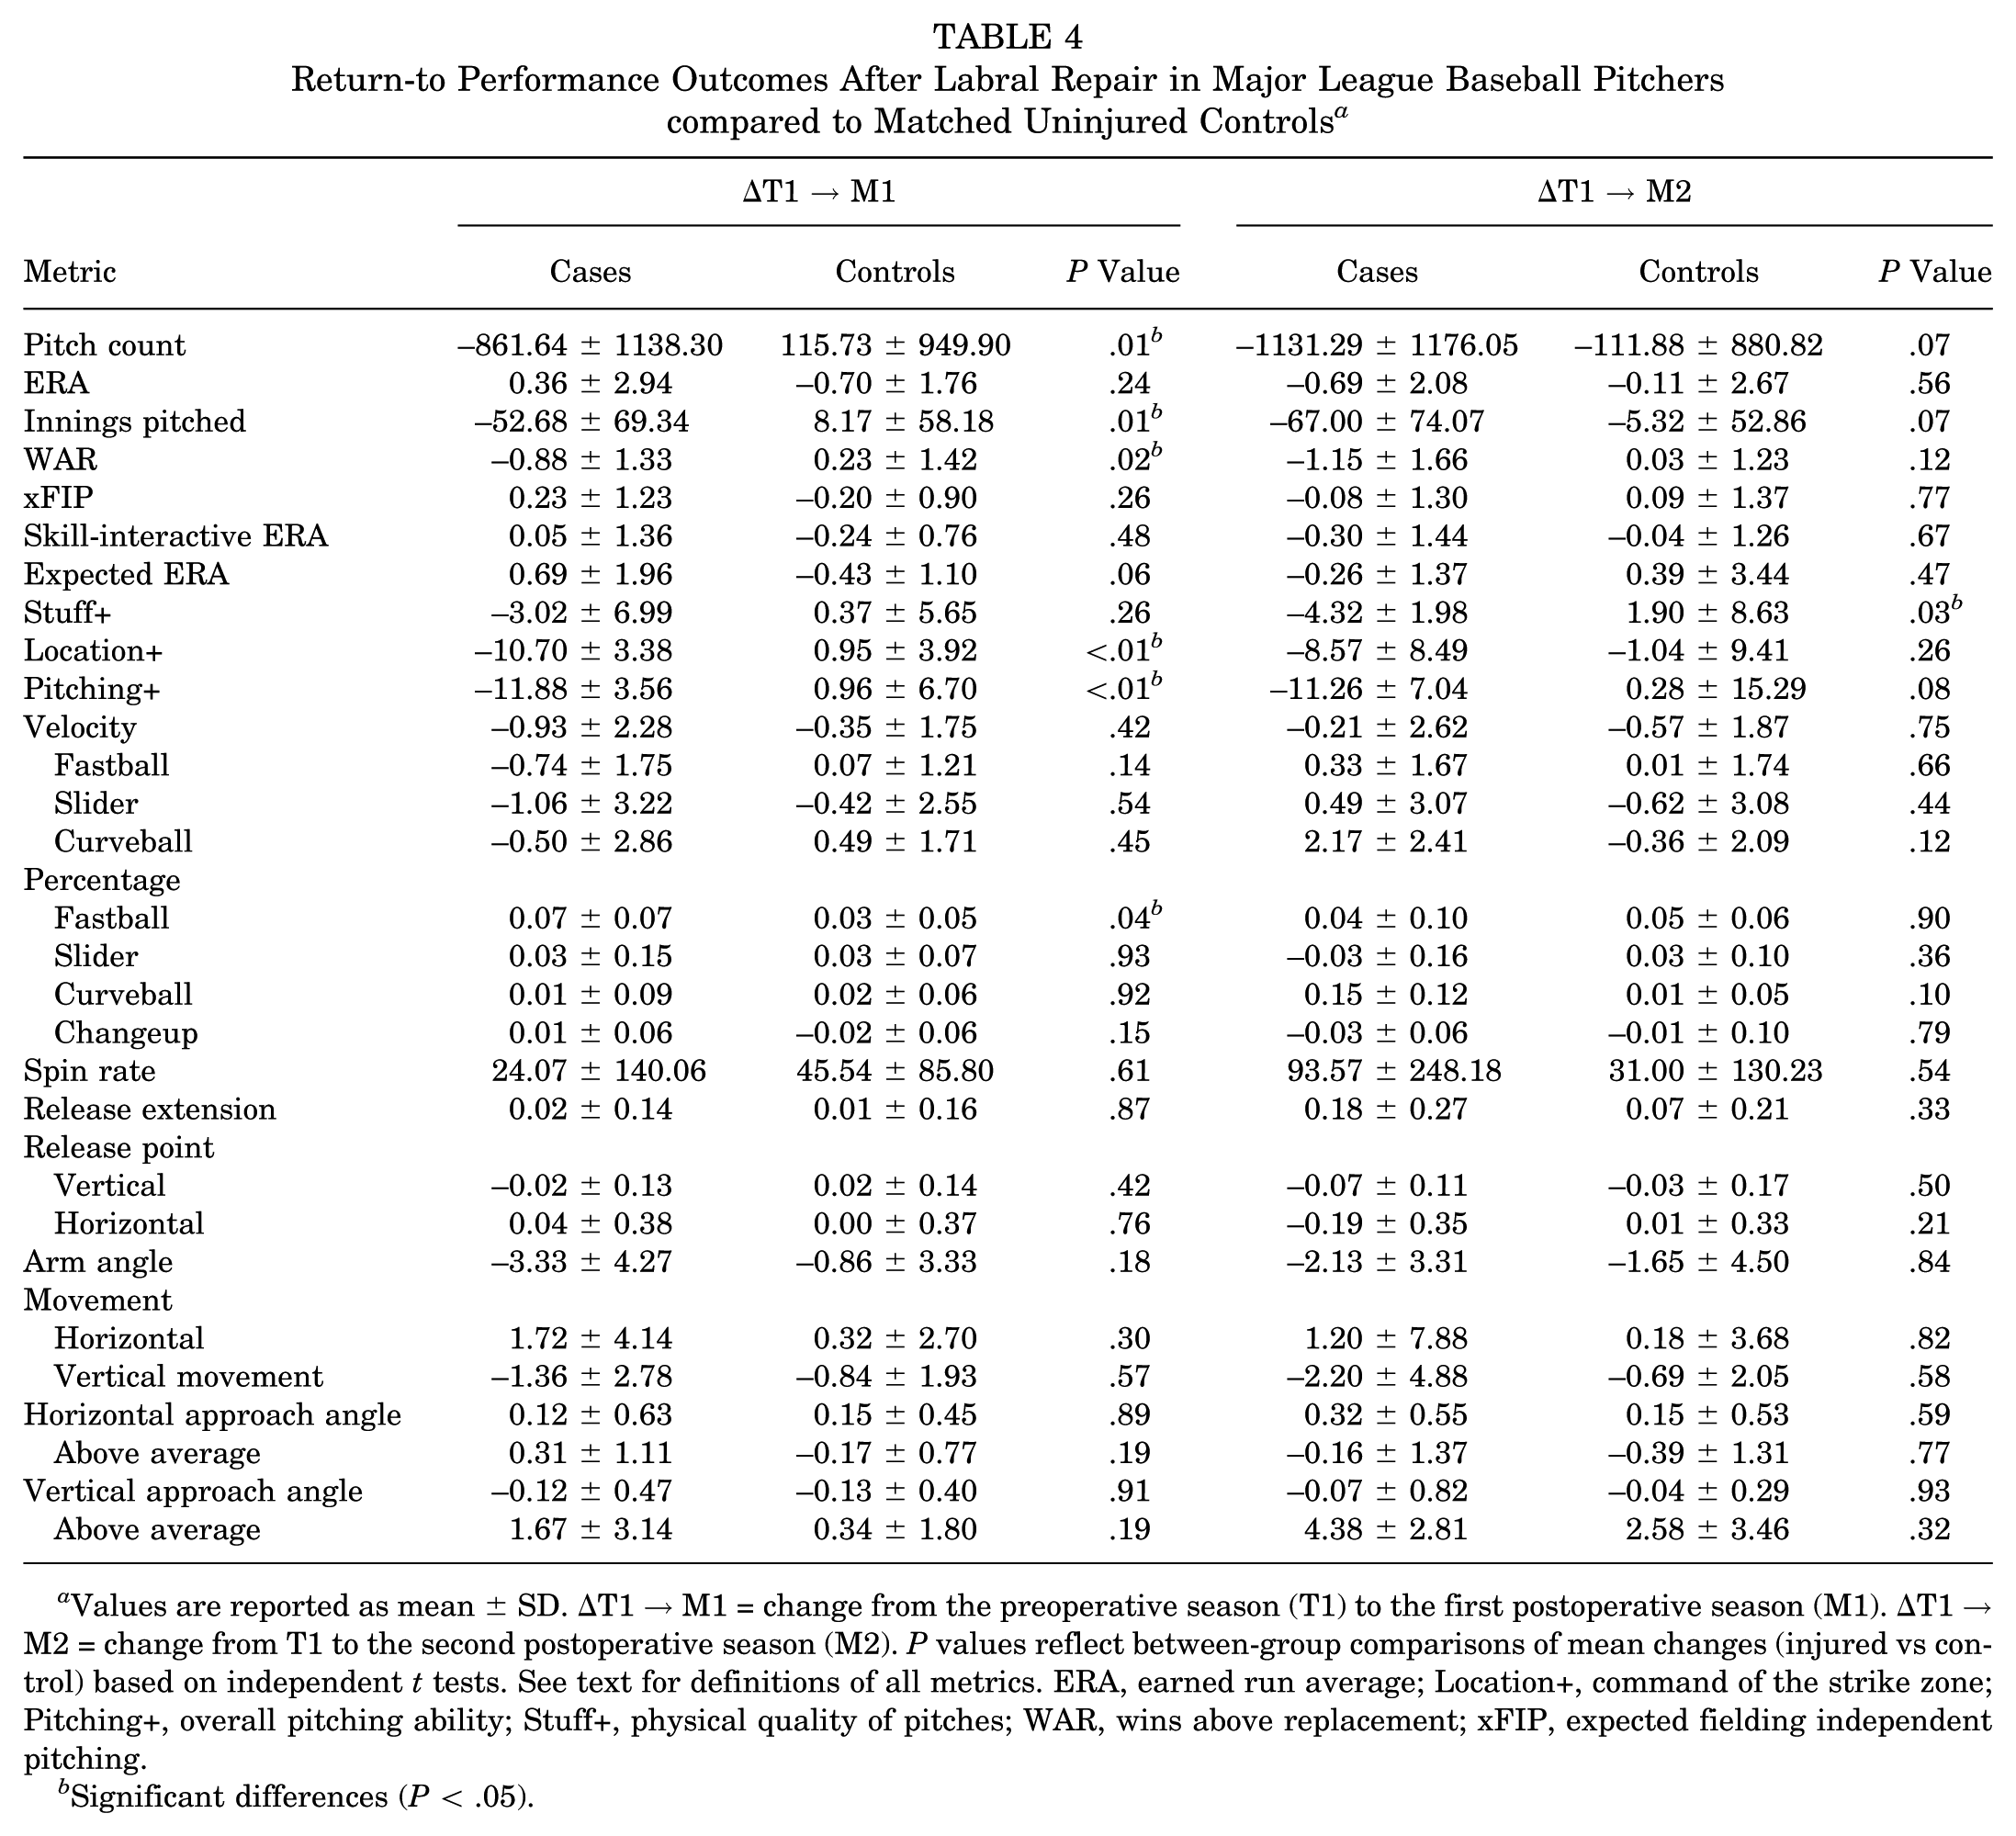
Values are reported as mean ± SD. ΔT1 → M1 = change from the preoperative season (T1) to the first postoperative season (M1). ΔT1 → M2 = change from T1 to the second postoperative season (M2). P values reflect between-group comparisons of mean changes (injured vs control) based on independent t tests. See text for definitions of all metrics. ERA, earned run average; Location+, command of the strike zone; Pitching+, overall pitching ability; Stuff+, physical quality of pitches; WAR, wins above replacement; xFIP, expected fielding independent pitching.
Significant differences (P < .05).
Position players fully returned to performance in all postoperative hitting and fielding metrics as compared with preoperative values (Table 5). There were no differences when compared with matched control position players as well.
Return-to-Performance Outcomes After Labral Repair in MLB Position Players a

Values are reported as mean ± SD. Comparisons represent paired t tests within injured pitchers: T1 = season before surgery, M1 = first postoperative MLB season, M2 = second postoperative season. All P values reflect within-case comparisons: T1 vs M1 and T1 vs M2. Statistical significance was set at P < .05. No case-control comparisons are shown; see text for definitions of all metrics. fWAR, FanGraphs wins above replacement; MLB, Major League Baseball; OPS, on-base plus slugging; WPA+, win probability added plus; wRC+, weighted runs created plus; xAVG, expected batting average.
Further RTPf analysis was conducted for the first 2 MLB seasons after surgery (Table 6). Among position players, 71.4% and 75.0% returned to their preinjury workload based on plate appearances in M1 and M2, respectively. Recovery of offensive performance was common, with 71.4% returning in expected batting average and 57.1% in wRC+ during the first postoperative season. Average exit velocity returned for all position players in M1 (100%) and remained high in M2 (91.6%), while 66.6% maintained hard-hit percentage at or above baseline in both seasons. Defensive performance recovered, with 66.6% returning in defensive runs saved in M1 and 83.3% by M2. Overall, 52.4% of position players achieved full performance in M1 and 50.0% in M2. Among pitchers, 50.0% returned to preinjury expected fielding independent pitching in M1 and 57.1% by M2, and nearly all recovered fastball velocity (100% in M1 and M2) and spin rate (78.6% in M1; 71.4% in M2). Location+ recovered for most pitchers (85.7% in M1; 66.7% in M2). In contrast, only 28.6% returned to preinjury innings pitched or fWAR in either season, and recovery of Stuff+ and Pitching+ was notably limited (0% to 33.3% for Stuff+; 0% for Pitching+ in both seasons). Overall, 42.9% of pitchers achieved full performance in M1 and M2.
Return to Performance in MLB Position Players and Pitchers After Labral Repair a

Values represent the percentage of players who regained at least 95% of their preinjury performance level for each metric in the first (M1) and second (M2) postoperative MLB seasons.
Return thresholds were defined as follows: workload metrics (plate appearances, innings pitched) ≥95% of preinjury value; performance metrics (xFIP, fWAR, xBA, wRC+, defensive runs saved, average exit velocity, hard-hit percentage) ≥95% of preinjury value; velocity metrics (fastball velocity), within 1 mph of preinjury; spin rate, within 100 rpm of preinjury; composite pitching metrics (Stuff+, Location+, Pitching+), within 5 points of preinjury. Full performance for pitchers was defined as recovery in xFIP, fWAR, fastball velocity, and spin rate. Full performance for position players was defined as recovery in fWAR, wRC+, and defensive runs saved. fWAR, FanGraphs wins above replacement; Location+, command of the strike zone; MLB, Major League Baseball; Pitching+, overall pitching ability; Stuff+, physical quality of pitches; wRC+, weighted runs created plus; xBA, expected batting average; xFIP, expected fielding independent pitching.
Discussion
Our findings highlight a clear disparity in recovery outcomes after shoulder labral repair between MLB pitchers and position players. While >90% of position players successfully returned to MLB competition within 2 years, fewer than half of pitchers did so, and pitchers required, on average, >200 additional days to return. Even after returning, pitchers frequently failed to regain their preinjury performance levels in their first season returning to play, showing marked reductions in workload and contributing less than half of their prior overall value (fWAR) to their teams. They also demonstrated significant declines in pitch quality (Stuff+), command (Location+), and overall pitching effectiveness (Pitching+). Pitchers then recovered performance in Location+ and Pitching+ metrics by their second season back playing but not Stuff+, indicating a potentially reduced quality of their pitching arsenal irrespective of strike-zone command. In contrast, position players generally recovered their offensive and defensive performance metrics quickly. To our knowledge, this is the first study to comprehensively evaluate RTP and RTPf after labral repair in MLB athletes using advanced analytic and ball-tracking data.
The lower RTP among pitchers is likely multifactorial. Pitching imposes extreme repetitive torque and distraction forces on the glenohumeral joint, placing substantial stress on the repaired labrum and surrounding capsule. 13 Although our study did not directly assess biomechanics or psychological factors, the prolonged recovery times and diminished postoperative workloads observed in pitchers are consistent with the higher mechanical demands of repetitive overhead throwing. 25 Because offensive performance is less directly dependent on maximal overhead motion once pain and range of motion are restored, players may be able to regain or even refine batting and baserunning mechanics during rehabilitation. 25 Furthermore, the mechanism of injury and postoperative rehabilitation often differs significantly between position players and pitchers. Position players often have an acute traumatic episode after sliding into a base or making a diving play versus a more acute-on-chronic batting shoulder, with only 50% of cases involving the throwing shoulder. A total of 97% of pitchers injured their throwing shoulder in our study, indicating likely acute-on-chronic microtrauma from repetitive motion. Moreover, 17% of position players in our cohort were able to change to less demanding positions or designated hitter, prolonging their careers. These findings align with earlier data reporting lower RTP for MLB pitchers after shoulder surgery as compared with position players3,12 and reinforce the shoulder's role as a major contributor to cumulative injury burden in professional baseball. 28
A key finding of our analysis was the discrepancy between preserved raw pitch characteristics and diminished composite pitch quality. We found no significant postoperative declines in individual metrics such as velocity, spin rate, movement, or release point. However, pitchers demonstrated significant reductions in Stuff+, a composite analytic model that integrates these components to quantify the overall physical quality, or “nastiness,” of a pitch independent of strike-zone command. 23 These advanced analytics are some of the most highly predictive of performance and are extremely valued throughout the league.7,23,24 We hypothesize that while pitchers often regain raw pitch parameters, surgery may subtly disrupt how these variables interact, producing a less effective overall pitch profile. Significant declines across multiple composite metrics (Stuff+, Pitching+, Location+) in the first season returning from injury further suggest that performance loss is not merely due to velocity reduction or workload limitation but reflects broader degradation in the fine motor control and command necessary for elite pitching. These differences may explain why earlier studies, such as Cerynik et al, 5 which relied on traditional statistics including ERA and walks plus hits per inning pitched, reported successful postoperative outcomes among MLB pitchers. Pitchers then recovered performance in Location+ and Pitching+ metrics by their second season back playing but not Stuff+, although larger studies with more power may have shown more differences, especially in Pitching+. This suggests that pitchers are not throwing with the same physical ability (irrespective of command) 2 seasons after returning from surgery. By incorporating advanced analytic and ball-tracking data, the present study reveals performance deficits that conventional metrics likely failed to detect.
From a biomechanical perspective, the labrum is critical for maintaining glenohumeral stability during the extreme external rotation and rapid internal rotation of the pitching motion. 26 Labral repair, while restoring stability, may subtly alter capsular compliance, glenohumeral translation, and humeral head positioning during the throwing motion. These changes can influence the arm's layback position, modify the acceleration path, or alter shoulder rotational velocity, all of which affect release timing, spin generation, and pitch movement.29,36 While mean velocity and movement metrics in our study appear unchanged, minute postoperative inconsistencies in the kinetic chain could be enough to disrupt the precise coordination required to produce optimal pitch shape and accuracy. This would then be captured as the measurable declines in Stuff+ and Location+ observed in this cohort.
In our sample, pitchers rarely returned to preinjury levels in Stuff+, Location+, or Pitching+ during either of the first 2 seasons after surgery. Although some individual recovery was evident, most failed to achieve their prior benchmarks, suggesting persistent deficits in coordination and proprioceptive feedback that limit complete mechanical restoration. These findings emphasize that postsurgical performance limitations extend beyond workload or velocity loss to encompass lasting impairments in the movement patterns that define effective pitching.
Clinically, these findings suggest that RTP assessment should extend beyond velocity-based benchmarks. Rehabilitation and performance staff may consider incorporating objective composite metrics, such as Stuff+ and Location+, to evaluate readiness and guide late-stage rehabilitation. Persistent deficits in these measures may reflect incomplete recovery of dynamic stability, neuromuscular control, or coordination patterns that influence command and pitch effectiveness. For teams, monitoring these integrated performance indicators could inform workload progression and realistic expectations for postsurgical performance value (fWAR). In short, a pitcher may appear “recovered” by velocity alone while still demonstrating meaningful deficits in quality and command that translate into diminished on-field outcomes.
Limitations
This study has several limitations, primarily stemming from its reliance on publicly available data. 17 While this approach allowed for the collection of a contemporary cohort, it precludes access to personal medical records. Consequently, crucial clinical details were unavailable. These include the chronicity or onset of symptoms, the exact anatomic location and size of the labral tear, the presence of any concomitant pathology such as rotator cuff or biceps injuries, and specific surgical procedure details (eg, number and type of anchors or degree of bone loss). All of these factors could significantly influence recovery trajectories, but they could not be analyzed in this study. Furthermore, the sample size for the RTPf analysis was relatively small. This limited the statistical power for subgroup comparisons and was insufficient for robust multivariate regression modeling. Role-based analyses (eg, starters vs relievers) were not performed because of the modest sample size, which could introduce bias if smaller subgroups were isolated. Therefore, the multiple t tests used to compare pre- and postoperative performance should be interpreted as exploratory, and the clinical significance of these statistical differences has not been established.
Only 2 full postoperative MLB seasons were available for performance evaluation, so potential differences in long-term durability, career longevity, or late performance recovery could not be assessed. In addition, while advanced tracking and “plus” metrics are valuable composite indicators of performance, they are not clinical outcomes per se and may be affected by contextual factors such as team strategy, pitch calling, and opponent quality.
Finally, as with all studies using publicly available performance data, results could be confounded by unreported injuries, workload management decisions, or performance fluctuations unrelated to shoulder function. Despite these limitations, this study provides a comprehensive assessment to date of RTP and return to preinjury performance after labral repair in MLB athletes. These findings should therefore be viewed as an important contribution to the evolving understanding of postoperative outcomes in professional baseball players, while recognizing the need for future work incorporating detailed clinical and biomechanical data to validate and extend these observations.
Conclusion
The prognosis after shoulder labral repair is highly dependent on player role in MLB. Position players generally returned to MLB (92.9%) and recovered baseline performance. In contrast, pitchers faced a guarded prognosis, with only 43.6% returning to MLB and requiring a significantly longer recovery period. For those pitchers who did return, traditional metrics such as velocity and movement showed no significant change. However, advanced analytics identified a significant decline in pitch quality and command (Stuff+, Location+, Pitching+) accompanied by reduced workloads and overall value (fWAR), which later improved but not to baseline. These findings highlight the importance of comprehensive, performance-based evaluation when assessing recovery after labral repair.
Supplemental Material
sj-docx-1-ojs-10.1177_23259671261415844 – Supplemental material for Return to Play and Performance After Shoulder Labral Repair in Major League Baseball Players
Supplemental material, sj-docx-1-ojs-10.1177_23259671261415844 for Return to Play and Performance After Shoulder Labral Repair in Major League Baseball Players by Michael A. Mastroianni, Morgan R. Dillon, James Muscat, Kyle K. Obana, Dongyeon J. Kim, Andrew J. Luzzi, Frank J. Alexander, William N. Levine and Christopher S. Ahmad in Orthopaedic Journal of Sports Medicine
Supplemental Material
sj-docx-2-ojs-10.1177_23259671261415844 – Supplemental material for Return to Play and Performance After Shoulder Labral Repair in Major League Baseball Players
Supplemental material, sj-docx-2-ojs-10.1177_23259671261415844 for Return to Play and Performance After Shoulder Labral Repair in Major League Baseball Players by Michael A. Mastroianni, Morgan R. Dillon, James Muscat, Kyle K. Obana, Dongyeon J. Kim, Andrew J. Luzzi, Frank J. Alexander, William N. Levine and Christopher S. Ahmad in Orthopaedic Journal of Sports Medicine
Footnotes
Appendix
Demographics of MLB players who underwent a labral repair compared to matched controls.

| Pitchers (n=39) | Hitters (n=28) | |||||
|---|---|---|---|---|---|---|
| Variable | Cases | Controls (n=78) | P value | Cases | Controls (n=56) | P value |
| Age | 28.4 ± 3.3 | 27.6 ± 2.9 | 0.210 | 27.1 ± 3.3 | 27.1 ± 2.8 | 0.997 |
| Height (cm) | 190.2 ± 6.3 | 188.4 ± 6.1 | 0.125 | 184.0 ± 4.8 | 182.9 ± 4.6 | 0.317 |
| Weight (kg) | 99.4 ± 10.0 | 96.5 ± 9.7 | 0.140 | 94.1 ± 5.9 | 94.6 ± 8.2 | 0.733 |
| BMI | 27.5 ± 3.2 | 27.2 ± 2.6 | 0.602 | 27.8 ± 1.7 | 28.3 ± 2.4 | 0.284 |
| Career MLB seasons played | 6.4 ± 3.4 | 6.5 ± 3.4 | 0.864 | 6.9 ± 3.2 | 7.7 ± 3.2 | 0.240 |
| Draft number | 231.4 ± 269.2 | 247.9 ± 274.2 | 0.783 | 150.5 ± 180.0 | 198.1 ± 234.8 | 0.366 |
| Free agent | 21.7% | 36.2% | 0.225 | 17.2% | 28.6% | 0.298 |
| Right-handed | 33.3% | 33.3% | 1.000 | 21.4% | 21.4% | 1.000 |
| T1 workload (# pitches vs #PA) | 1298.0 ± 927.0 | 1395.9 ± 1020.3 | 0.730 | 290.7 ± 168.5 | 374.4 ± 202.5 | 0.106 |
BMI = Body Mass Index, cm = centimeters, IFA = signed as an amateur international free agent rather than via draft, kg = kilograms, SD = standard deviation, T1 = season prior to injury.
Final revision submitted November 24, 2025; accepted November 30, 2025.
One or more of the authors has declared the following potential conflict of interest or source of funding: C.S.A. is a paid consultant and receives royalties from Arthrex; he also serves as the head team physician of the New York Yankees. No other authors have any potential conflicts of interest.
Ethical approval for this study was waived by Columbia University Medical Center.
References
Supplementary Material
Please find the following supplemental material available below.
For Open Access articles published under a Creative Commons License, all supplemental material carries the same license as the article it is associated with.
For non-Open Access articles published, all supplemental material carries a non-exclusive license, and permission requests for re-use of supplemental material or any part of supplemental material shall be sent directly to the copyright owner as specified in the copyright notice associated with the article.