
Abstract
Background:
Passing a battery of return to sport (RTS) testing after anterior cruciate ligament reconstruction (ACLR) has been shown to reduce second injury rates. However, previously reported testing methods are inaccessible for most clinicians due to equipment, financial, and time constraints.
Purpose:
To assess whether patients after ACLR who pass a clinic-based RTS evaluation have residual strength and/or biomechanical deficits when tested compared with gold standard techniques.
Study Design:
Cross-sectional study; Level of evidence, 3.
Methods:
All participants passed a battery of clinic-based RTS tests—including ≥90% limb symmetry during isometric quadriceps strength, 1-repetition maximum isotonic knee extension, and 4 single-legged hop tests (single, crossover, triple, and 6-m timed)—as well as ≥90% on the Global Rating Scale and the International Knee Documentation Committee Subjective Knee Form 2000. Laboratory testing then included isometric quadriceps strength and rate of torque development (RTD) (90° of knee flexion) and isokinetic concentric quadriceps and hamstring strength (60 deg/sec) using an isokinetic dynamometer. An 8-camera, 2-force-plate, 3-dimensional motion analysis system was used to measure sagittal-plane joint angles and moments during bilateral and unilateral drop-vertical jumping. Paired t tests were conducted to assess interlimb differences.
Results:
In laboratory testing, the peak isometric quadriceps strength was 7.6% lower in the involved limb (P < .001). The isometric quadriceps RTD was up to 20.9% lower in the involved limb (P < .001). Isokinetically, the peak quadriceps strength was 4.9% lower in the involved limb (P = .003), while the peak hamstring strength was 4.7% higher in the involved limb (P = .017). All biomechanical measures demonstrated impaired loading of the injured limb with interlimb differences ranging from 6.6% to 67% (P < .005).
Conclusion:
Passing clinic-based RTS testing resulted in laboratory-based strength ≥90% limb symmetry and a previously established target of isometric quadriceps strength of 3 N·m/kg. However, deficits in quadriceps RTD and movement asymmetries persisted despite passing clinical criteria.
Keywords
Anterior cruciate ligament (ACL) injuries and subsequent surgical reconstructions (ACLR) can negatively affect the quality of life, 17 confidence, 37 and knee function 37 of young active individuals. Unfortunately, large population-based studies show a recent increase in the incidence of ACLR in the United States, 27 Canada, 54 Australia, 70 the Republic of Korea, 12 and Finland. 62 The vast majority of individuals expect to be able to return to baseline activity levels, with 86% to 94% reporting an expectation to return to their previous level of sport with minimal limitations.16,57 However, these expectations do not match current outcomes, with as many as 35% of individuals who undergo ACLR not returning to their previous level of sport. 3 In addition to difficulty returning to their previous level of function, up to 30% of young individuals returning to sport will have a second ACL injury. 51
Minimizing the risk of a second knee injury and maximizing return to the previous level of function has been the focus of many treatment approaches and recent research endeavors.1,39 Historically, the primary criterion used to allow for return to sport (RTS) was time from ACLR. 6 However, current consensus recommends the use of objective assessments of both physical and patient-reported function as part of the RTS decision-making process.42,44,49,67 Although reported RTS testing protocols have varied, several studies that included quadriceps muscle strength, performance-based metrics (eg, hop tests), and self-reported knee function have shown reduced second ACL injury risk and improved RTS rates when objective criteria are required to be met in the RTS decision-making process.23,63
Although the recommendation to perform RTS testing has been established,39,42,44 a survey of physical therapists found that RTS testing is not regularly performed in clinical settings. 20 These same physical therapists reported that a key factor in not performing RTS testing was the availability of equipment and resources. 20 The perceived lack of necessary equipment and resources to complete RTS testing may be related to the RTS testing methodology reported to date in the literature. Many reported test batteries require laboratory space, equipment (eg, an isokinetic dynamometer), specific skills to perform the testing, and more time than is often available in busy clinical settings.23,47,56,63,65 Therefore, it is critical that we identify solutions to these barriers to facilitate greater implementation of ACL RTS testing in typical clinical settings. There have been recent efforts to identify clinic-based RTS assessments that enable clinicians to objectively assess patient performance more easily. 10 Identifying potential clinic-based RTS assessments is the first step in developing a clinically accessible RTS testing protocol for broad use that will assist in criterion-based decision-making regarding RTS decisions. This study aimed to examine the performance of individuals during laboratory-based testing who had already passed a clinically accessible RTS testing battery. We hypothesized that individuals who passed a clinic-based RTS testing battery would continue to demonstrate interlimb differences during laboratory-based strength and drop vertical jump movement analysis.
Methods
Participants
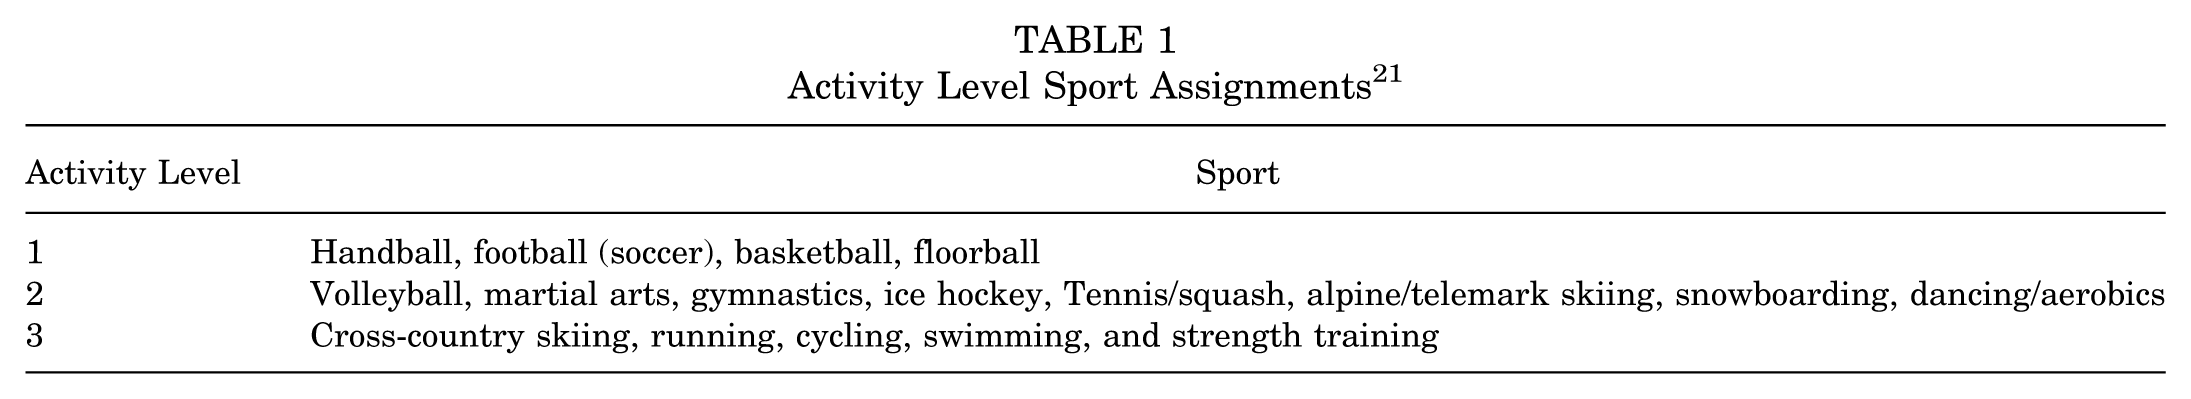
A total of 69 athletes aged between 10 and 25 years, with a history of unilateral ACLR within the last 5 to 15 months, who were planning to return to at least 50 hours of level 1 or 2 (Table 1) cutting and pivoting sports, 22 were enrolled between August 2020 and June 2022. Participants were excluded if they had previous surgery to either knee, concomitant surgery to their posterior cruciate ligament, medial collateral ligament, or lateral collateral ligament, or current or planned pregnancy. Participant operative reports were inspected for graft type, concomitant procedures, and whether or not the surgical technique was physeal-sparing for participants whose surgeons deemed them skeletally immature. All participants provided written informed consent as approved by the institutional review board at the University of Nebraska Medical Center (IRB No. 215-20-EP).
Activity Level Sport Assignments 21
Clinical Testing Battery
Participants were enrolled and completed the first clinical testing battery when either their physical therapist or surgeon determined they were physically capable of passing it. The first clinical testing battery was performed within 5 to 15 months after ACLR and included physical performance and patient-reported functional outcomes (Table 2). In the physical performance assessment, participants completed 2 separate quadriceps strength assessments (isometric and isotonic) and single-leg hop tests (single, triple, and crossover hops for distance; and 6-m timed hop). For patient-reported functional outcomes, participants completed the International Knee Documentation Committee Subjective Knee Form 2000 (IKDC) and the Global Rating Scale (GRS).
Clinical Testing Battery Procedures a

Strength and hop testing were completed for each limb. GRS, Global Rating Scale; IKDC, International Knee Documentation Committee Subjective Knee Form 2000; PROM, patient-reported outcome measure; ROM, range of motion.
Before performing the physical function testing, participants had their height and weight measured using a digital scale (kg) and stadiometer (m), respectively. Next, they performed a standardized 5-minute warm-up on a stationary bike. For each of the following performance tests, the uninvolved limb was tested first, followed by the involved limb.
Isometric quadriceps strength was assessed using a knee extension machine and a crane scale (Klau Model OCS-L; Zhiheng Intelligent Equipment) (Figure 1). Participants were secured to the knee extension machine at the chest and distal thigh, with hips flexed to 80° and knee flexed to 90°, with the machine's cushion at their distal shin. The crane scale was placed in line with a chain that secured the knee extension machine's arm, maintaining 90° of knee flexion. Participants completed 3 practice repetitions at 50%, 75%, and 100% of maximal effort to familiarize themselves with the task. Testing consisted of three 5-second maximal trials, with the maximal output recorded in newtons. Verbal encouragement was provided by the tester throughout each trial. At least 60 seconds of rest was provided between each trial. The maximum value across the 3 trials for each limb was used for analysis. Before beginning this study, 6 licensed physical therapists (A.C., P.M., W.S., C.T., M.W., E.W.) completed test-retest reliability testing using this isometric quadriceps strength testing protocol in 5 uninjured individuals. Two-way mixed-effects intraclass correlation coefficients (ICC [3,1]) demonstrated near-excellent reliability (ICC = 0.895; P < .001). Performing isometric testing in 90° of knee flexion has been shown to be a reliable and valid assessment of quadriceps strength when using a handheld dynamometer18,24,25 and strain gauge.15,43
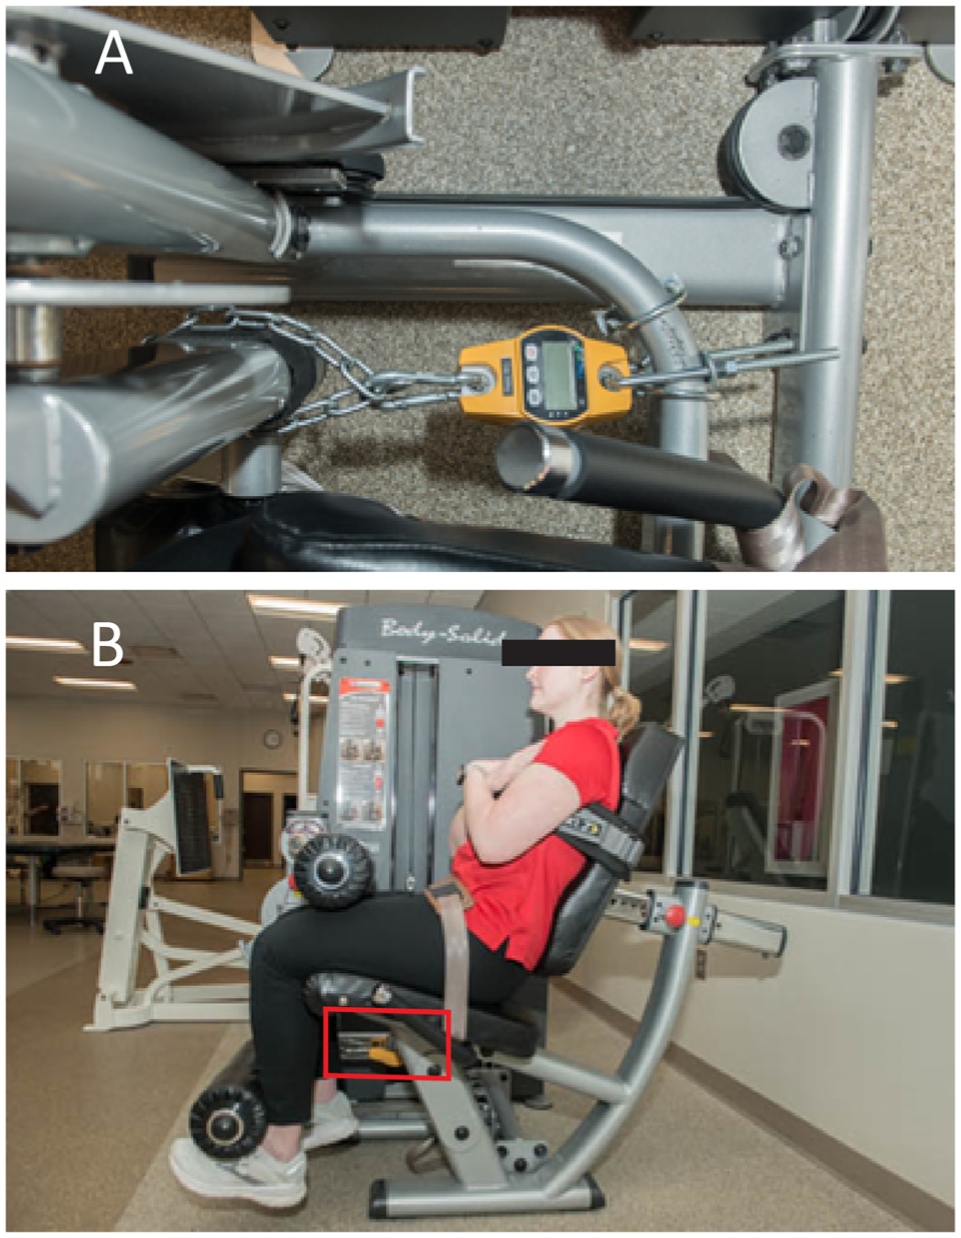
Set up for isometric testing. (A) Crane scale secured to the i-moving arm of the knee extension machine and ii-post on the knee extension machine. (B) The box indicates where the crane scale is secured to the knee extension machine.
Before completing isotonic quadriceps strength testing, participants completed patient-reported outcomes (minimum of 10 minutes). The isotonic quadriceps strength was assessed using a 1-repetition maximum protocol on a knee extension machine, with the same participant setup as described above for isometric testing. A successful repetition required the participant to extend their knee from 90° of knee flexion to at least 0° of knee extension. The resistance was progressively increased in 2.5- to 10-pound increments until the participant could not complete a successful repetition. At least 60 seconds of rest was provided between each repetition. The maximum resistance successfully completed at each limb was recorded in pounds. One-repetition maximum testing has been found to be reliable regardless of patients' experience with lifting, sex, or age. 21
Single-leg hop testing consisted of 4 commonly used tests completed in the following order: single hop, crossover, triple hop for distance, and 6-m timed hop. 48 Expert consensus from the literature review has identified all 4 hop tests as having sufficient intrarater reliability with low to moderate construct validity. 9 Participants completed at least 1 practice attempt of each hop test before completing 2 successful trials for each leg. A successful trial for the single- and triple-hop test required a controlled landing, defined as no movement of the landing foot without the contralateral foot or upper extremity touching the ground for at least 2 seconds. A successful crossover hop test required a controlled landing and crossing a 15-cm–wide strip of tape during all 3 hops in each trial. A successful trial for the 6-m timed hop test required an individual to hop only on the tested limb throughout the 6-m runway. At least 30 seconds of rest was provided between each trial. The mean of the 2 trials was recorded for each test.
Patient-reported outcome measures included the IKDC and the GRS. The IKDC is a valid and reliable assessment of pain, symptoms, and function after ACLR. 28 The IKDC uses a scale, ranging from 0% to 100%, with higher values representing better knee function. Individuals <19 years completed the Pediatric IKDC, which has also been found to be valid and reliable. 33 The GRS is a scale in which participants answer the following question: “How would you rate the current function of your knee on a scale from 0 to 100, with 0 being the inability to perform any activity and 100 being your level of knee function before your injury, including sports?” 29 The GRS is a reliable assessment of knee function and has been used to evaluate perceived function in those with ACL injuries and after ACLR.23,38
Participants were required to pass all components of the clinic-based RTS testing battery before completing laboratory-based RTS testing. For all physical function tests (quadriceps strength and hop tests), limb symmetry indices (LSIs) were calculated. Limb symmetry for all tests, except the 6-m timed hop test, was calculated using the following formula: (involved/uninvolved) × 100%. For the 6-m timed hop test, the LSI was calculated using the following formula: (uninvolved/involved) × 100%. To pass clinic-based RTS testing, participants had to achieve at least 90% LSI on all physical function measures and 90% on the IKDC and GRS during a single testing session, as previously recommended.19,36,38,42,59,60 If participants failed to reach the 90% threshold for any criterion, they were provided education on how to address remaining deficits and returned for testing after an appropriate time for needed improvements (eg, 4-6 weeks).
Laboratory Testing Battery
Within 2 weeks of passing clinical testing, participants completed laboratory-based testing. They performed a standardized warm-up that included 5 minutes of walking on a treadmill followed by 10 repetitions each of bilateral bodyweight squats, split squats, and squat jumps. After the warm-up, muscle strength testing was followed by 3-dimensional motion analysis.
Isometric and isokinetic strength were assessed using an electromechanical dynamometer (Biodex System 4 Pro, Biodex Medical Systems) sampled at 100 Hz. Participants were secured into the electromechanical dynamometer using straps across the chest, hips, and thigh of the test limb. Participants had their trunk upright, hips flexed to 90°, and the pad of the dynamometer secured 2 inches above their lateral malleolus (Figure 2). 41 Isometric testing was performed at 90° of knee flexion. After 3 warm-up trials at 50%, 75%, and 100% of maximal effort, participants completed three 5-second maximal trials with 60 seconds of rest between each trial. Participants were instructed to kick against the shin pad as hard and fast as possible, with verbal encouragement throughout the effort provided by the tester. After isometric testing, participants completed isokinetic concentric quadriceps and hamstring strength testing at 60 deg/sec. After 1 practice trial, participants completed 1 set of 5 repetitions. The variables of interest were peak isometric knee extension torque, early isometric rate of torque development (RTD) (during the first 0-100 ms after initiation), and late isometric RTD (100-200 ms after initiation), as well as peak isokinetic knee extension and knee flexion torque, all normalized to body mass (kg). The peak isometric extension and isokinetic extension and flexion torques were identified as the maximum torque produced throughout the entire signal. The RTD was calculated as the slope of the line over the first 200 ms after initiation and separated into early (0-100 ms) and late (100-200 ms) periods. The peak torque and peak RTD values during any trial for each limb were used for analysis.
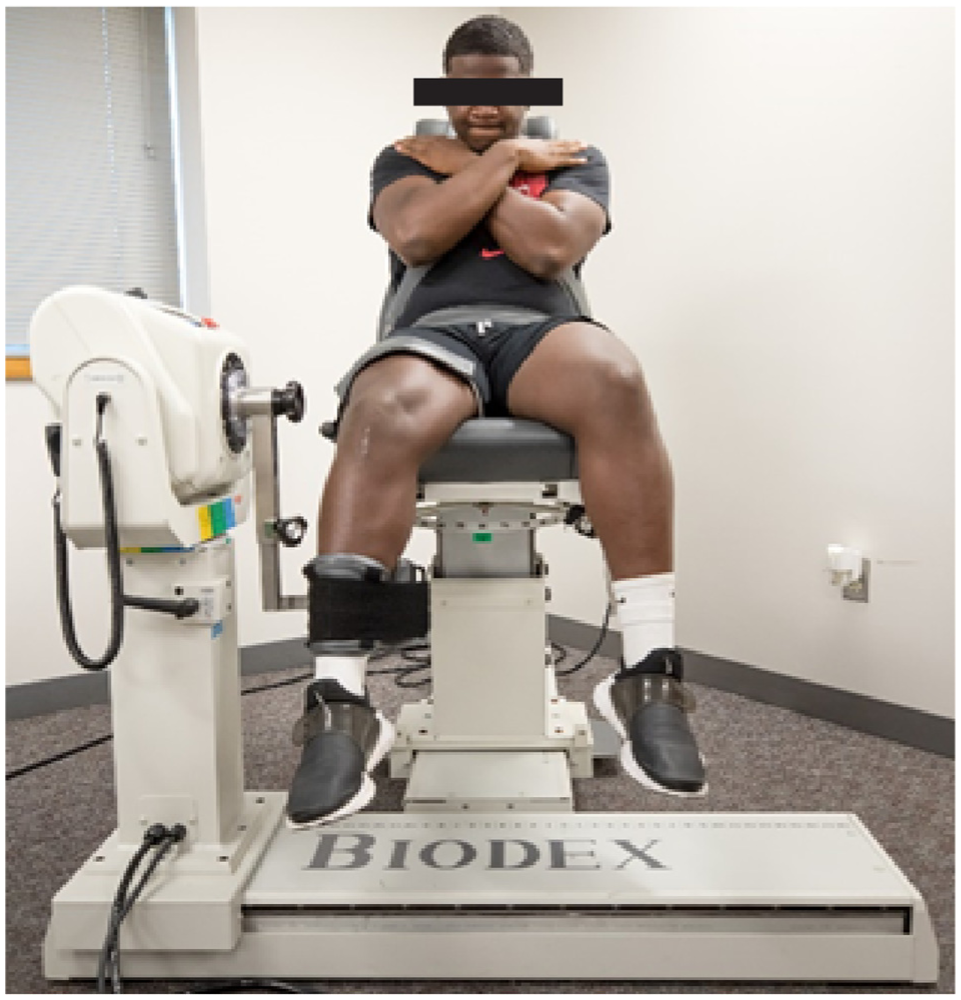
Isokinetic quadriceps testing.
Bilateral and unilateral drop vertical jumps (BDVJ and UDVJ, respectively) were evaluated during 3-dimensional movement analysis. Forty-seven 14-mm passive retroreflective markers were placed on each participant's sternum, C7 spinous process, T10 spinous process, and bilaterally on their acromion processes, iliac crests, anterior superior iliac spines, posterior superior iliac spines, lateral and medial femoral epicondyles, lateral and medial malleoli, and the base of the first and fifth metatarsals. Additional tracking markers were placed on the right and left upper trunks and at the proximal and distal heels. Rigid clusters with 4 markers were placed bilaterally on the lateral thigh and lower leg. 64 Motion capture data were performed using a 16-camera Qualysis system (240 Hz) and 2 embedded Bertec force plates (2160 Hz).
After a 1-second calibration trial in anatomic position, anatomic markers on the anterior superior iliac spine, medial and lateral femoral epicondyles, medial and lateral malleoli, and base of the first metatarsal were removed. Participants completed 5 valid trials of the BDVJ followed by 5 valid trials of the UDVJ for each limb from a 30-cm box. For the BDVJ, participants stepped off the box, leading with either limb and their hands on their hips. After landing on each foot on separate force plates, participants immediately completed a maximal-effort vertical jump. For a trial to be considered valid, participants had to maintain their hands on their hips and land with each foot on a separate force plate for both landings.31,34 UDVJs were completed similarly to the BDVJ, except that participants remained on a single limb throughout the trial, beginning with the uninvolved limb.31,34 For a trial to be considered valid, participants had to maintain their hands on their hips, land with their foot on a force plate for both landings, and maintain the second landing without losing balance. Marker data were labeled in Qualysis software and exported for processing in Visual3D software (C-Motion). Kinematic and kinetic data were processed with a low-pass, fourth-order Butterworth filter, with cutoff frequencies of 12 and 50 Hz, respectively.
A subject-specific model was created using the participant's height (as measured by stadiometer) and mass (as measured from force plates during static trial) to determine segment lengths and joint centers. Joint centers were created using methods previously described. 66 An inverse dynamics approach was used to calculate external joint moments. 68 Joint moments were normalized to body mass (kg) and height (m). A positive value indicated a knee flexion angle (KFA), external knee flexion moment, and knee extension power.
BDVJ and UDVJ variables of interest included peak external knee flexion moment (KFM) during the first landing, peak KFM loading rate from initial contact to peak KFM during the first landing, and peak knee extension power (KEP) during the propulsion phase (from the bottom of the first landing to lift off for the maximum vertical jump). For the BDVJ, peak ground-reaction force (vGRF) during the first landing was also evaluated. For the UDVJ, vertical jump height, KFA at the lowest point of the center of mass during the first landing, and the reactive strength index (RSI) were evaluated. The RSI was calculated using the following formula: vertical jump height/ground contact time. 46
Statistical Analysis
Nominal data were described using counts and proportions. Continuous data were described using means, standard deviations, and 95% CIs. Quantile-quantile plots were used to visually assess the normality of each variable. Paired t tests were used to assess interlimb differences in laboratory-based muscle strength along with BDVJ and UDVJ, with a P value of .05 set a priori. After performing all comparisons, a Benjamini-Hochberg False Discovery Rate correction was used to account for multiple comparisons. 8
Results
Of the 69 participants enrolled, 53 passed the clinically accessible RTS testing battery and were included in the analysis (Figure 3).

Flowchart of participant enrollment through study completion.
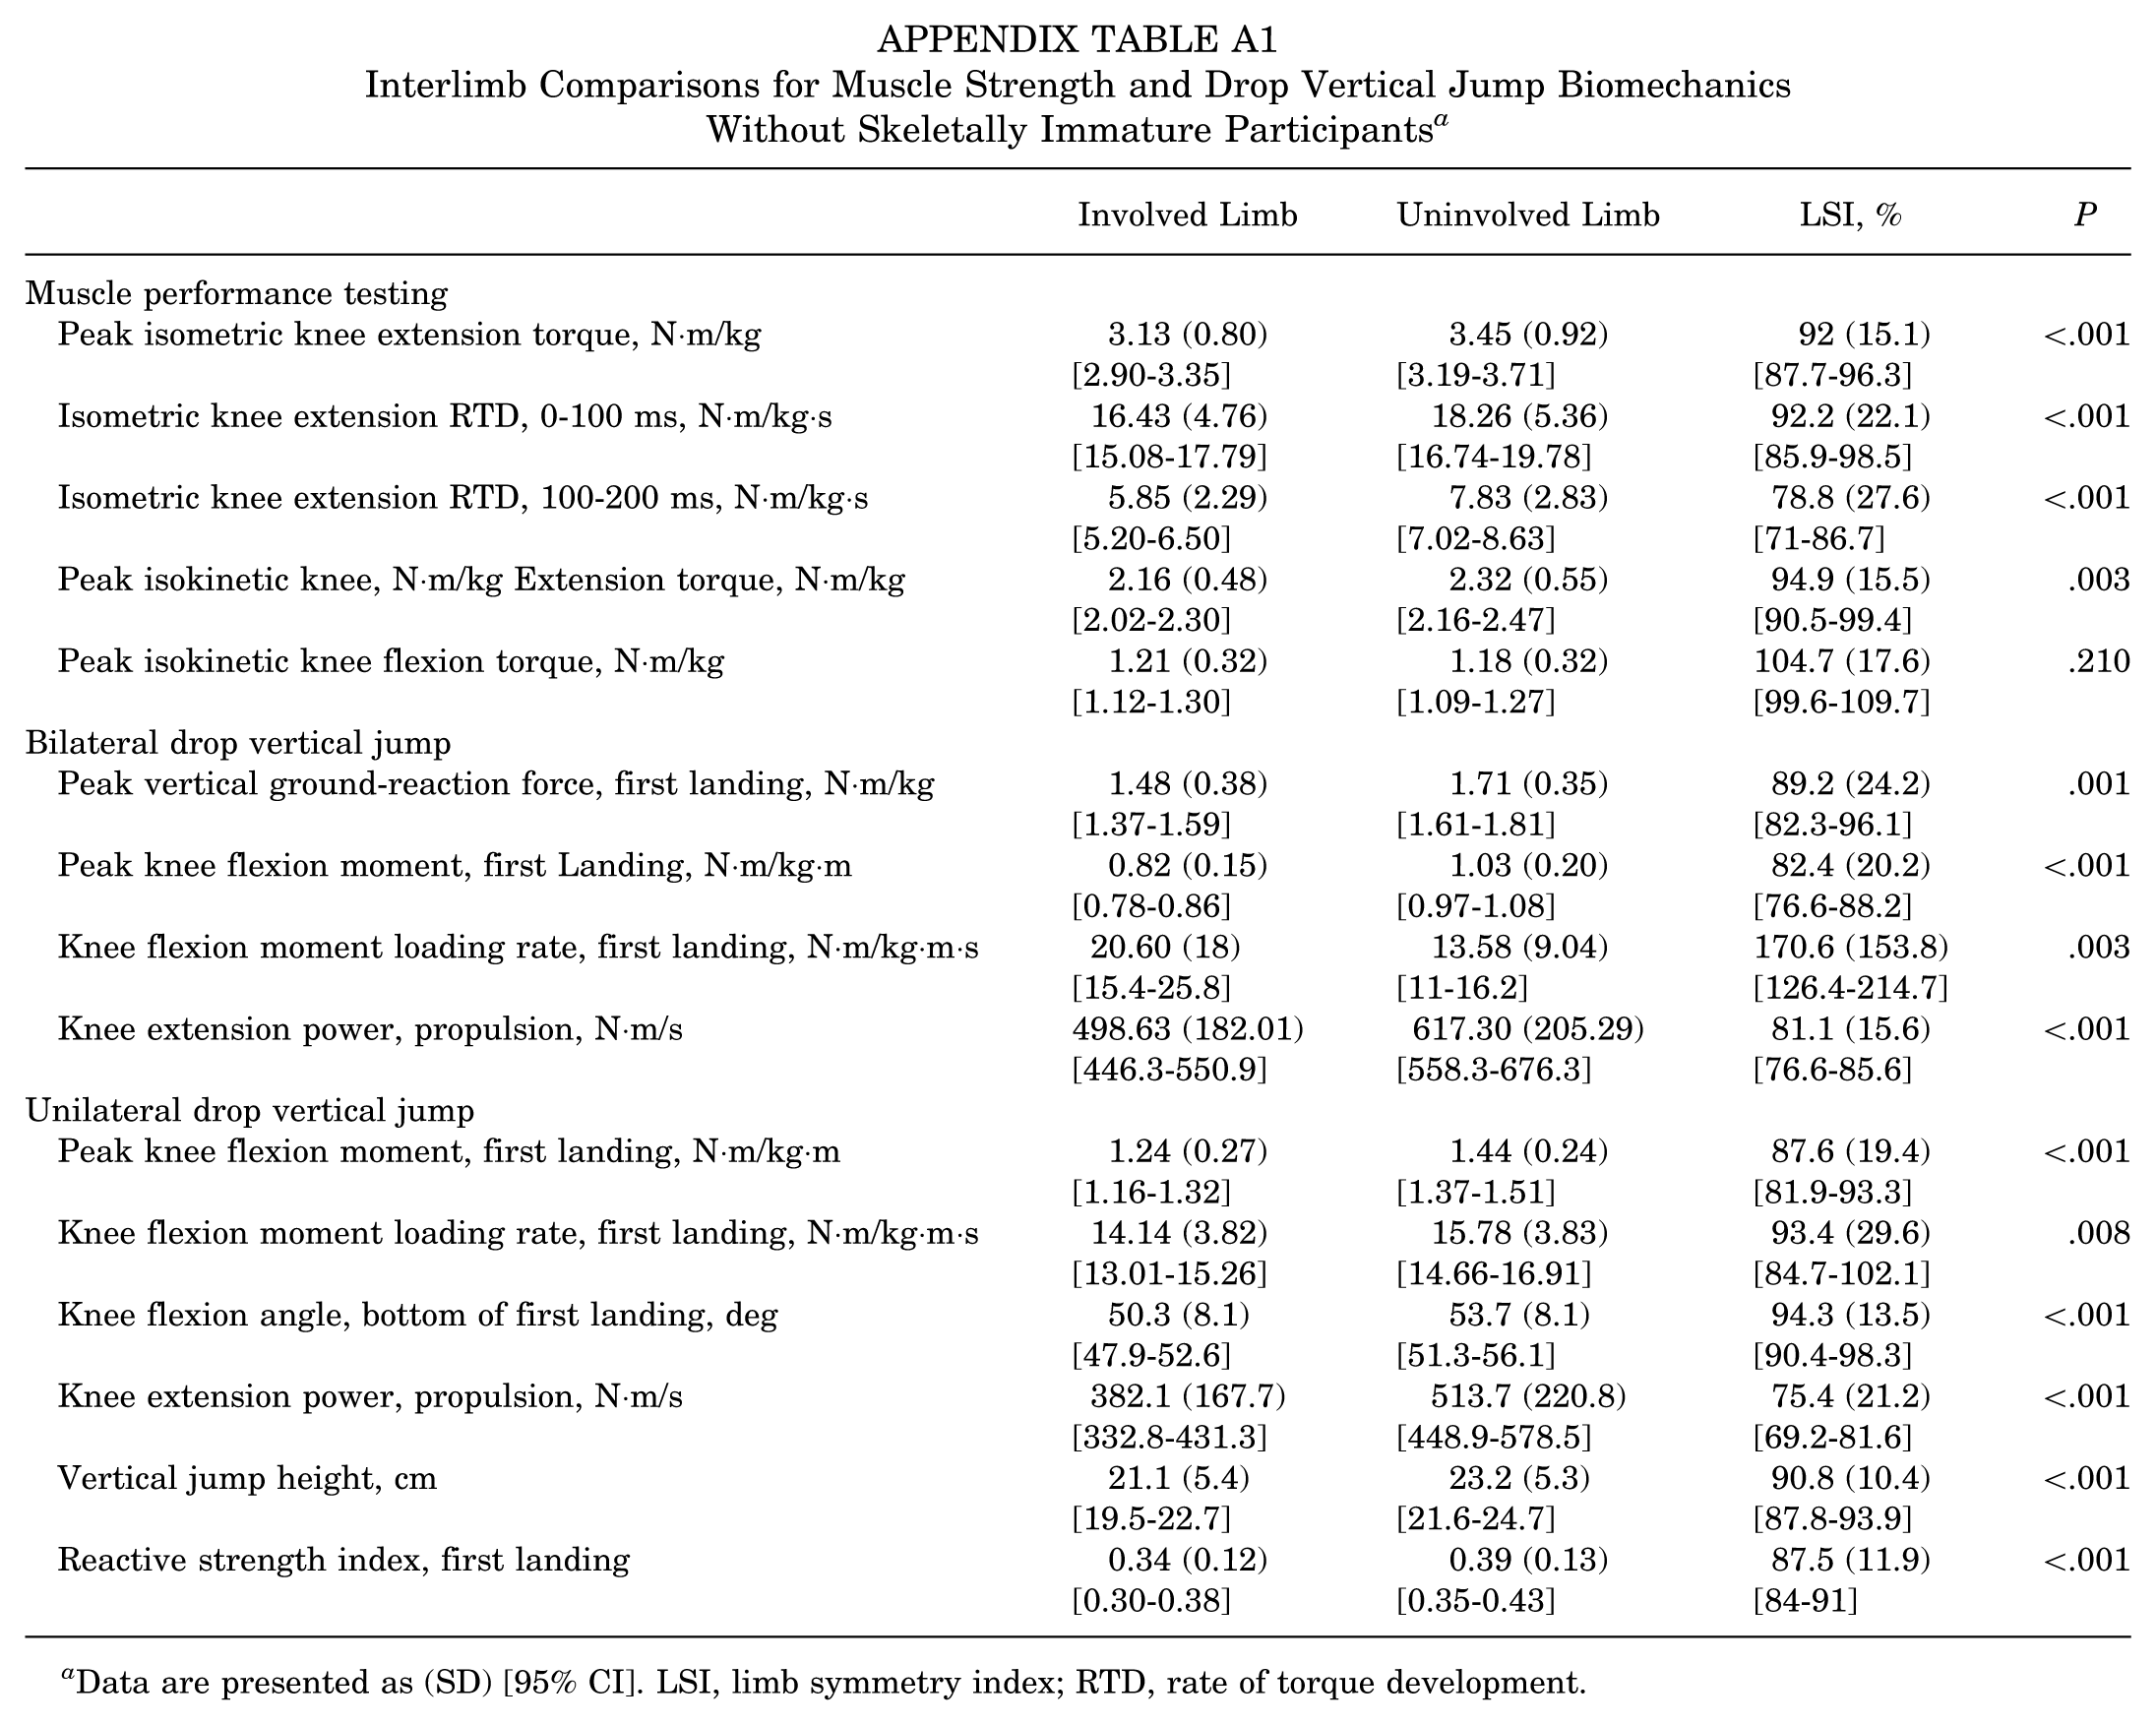
Demographic and participant characteristics of those who passed the clinical testing battery are presented in Table 3. Operative report inspection revealed that all 3 participants with iliotibial band autografts had physeal-sparing procedures. Based on the use of a physeal-sparing procedure, all 3 were deemed skeletally immature, and a sensitivity analysis was performed to assess their impact on the results (Appendix Table A1). In this analysis, 49% of participants were women, aged 17.2 ± 2.7 years, with a body mass index of 24.5 ± 4.1 kg/m2, and 10.5 ± 2.6 months post-ACLR. Clinical testing results are presented in Table 4.
Demographic and Participant Characteristics a
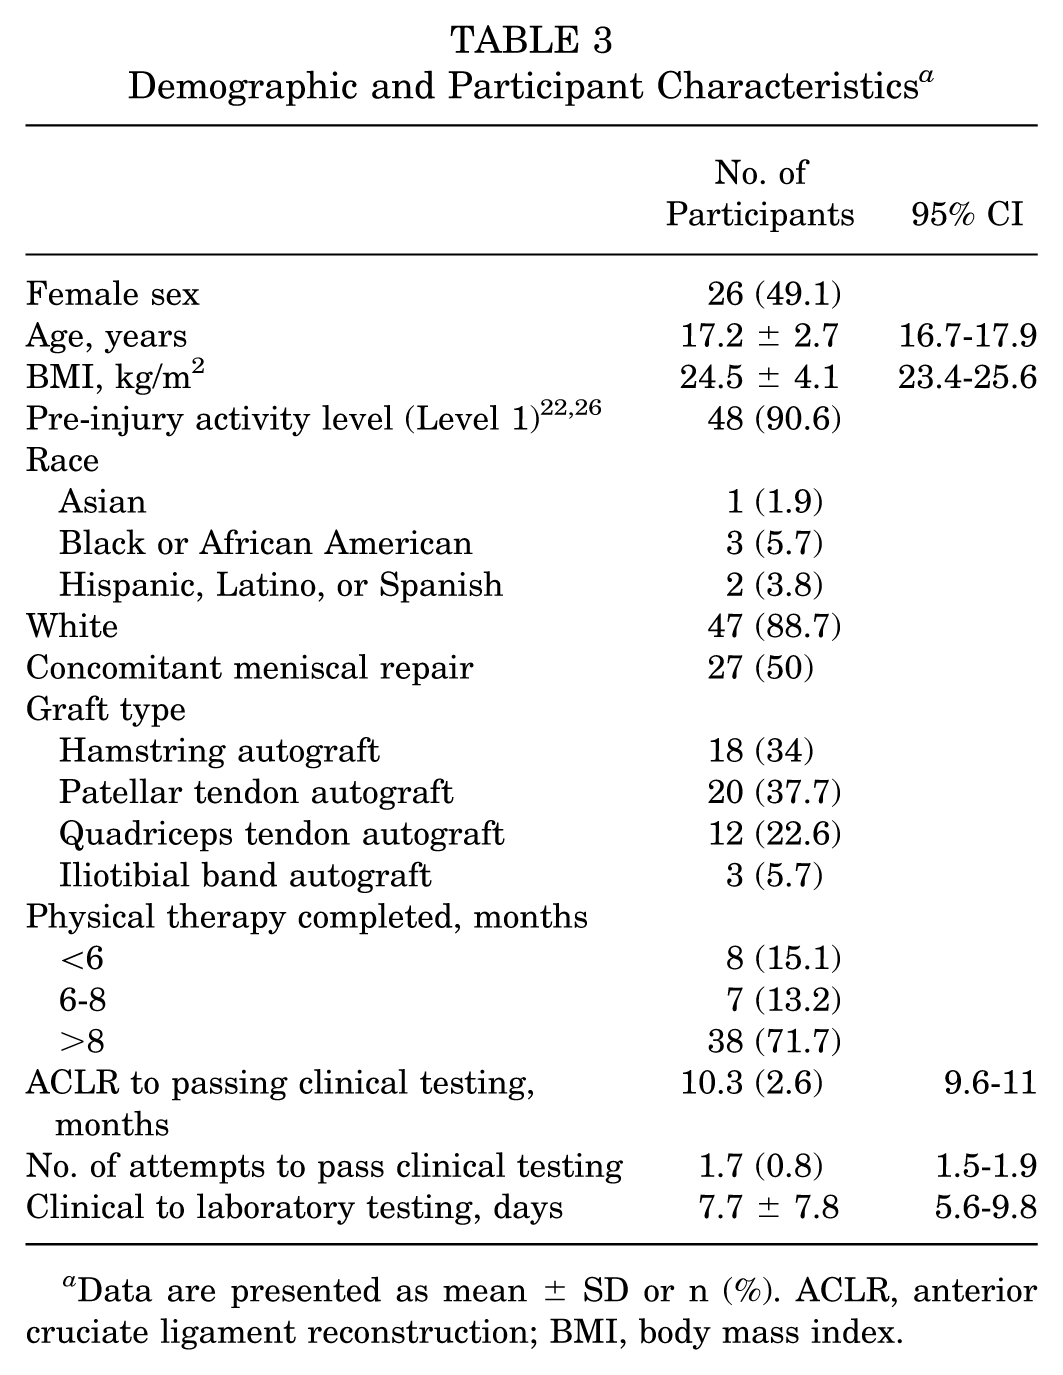
Data are presented as mean ± SD or n (%). ACLR, anterior cruciate ligament reconstruction; BMI, body mass index.
Clinical Testing Results for Injured and Uninjured Limbs a

Data are presented as mean ± SD [95% CI]. GRS, Global Rating Scale; IKDC, International Knee Documentation Committee Subjective Knee Form 2000; PROM, patient-reported outcome measure.
Interlimb comparisons of muscle strength and drop jump biomechanics from laboratory testing are presented in Table 5. Isometric and isokinetic quadriceps strength, as measured in the laboratory using the isokinetic dynamometer, was less in the involved compared with the uninvolved limb (isometric: P < .001; isokinetic: P = .003). The isometric quadriceps RTD was also lower in the involved limb, at both 0 and 100 ms (P = .001) and 100-200 ms (P < .001). Hamstring strength, measured isokinetically, was greater in the involved limb compared with the uninvolved limb (P = .017).
Interlimb Comparisons for Muscle Strength and Drop Vertical Jump Biomechanics a

Data are presented as (SD) [95% CI]. LSI, limb symmetry index; RTD, rate of torque development.
During BVDJ and UVDJ, the involved limb consistently demonstrated lower measures of joint loading compared with the uninvolved limb (all variables: P < .005; Table 5). During the first landing phase of the BVDJ and UVDJ, the peak vGRF and external peak KFM were smaller in the involved limb. While the KFM loading rate was lower in the involved limb during UDVJ (P = .004), it was significantly larger in the involved limb during BDVJ (P = .003). During the propulsion phase (before the maximal vertical jump), during both the BVDJ and UVDJ, the peak KEP was lower in the involved limb (P < .001 and P < .001, respectively). During UVDJ, participants demonstrated less knee flexion in the involved limb during the first landing phase (P < .001), and had a smaller vertical jump height (P < .001) and RSI (P < .001).
Discussion
The results of this study support our hypothesis that interlimb muscle strength and biomechanical differences would persist after passing a clinic-based RTS testing battery after ACLR. While on average, participants demonstrated >90% LSI on quadriceps strength testing using an electromechanical dynamometer, they still showed statistically significant lower isometric and isokinetic quadriceps strength and isometric RTD in the involved compared with the uninvolved limb. However, isokinetic hamstring strength was greater in the involved limb. During dynamic drop vertical jump tasks, the involved limb demonstrated consistently lower measures of peak loading and jump performance compared with the uninvolved limb. However, the KFM loading rate was greater in the involved limb during BDVJ compared with the uninvolved limb, while the opposite pattern was present during UDVJ.
Strength Testing
The isometric quadriceps strength was statistically lower (P < .001) in the involved limb compared with the uninvolved limb. On average, the involved limb was within 7.6% of the uninvolved limb (LSI, 92.4 ± 14.7% [95% CI, 88.3-96.4]); however, there was notable variability, as 30.2% of participants still demonstrated an isometric quadriceps strength LSI <80%, with an additional 11.3% of participants between 85% and 90%. The most common clinical recommendation for quadriceps strength clearance to RTS is a deficit of <10% between the involved and uninvolved limbs.23,61 To account for body size, an additional RTS recommendation has suggested a peak isometric knee extension torque normalized to body mass of 3 N·m/kg. 35 The current cohort achieved a mean peak isometric knee extension torque in the involved limb of 3.14 N·m/kg (95% CI, 3.11-3.17); however, 49% of participants were still <3 N·m/kg. The isometric knee extensor torque of our cohort contributes to the mixed results of quadriceps strength reported in the literature. In secondary analyses of a cohort required to have 80% symmetrical isometric quadriceps strength for enrollment, the isometric quadriceps strength LSI at 90° of knee flexion was reported to be similar to the current cohort (91.08% ± 8.74% to 93.4% ± 12.1%).4,5 In another study of 100 adolescents, who did not require a baseline strength threshold for enrollment, isometric quadriceps LSI was found to be much lower than the current cohort (66% ± 22% to 67% ± 23%). 11 While passing the clinical testing battery did not ensure our participants would achieve recommended levels of isometric strength on an electromechanical dynamometer, they had similar or better isometric quadriceps strength than previous cohorts.4,5,11
The participants in this study who passed this clinically accessible RTS testing battery also had higher isokinetic quadriceps strength than in previous reports.7,11,30,47,56,60 For example, in groups of individuals at a similar time point who were not required to meet any specific testing requirements, isokinetic quadriceps strength deficits of up to 27% were observed across various speeds.7,30,47,56 Additionally, Toole et al 60 noted that only 40% of athletes who had been cleared to RTS demonstrated a 90% LSI during isokinetic quadriceps testing at 180 deg/sec. Whereas in this cohort of individuals who passed a clinic-based RTS testing battery, 67% had an LSI >90% during quadriceps isokinetic testing, with an additional 20.8% with an LSI between 85% and 90%.
While the interlimb deficits in peak isometric and isokinetic strength were on average small (7.6% and 4.9%, respectively), there was a sizeable interlimb deficit in RTD, especially from 100 to 200 ms (20.9%) during the isometric strength testing. The RTD is proposed as an important descriptor of muscle function, as it reflects the speed of force development. 2 The early phase is proposed to be more closely related to neural activation, and the late phase more descriptive of muscular strength. 13 Previous reports have identified differences in the late phase of RTD in patients in 6 months, 32 9 months, 58 and over 4 years 14 after ACLR. A lower RTD may be related to difficulties with higher-level tasks such as jumping, landing, and cutting, as generating force quickly is necessary to perform these tasks successfully and may help mitigate the risk of a second ACL injury. The clinic-based RTS battery in the present study appears not to have sufficiently captured the desired levels of RTD. More work is needed to identify clinically accessible methods for measuring RTD.
Drop Vertical Jump Movement Analysis
Biomechanical interlimb deficits during the drop vertical jump tasks were larger than the differences in peak muscle strength. For example, the KFM of the involved limb was almost 19% lower during the BDVJ and 13% lower during the UDVJ compared with the uninvolved limb. Additionally, the KEP was over 17% less in the involved limb compared with the uninvolved limb during the BDVJ and almost 25% less during the UDVJ. The lower KFM during landing, paired with the power-generation deficit during propulsion, demonstrates a continued underloading pattern of the involved knee during both BDVJ and UDVJ. This underloading pattern was observed despite the peak isometric and isokinetic strength of the involved limb being within 8% of that of the uninvolved limb. The larger interlimb biomechanical differences are more similar in magnitude to the differences present in isometric quadriceps RTD. This may suggest that RTD may be an important indicator of one's ability to symmetrically complete dynamic tasks such as jumping.
Interestingly, participants showed less asymmetry in peak KFM and KFM loading rate during the UDVJ than the BDVJ. Greater asymmetry in the sagittal plane during the bilateral task may highlight a motor planning deficit that exists when the participant was able to use the uninvolved limb. This is important because sagittal-plane movement asymmetries affect the risk of second injury after ACLR.50,53 The greater amount of asymmetry seen during the BDVJ highlights the importance of neuromuscular training throughout rehabilitation. Multiple clinical practice guidelines recommend using neuromuscular re-education as part of the rehabilitation process.39,45,69 Persistent biomechanical asymmetries despite passing clinic-based RTS testing indicate a continued need to develop neuromuscular training strategies to help patients in performing tasks with minimal compensation.
The current literature presents conflicting findings regarding the magnitude of interlimb biomechanical differences compared with those observed in our study. In a study of recreational and elite male athletes, Kotsifaki et al 34 found that, although vGRF symmetry during the BDVJ was greater than in the current cohort (93% ± 7%), the RSI during the UDVJ was lower in the involved limb of the recreational athletes returning to sport (0.29 ± 0.12). Losciale et al 40 found that those who did not pass a clinical test that involved isometric quadriceps strength and single-leg hop testing, as well as patient-reported outcome clearance, had worse vGRF (83.2% ± 19.8%) and KFM (77.1% ± 23.8%) symmetry during a BDVJ when compared with the current cohort. However, the participants in the Losciale et al study who passed the clinical test had better vGRF (91% ± 16.7%) and KFM (89.5% ± 19.6%) symmetry than the current cohort. Schmitt et al 55 separated individuals into high quadriceps strength (>90% LSI on isometric testing) and low quadriceps strength (<85% LSI on isometric testing). Those with low quadriceps strength demonstrated worse symmetry in vGRF (between 60% and 70% LSI), KFM (between 70% and 80% LSI), and loading rate (between 60% and 70% LSI) during the BDVJ than in the current cohort. Lastly, Paterno et al 52 identified worse vGRF symmetry during the BDVJ in both men (83.2% ± 13.6%) and women (84.8% ± 23.5%) at the time of RTS after ACLR. Taken together, it appears that passing a clinical testing battery—including quadriceps strength and single-leg hops— may result in greater symmetry during biomechanical drop vertical jump analysis.
Overall, a simple, low-cost clinic-based RTS testing battery after ACLR provided a standardized assessment of RTS readiness. While clinical RTS testing cannot fully capture all information gained from laboratory RTS testing, it is a valuable resource that appears to help in understanding the relative (ie, limb symmetry) and absolute (ie, relative to body mass) strength of the involved limb. Future work is needed to explore the relationships between remaining strength and biomechanical movement impairments, RTS success, and reinjury rates. More work is required in this cohort.
This study is the first to describe muscle strength and biomechanical deficits after meeting clinic-based RTS testing thresholds after ACLR. There is considerable evidence supporting the use of RTS testing to reduce knee reinjury,42,44,49,67 and our findings are the next step toward identifying additional testing that may be required beyond clinic-based testing to further mitigate reinjury risk. Compared with previous cohorts that tested individuals who had not formally passed an objective testing battery, our participants who passed objective clinic-based testing demonstrated more symmetrical strength and movement.30,47,56 Our future work will evaluate whether the remaining laboratory-based deficits are associated with reinjury risk or RTS outcomes.
This study does contain some limitations to consider when interpreting the results. This study is a cross-sectional analysis; it is unknown how the remaining deficits in strength and movement symmetry relate to the risk of a second injury. The large age range in the present study presented an opportunity to include younger individuals. However, within this age range, it is difficult to compare younger with older individuals because of potential differences in skeletal maturity. The current cohort had 3 individuals who were deemed skeletally immature by their surgeons and had physeal-sparing procedures performed. A sensitivity analysis excluding these 3 participants revealed only minor changes in the results of 2 comparisons (isokinetic knee flexion strength). Otherwise, all results remained the same. Another limitation is the variety of graft types and the lack of standardization on surgical or rehabilitation protocols. While this may impact the progression of some participants, it improves the generalizability of the results. Additionally, hop testing has limitations, as symmetry can be present despite inadequate quadriceps strength. 65 However, these tests are particularly accessible for clinicians, as the tests only require a 6-m runway, a tape measure, and a stopwatch. Lastly, while pilot data from the present study established rater reliability for the crane scale, there is currently no published literature on test-retest reliability for the crane scale used to clinically assess isometric quadriceps strength.
Conclusion
A simple, low-cost clinic-based RTS testing battery after ACLR resulted in small interlimb differences in quadriceps strength, but larger quadriceps RTD deficits remained. Further, despite passing the clinic-based RTS test battery, asymmetrical movement patterns were observed during drop vertical jumping. The results of this study support inclusion of this clinic-based testing protocol as part of objective testing, but additional testing that captures RTD and biomechanics may be needed to assess further readiness to RTS after ACLR. Additionally, continued efforts to improve RTD should be included throughout the rehabilitation process.
Footnotes
Appendix
Interlimb Comparisons for Muscle Strength and Drop Vertical Jump Biomechanics Without Skeletally Immature Participants a
| Involved Limb | Uninvolved Limb | LSI, % | P | |
|---|---|---|---|---|
| Muscle performance testing | ||||
| Peak isometric knee extension torque, N·m/kg | 3.13 (0.80) [2.90-3.35] |
3.45 (0.92) [3.19-3.71] |
92 (15.1) [87.7-96.3] |
<.001 |
| Isometric knee extension RTD, 0-100 ms, N·m/kg·s | 16.43 (4.76) [15.08-17.79] |
18.26 (5.36) [16.74-19.78] |
92.2 (22.1) [85.9-98.5] |
<.001 |
| Isometric knee extension RTD, 100-200 ms, N·m/kg·s | 5.85 (2.29) [5.20-6.50] |
7.83 (2.83) [7.02-8.63] |
78.8 (27.6) [71-86.7] |
<.001 |
| Peak isokinetic knee, N·m/kg Extension torque, N·m/kg | 2.16 (0.48) [2.02-2.30] |
2.32 (0.55) [2.16-2.47] |
94.9 (15.5) [90.5-99.4] |
.003 |
| Peak isokinetic knee flexion torque, N·m/kg | 1.21 (0.32) [1.12-1.30] |
1.18 (0.32) [1.09-1.27] |
104.7 (17.6) [99.6-109.7] |
.210 |
| Bilateral drop vertical jump | ||||
| Peak vertical ground-reaction force, first landing, N·m/kg | 1.48 (0.38) [1.37-1.59] |
1.71 (0.35) [1.61-1.81] |
89.2 (24.2) [82.3-96.1] |
.001 |
| Peak knee flexion moment, first Landing, N·m/kg·m | 0.82 (0.15) [0.78-0.86] |
1.03 (0.20) [0.97-1.08] |
82.4 (20.2) [76.6-88.2] |
<.001 |
| Knee flexion moment loading rate, first landing, N·m/kg·m·s | 20.60 (18) [15.4-25.8] |
13.58 (9.04) [11-16.2] |
170.6 (153.8) [126.4-214.7] |
.003 |
| Knee extension power, propulsion, N·m/s | 498.63 (182.01) [446.3-550.9] |
617.30 (205.29) [558.3-676.3] |
81.1 (15.6) [76.6-85.6] |
<.001 |
| Unilateral drop vertical jump | ||||
| Peak knee flexion moment, first landing, N·m/kg·m | 1.24 (0.27) [1.16-1.32] |
1.44 (0.24) [1.37-1.51] |
87.6 (19.4) [81.9-93.3] |
<.001 |
| Knee flexion moment loading rate, first landing, N·m/kg·m·s | 14.14 (3.82) [13.01-15.26] |
15.78 (3.83) [14.66-16.91] |
93.4 (29.6) [84.7-102.1] |
.008 |
| Knee flexion angle, bottom of first landing, deg | 50.3 (8.1) [47.9-52.6] |
53.7 (8.1) [51.3-56.1] |
94.3 (13.5) [90.4-98.3] |
<.001 |
| Knee extension power, propulsion, N·m/s | 382.1 (167.7) [332.8-431.3] |
513.7 (220.8) [448.9-578.5] |
75.4 (21.2) [69.2-81.6] |
<.001 |
| Vertical jump height, cm | 21.1 (5.4) [19.5-22.7] |
23.2 (5.3) [21.6-24.7] |
90.8 (10.4) [87.8-93.9] |
<.001 |
| Reactive strength index, first landing | 0.34 (0.12) [0.30-0.38] |
0.39 (0.13) [0.35-0.43] |
87.5 (11.9) [84-91] |
<.001 |
Data are presented as (SD) [95% CI]. LSI, limb symmetry index; RTD, rate of torque development.
Final revision submitted April 9, 2025; accepted May 19, 2025.
One or more of the authors has declared the following potential conflict of interest or source of funding: Partial funding for this study was provided by a George Blanton grant from the Nebraska Physical Therapy Foundation, with M.W. as the principal investigator and M.T. as a coinvestigator. The George Blanton grant from the Nebraska Physical Therapy Foundation provided support for participant reimbursement and consumable supplies related to 3-dimensional motion analysis. AOSSM checks author disclosures against the Open Payments Database (OPD). AOSSM has not conducted an independent investigation on the OPD and disclaims any liability or responsibility relating thereto.
Ethical approval for this study was obtained from the University of Nebraska Medical Center (IRB No. 215-20-EP).