
Abstract
Background:
High tibial osteotomies (HTOs) and distal femoral osteotomies (DFOs) may be used for a variety of knee pathologies including unicompartmental cartilage disorders and ligamentous instability. A novel instrumentation system for osteotomies utilizing 3-dimensional patient-specific instrumentation (3D PSI) cutting guides has been recently described; however, there is limited reporting on the clinical outcomes and accuracy of this system.
Purpose/Hypothesis:
The purpose of this study was to evaluate the clinical outcomes and accuracy of correction of a 3D PSI osteotomy system. It was hypothesized that patients would have significant improvements in patient-reported outcome (PRO) scores and that ≥90% of patients would have coronal and sagittal alignment within 10% and 3°, respectively, of the planned correction.
Study Design:
Case series; Level of evidence, 4.
Methods:
Patients who underwent opening wedge (oW) or closing wedge (cW) HTO or DFO utilizing a 3D PSI system from October 2020 to June 2022 were reviewed. Mechanical medial tibial width ratio (mMTWr) and posterior tibial slope (PTS) were evaluated pre- and postoperatively on full-length standing alignment films and lateral radiographs of the knee, respectively. The absolute difference between the planned correction and postoperative measurements was calculated. PROs (International Knee Documentation Committee [IKDC]; Lysholm; and Western Ontario and McMaster Universities Osteoarthritis Index [WOMAC] Pain, WOMAC Stiffness, WOMAC Physical Function, and WOMAC Total) were obtained from all patients at a minimum of 2 years postoperatively. All data are reported as means unless otherwise noted.
Results:
A total of 23 cases (16 oW HTO, 4 oW DFO, 2 cW DFO, and 1 combined cW HTO + oW DFO) were included at a mean follow-up of 2.6 years. Using a Bonferroni-corrected P value (P < .006), there were significant improvements from pre- to postoperatively in IKDC, Lysholm, WOMAC Pain, WOMAC Stiffness, WOMAC Physical Function, and WOMAC Total scores. Of the 16 cases with full-length limb-alignment films postoperatively, 88% of patients were within 10% of the planned final mMTWr, and the median difference between the planned and actual correction was 3.7% (25%-75%; IQR, 1.7-9.0). Of patients who underwent HTO, 67% were within 3° of the planned final PTS and the mean difference between the planned and actual PTS was 2.2°± 2.0°.
Conclusion:
This study found that patients who underwent corrective HTO or DFO using 3D PSI had significant improvements in PROs; there was good accuracy of coronal correction with 88% of patients falling within 10% of the planned final mMTWr and moderate accuracy with 67% of patients falling within 3° of the planned final PTS. These findings demonstrate that osteotomy utilizing 3D PSI can lead to clinically meaningful improvements in patient function with high accuracy of planned correction.
High tibial osteotomies (HTOs) and distal femoral osteotomies (DFOs) can be used to treat a variety of knee pathologies ranging from unicompartmental cartilage disorders or osteoarthritis (OA) to ligamentous instability in the setting of malalignment.9,18,22,36 Osteotomies can be used to correct coronal malalignment or sagittal malalignment, which can occur in isolation or concomitantly, the latter of which may require a biplanar osteotomy. Long-term studies have shown favorable results for osteotomy for the treatment of unicompartmental OA, with survivorship rates ranging from 74.7% to 97.6% and 66% to 90.4% at 10 and 15 years, respectively1,13,15,26,34; and osteotomy remains a powerful treatment option that can improve patients’ function and quality of life. 11
The accuracy of correction is critical, as overcorrection can lead to profound changes in contact forces in the contralateral compartment, 16 such as the lateral compartment in a varus knee. Inaccurate corrections can also alter forces placed across ligaments, such as increased posterior tibial slope (PTS) leading to increased force across the anterior cruciate ligament (ACL) and risk of ACL rupture or anteroposterior instability.4,8,25,32,40 Both under- and overcorrection have also been shown to correlate with inferior patient-reported outcomes (PROs).12,28 Prior studies have demonstrated rates of under- or overcorrection ranging from 5% to 50% after HTO and DFO.6,31
Thus, there has been increased interest in the use of various intraoperative tools to increase accuracy of correction including computer navigation as well as patient-specific instrumentation (PSI) and cutting guides. Prior studies have suggested that these strategies may improve the accuracy of correction for both HTO and DFO; however, there is limited reporting of the accuracy of the recently released Fine Osteotomy system (Bodycad), which creates a 3-dimensional (3D) model based on a preoperative computed tomography (CT) scan using the Bodycad software. A 3D-printed cutting guide is utilized intraoperatively to perform the osteotomy, and a custom-contoured titanium plate is used for fixation.
Thus, the goal of this study was to evaluate the clinical outcomes and the coronal and sagittal correction accuracy of this recently released system. The evaluation of sagittal correction accuracy was only a secondary goal given that measurement of PTS on plain radiographs may not be as accurate or reproducible. It was hypothesized that (1) ≥90% of osteotomies would yield within 10% of the desired coronal correction and within 3° of the planned postoperative PTS, which we termed acceptable correction, and (2) patients would see significant improvement in PRO scores.
Methods
After institutional review board approval was obtained, a retrospective review was performed on a prospectively maintained database of patients who underwent HTO or DFO utilizing 3D PSI by 1 of 2 sports medicine fellowship–trained senior orthopaedic surgeons at a single institution from October 2020 to June 2022. Information regarding patient demographics and injury characteristics including concomitant chondral, meniscal, and ligamentous pathology was collected for all patients.
Patients were included if they underwent HTO or DFO utilizing a 3D PSI system (Fine Osteotomy; Bodycad), had preoperative radiographs including full-length standing alignment film and a lateral radiograph of the knee, and underwent 3D CT scan for utilization of the 3D PSI system. Patients were excluded if they had undergone any prior osteotomy. Indications for osteotomy included symptomatic varus malalignment and medial compartment OA, symptomatic valgus malalignment and lateral compartment OA, or meniscal pathology such as meniscal deficiency or meniscus root tear with concomitant overload due to malalignment. In cases involving OA, patients underwent a trial of unloader bracing prior to being indicated for osteotomy. A positive response to bracing was not required for indication for surgery, as not all deformities respond to bracing but may respond positively to osteotomy. Thorough informed consent and discussion of expectations took place prior to surgery. Contraindications for osteotomy included grade 3 or 4 chondral lesions diagnosed on magnetic resonance imaging according to the International Cartilage Regeneration & Joint Preservation Society in the contralateral compartment (eg, lateral compartment for a varus knee), active infection, extension deficit >10°, and flexion <100°. Patients with concomitant patellofemoral chondral pathology were not excluded, although care was taken preoperatively to confirm, via history and physical exam, that their patellofemoral pathology was not their primary pain generator.
Planning and Radiographic Evaluation
Radiographic measurements were performed with Merge Picture Archiving and Communication System (IBM Corp) by blinded independent raters (R.L.A. and A.C.K.). To assess coronal and mechanical alignment, mechanical medial tibial width ratio (mMTWr), defined as the distance from the medial aspect of the tibia to the point on the tibia where the mechanical axis intersects the tibial plateau divided by the entire width of the tibial plateau, was measured on standing whole-leg radiographs (Figure 1). To assess sagittal alignment, medial PTS was measured on standing lateral knee radiographs (Figure 2) using a previously described and validated technique. 37

(A) Preoperative and (B) postoperative whole-leg weightbearing radiographs of a left lower extremity are shown. The mechanical axis weightbearing line (blue line) is drawn from the center of the femoral head to the center of the talus. The distance from the medial aspect of the tibial plateau to the intersection point between this line and the tibial plateau is measured (red line) and divided by the entire width of the tibial plateau (dotted green line) and multiplied by 100 to calculate the mechanical medial tibial width ratio (mMWTr). In this case, after a medial opening wedge high tibial osteotomy, the mMWTr increased, reflecting the correction of the varus alignment.

Two circles (yellow) are drawn along the anterior and posterior tibial cortices 5 cm and 10 cm below the joint line. A line is drawn passing through the center of these circles that represents the tibial proximal anatomic axis (TPAA; orange line). The posterior tibial slope (PTS) is defined as the angle between a line along the medial tibial plateau (white) and a line perpendicular to the TPAA (dotted purple). These measurements are shown (A) preoperatively and (B) postoperatively after a medial opening wedge high tibial osteotomy that was templated to maintain the preoperative slope.
Whole-leg CT imaging was obtained on all patients preoperatively, which was a prerequisite for this 3D PSI system, and 3D digital models were generated for all cases utilizing a semiautomated commercial PSI software (Bodycad). The method of measurement using semiautomated commercial PSI software and 3D was recently described, 21 and, in brief, to obtain the coronal measurements, the 3D models were superimposed upon the patient's full-length standing alignment radiographs, and the software identified various bony landmarks at the hip, knee, and ankle to measure the mMTWr. To measure the PTS, the software created 2 best-fit 2-dimensional circles for the medial and lateral plateaus, and the anatomic axis of the tibia was generated from a best-fit line running through the center of the tibia. The software calculated the angle between each circle and the anatomic axis of the tibia to independently measure the medial and lateral PTS. 3D-printed cutting guides were then created based on the desired correction and cutting point by the surgeon and software-assisted templating. Typical corrections involved altering the mechanical lateral distal femoral angle or mechanical medial proximal tibial angle, mechanical tibiofemoral angle, and PTS to within normal limits, but final corrective preoperative plans were determined by the surgeon performing the osteotomy.
Surgical Technique
The technique for performing an HTO or DFO utilizing this 3D PSI system has been previously described.14,19,29 In brief, standard diagnostic arthroscopy was performed to evaluate for osteochondral lesions that may have needed to be addressed concomitantly or in stage fashion, then a standard approach was utilized based on the desired osteotomy location and approach. During all approaches, care was taken to expose the posterior surface of the distal femur or proximal tibia so that retractors could be placed to protect the posterior neurovascular structures. All tibial osteotomies were performed through a medial approach. Opening wedge (oW) DFOs were performed through a lateral approach, and closing wedge (cW) DFOs were performed through a medial approach.
Once the approach was performed, a 3D-printed patient-specific cutting guide was first placed on a 3D-printed model of the patient's proximal tibia or distal femur to confirm the desired location of the guide (Figure 3). Images detailing distal femoral osteotomy technique utilizing the 3D PSI are available in the Supplemental Material (available separately). Once this was visualized, the guide was then placed on the patient's proximal tibia or distal femur, and a pin was placed through the guide. Intraoperative fluoroscopy was compared with the preoperative plan, which contained the desired pin location to confirm that the guide was correctly placed (Figure 4), and the guide was further secured with self-drilling, self-tapping, unicortical set screws.
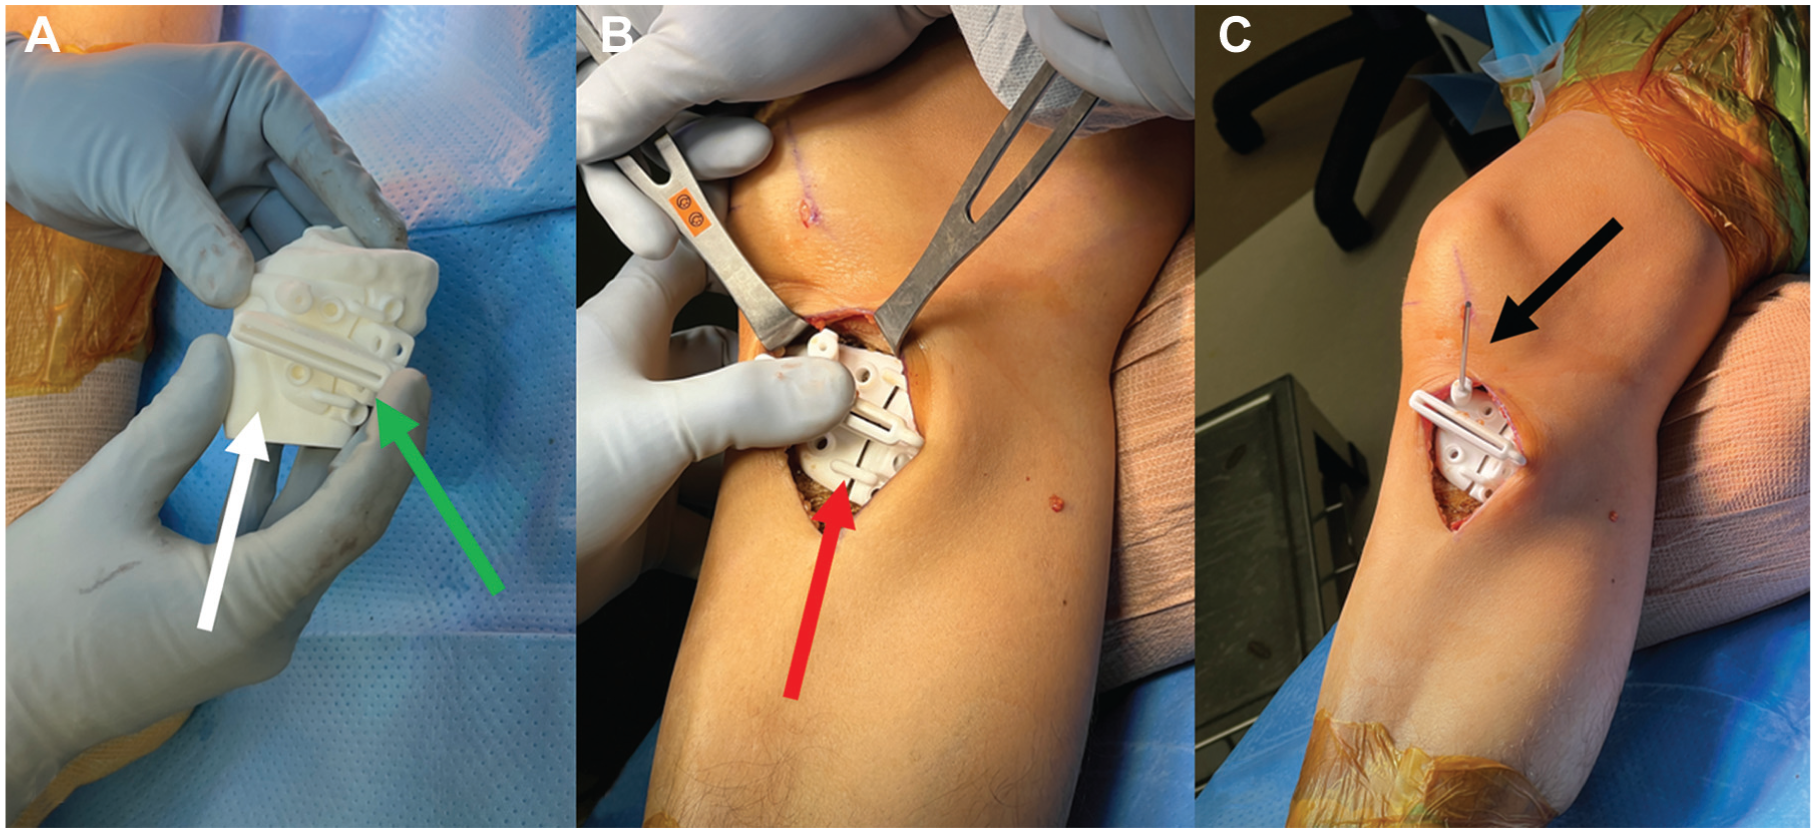
(A) A 3-dimensional (3D) printed model of a patient's proximal tibia (white arrow), based on preoperative computed tomography imaging, is used to confirm the positioning of the 3D-printed patient-specific cutting guide (green arrow). After a standard medial approach is performed, (B) the 3D-printed cutting guide is then placed on the proximal tibia (red arrow) and (C) held in place with a guidewire (black arrow).

Intraoperative fluoroscopy is used to confirm the position of the 3-dimensionally printed patient-specific cutting guide. (A) The location of the guidewire (white arrow) on an anteroposterior image of a right knee in compared with (B) the position of the guidewire (green arrow) on the preoperative plan. Once the position is confirmed, (C) the guide is fixed with additional self-drilling, self-tapping unicortical set screws, and a 2.0-mm drill bit (red arrow) is used to predrill the osteotomy through 20-25 holes in the cutting guide. Predrilling in this fashion minimizes the detrimental impact of heat on bone healing, which would have been generated with an oscillating saw and creates a pathway for the osteotome. 38
The osteotomy was then started either with a saw or predrilled and completed with an osteotome. The guide was taken off, and the osteotome was used to complete the osteotomy as needed. Depending on whether a cW or oW osteotomy was being performed, the osteotomy site was either opened or closed. For oW osteotomies, a bone spreader from the patient-specific set was used to open the osteotomy site and then 2 3D-printed validators could be placed in the osteotomy site, 1 anteriorly and 1 posteriorly, to confirm the correct amount of osteotomy site opening (Figure 5).

Intraoperative images of a right knee during a medial opening wedge HTO. Proximal is to the right and distal is to the left. (A) The osteotomy is completed with an osteotome (black arrow). (B) Part of the 3-dimensionally printed patient-specific instrumentation (PSI) guide is removed and a laminar spreader (green solid arrow) is used to open the osteotomy (blue solid arrow). (C) A PSI validator (white arrow) is used to confirm the osteotomy gap. (D) A PSI guide (red arrow) is used to drill for the screws. (E) The final construct includes a custom titanium plate and screws (green dotted arrow) with cellular bone allograft (blue dotted arrow) and preshaped structural allograft bone wedge cut in half and placed posterior and anterior to the plate (purple arrow; Evans Wedge; RTI).
Once the osteotomy site was closed or opened, a custom contoured plate designed for the patient's bony anatomy was then placed and fixed with 1 cortical screw, followed by 3 or 4 locking screws in the proximal segment, and 2 or 3 more locking screws in the distal segment to complete the fixation construct (Figure 6) depending on whether a tibial or a femoral osteotomy was being performed. A 3D-printed drill guide was provided to place the screws in the preoperatively planned trajectory.

(A) Anteroposterior and (B) lateral intraoperative fluoroscopic images of a right knee demonstrate a medial opening wedge high tibial osteotomy. This osteotomy has been fixed with a patient-specific custom titanium plate (red arrows), one 4.5-mm cortical screw and two 4.5-mm locking screws distally and three 6.5-mm cancellous screws proximally.
Clinical Outcome Measurements
Preoperatively and postoperatively at ≥2 years, PROs were collected, including the International Knee Documentation Committee (IKDC) Subjective Knee Form, 12-item Short Form Health Survey Physical Component Summary and Mental Component Summary (SF-12 PCS and MCS), Western Ontario and McMaster Universities Osteoarthritis Index (WOMAC), including the subscales of Stiffness, Pain, Physical Function (PF), and total scores, the Lysholm score, Tegner activity scale, and subjective satisfaction (1-10 scale, with 10 indicating maximal satisfaction). Finally, the rates of revision surgery were recorded. Survivorship was defined as patients who did not undergo revision osteotomy or arthroplasty.
Statistical Analysis and Power Analysis
Descriptive statistics were calculated for all continuous variables, and frequency counts and percentages were determined for categorical variables. Intraclass correlation coefficients (ICCs) were calculated to determine interobserver reliability for radiographic measurements. To qualify the ICC, the following commonly used guidelines were set: 0.0 to 0.2, slight agreement; 0.21 to 0.40, fair agreement; 0.41 to 0.60, moderate agreement; 0.61 to 0.80, substantial agreement; and 0.81 to 1.00, almost perfect agreement. 27 A paired t test was used to evaluate for differences in PROs from pre- to postoperatively followed by a Bonferroni-corrected P value to adjust for multiple comparisons. Pearson correlation coefficient (r) was used to analyze correlations between demographic variables and injury characteristics and outcomes. The Shapiro-Wilk test was used to determine if continuous variables were normally distributed or not, and the appropriate nonparametric test was used in cases where variables were not normally distributed, specifically the Wilcoxon rank-sum test in place of the paired t test, Mann-Whitney U test in place of an independent t test, and Spearman rho coefficient in place of Pearson correlation coefficient.
To analyze correction accuracy, the mean differences between the planned final mMTWr based on the preoperative plan (Figure 7) and the actual final mMTWr on postoperative radiographs as well as the planned change in PTS and the actual measured change were calculated. The authors have shown in a separate study that measurements of mMTWr have an ICC of 0.99 with measurements of mMTWr on 3D CT and that the 2 measurements are comparable. 21 To further analyze acceptable correction, the percentages of patients within 10% of the planned mMTWr were calculated to determine the percentage of patients who had accurate coronal corrections. Within 10% of the desired mechanical axis correction corresponds to within 2° of the desired correction in prior literature. 2 To analyze sagittal correction accuracy, the percentages of patients whose PTS corrections were within 3° of the planned correction were calculated to determine the percentage of patients who had acceptable sagittal corrections. In prior literature on slope correction in PSI, there are not established thresholds for acceptable correction but mean differences from planned correction of tibial slope ranged from around 1.4° to 3.1° for oW and cW HTOs; thus, we chose 3° as an acceptable threshold in this cohort. 41 In the absence of a gold standard threshold for accuracy of correction, these parameters were set to be consistent with prior studies.

In an example of a preoperative plan based on whole-leg 3-dimensional computed tomography imaging, preoperative initial measurements—including the mechanical medial tibial width ratio (mMWTR), mechanical tibiofemoral angle (MTFA), joint line convergence angle (JLCA), mechanical axis deviation (MAD), mechanical lateral distal femoral angle (mLDFA), mechanical medial proximal tibial angle (mMPTA), anatomic medial tibial slope angle (aMTsA), and anatomic lateral tibial slope angle (aLTsA)—are shown in the left column. The final planned parameters are shown in the middle column, and the difference between the 2 values is shown in the delta column on the right. Comparisons were made between the actual and planned postoperative mMTWr (green box) and the actual and planned change in PTS (blue box). This plan was taken from a patient who was indicated for a valgus-producing medial opening wedge high tibial osteotomy, so the plan was to increase the mMWTr from 29.6% to 54.5%.
It is important to note that, rather than comparing the actual postoperative PTS on plain radiograph with the planned postoperative PTS on 3D CT, the planned change in PTS was compared to the actual change in PTS measured on plain lateral radiographs of the knee. This decision was made based on a separate study in which the authors found that PTS on 3D CT is, on average, 1.6° greater than PTS measured on plain lateral radiographs of the knee. 21 While there appear to be differences between the absolute value of PTS measured on radiograph versus 3D CT, which, similar to full-length tibial radiographs, incorporates the full length of the tibia to determine the longitudinal axis,30,33 the change in PTS should be more comparable. Moreover, there are differences in the absolute value of the medial and lateral PTS; however, for osteotomy resulting from chondral meniscal pathology, the planned change in medial and lateral PTS was typically similar, as shown in Figure 7.
Univariate analysis was performed to evaluate for predictors of the change from pre- to postoperative PROs, specifically age, body mass index (BMI), sex, presence of concomitant osteochondral allograft (OCA) or meniscal allograft transplantation (MAT), osteotomy type (HTO or DFO), presence of concomitant Outerbridge grade 3 or 4 patellar or trochlear chondral pathology, and whether patients had an mMTWr >10% from the plan.
An a priori power analysis was performed using G*Power 3.1.9.2 (Heinrich Heine University Düsseldorf) to estimate the sample size necessary to assess a difference in outcome scores from pre- to postoperatively. Based on prior reported pre- and postoperative IDKC scores of 44.6 and 69.4 for patients who underwent HTO with an SD of 18.6 and alpha of .05, a total sample size of 20 was calculated to yield a power of 80%. 3
Results
In total, 27 patients (28 knees) underwent HTO or DFO and met all inclusion and exclusion criteria. Details of patient enrollment are shown in Figure 8. Postoperative PROs were able to be obtained from 23 knees (cases, 12 female, 11 male) in 22 patients for a follow-up rate of 82% of knees at mean follow-up of 2.6 ± 0.4 years (range, 2.0-3.5). Postoperative standing whole-leg radiographs were missing for 7 knees (4 oW-HTO, 2 oW-DFO, 1 cW HTO + oW DFO) and were available for 16 cases. One patient subsequently underwent total knee arthroplasty (TKA) and was included in survivorship analysis but excluded from PRO analyses. Complete demographics including details regarding concomitant meniscal and chondral pathology and procedures for the final cohort are shown in Table 1. There were no significant differences in demographics or injury characteristics between patients who did and those who did not respond to the postoperative questionnaire.
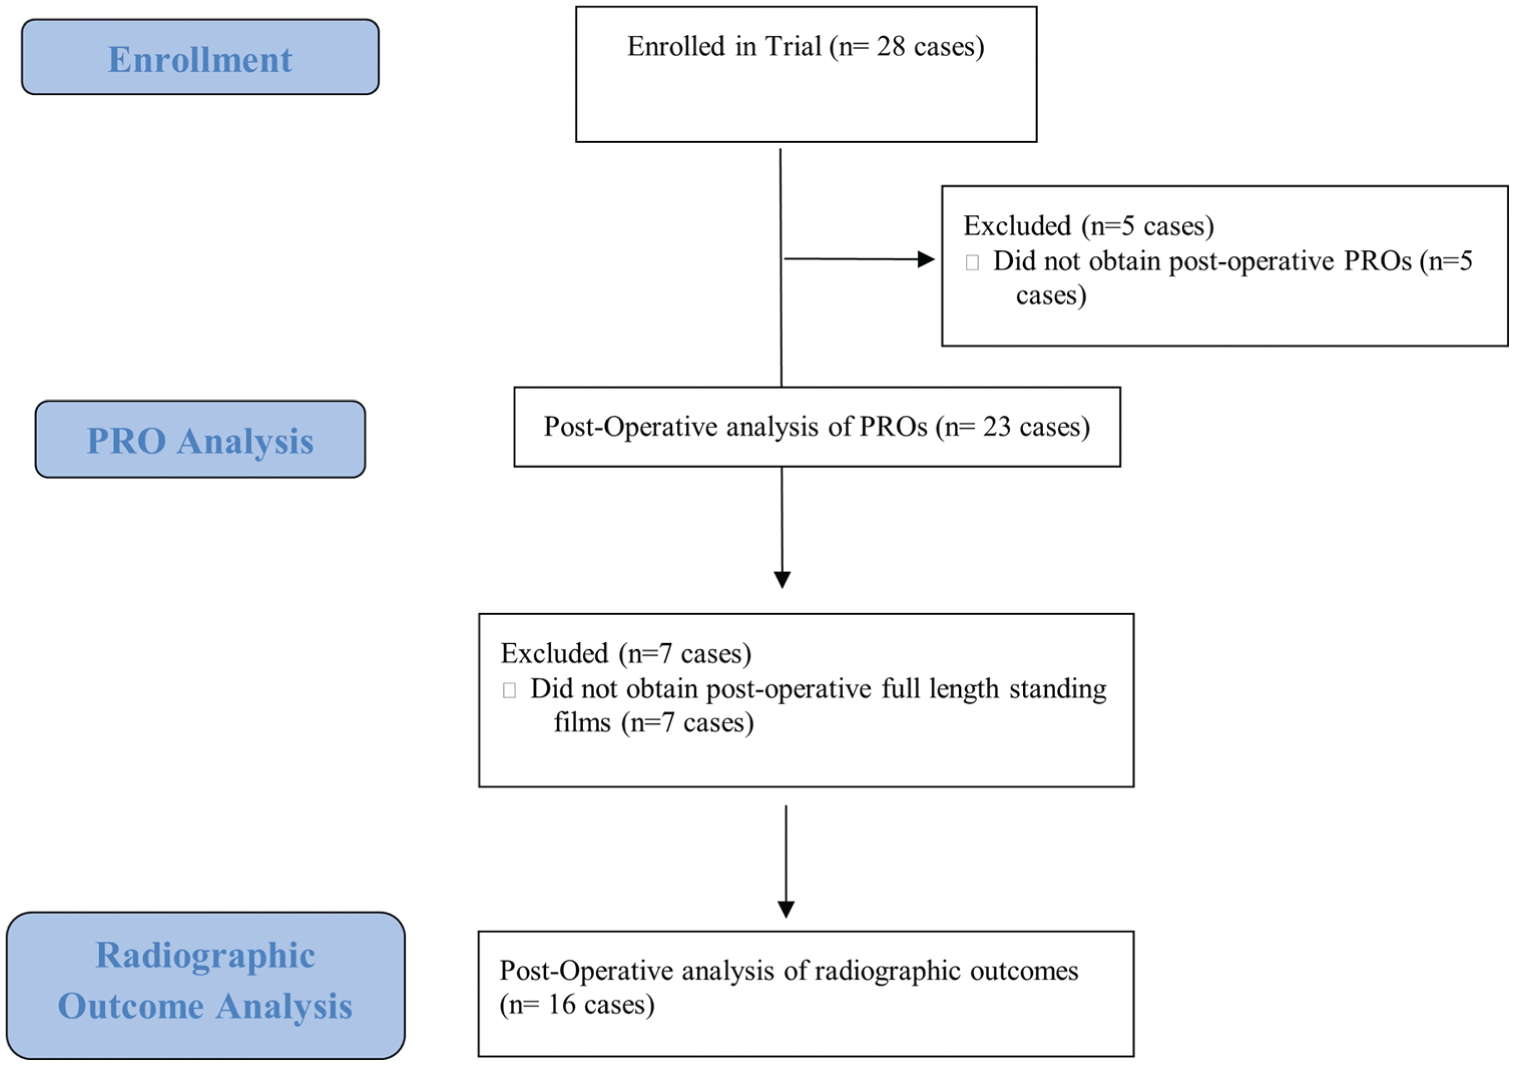
Flowchart demonstrating patient enrollment for the trial and exclusions for analysis. PRO, patient-reported outcome.
Study Demographics (N = 23) a

Data are presented as n (categorical variables) or mean ± SD (range) (continuous variables). BMI, body mass index; cW, closing wedge; DFO, distal femoral osteotomy; HTO, high tibial osteotomy; MAT, meniscal allograft transplantation; oW, opening wedge.
Using a Bonferroni-corrected P value (P < .006), there were significant improvements from pre- to postoperatively in IKDC scores (44.8 vs 75.5; P < .001), Lysholm scores (56.6 vs 81.8; P < .001), WOMAC Pain (6.9 vs 1.5), WOMAC Stiffness (3.4 vs 1.5; P < .001), WOMAC PF (16.7 vs 4.0; P = .001), and WOMAC Total (26.9 vs 7.1; P < .001). There were no significant differences in SF-12 PCS (42.2 vs 49.9; P = .007), SF-12 MCS (48.8 vs 52.8; P = .13), and Tegner activity score (3.8 vs 4.6; P = .09). Clinical outcomes for the cohort are shown in Table 2.
Patient-Reported Outcomes a

Data are presented as mean ± SD. Bold P values denote significance which was set at P < 0.006 based on the Bonferroni correction. IKDC, International Knee Documentation Committee Subjective Knee Form; MCS, Mental Component Summary; N.R. = Not Recorded; PCS, Physical Component Summary; PF, physical function; SF-12, 12-item Short Form Health Survey; WOMAC, Western Ontario and McMaster Universities Osteoarthritis Index.
Satisfaction is based on a 1-10 scale, with 10 indicating maximal satisfaction. Significance was set at P < .006 based on the Bonferroni correction.
The ICCs for pre- and postoperative mMTWr measurements were 0.996 and 0.982, respectively, indicating near perfect agreement. The ICC between the raters’ measurements of mMTWr on whole-leg standing radiographs and the software measurements of mMTWr based on the 3D CT was 0.985. Of the 16 cases with available post-operative whole-leg radiographs, total of 88% (14/16) were within 10% of the planned final mMTWr (Table 3). One patient who underwent staged bilateral medial cW DFO (n = 2) was undercorrected bilaterally. The median difference between the planned and actual mMTWr was 3.7% (25%-75%; IQR, 1.7-9.0). There was no significant association between patient- or surgery-related factors including age, BMI, sex, concomitant procedures, osteotomy type, and whether a patient was within 10% of the planned final mMTWr or not.
Coronal Correction Accuracy by Osteotomy Type a

cW, closing wedge; DFO, distal femoral osteotomy; HTO, high tibial osteotomy; mMTWr, mechanical medial tibial width ratio; oW, opening wedge; IQR, inter quartile range.
The ICCs for pre- and postoperative PTS measurements were 0.715 and 0.791, respectively, indicating substantial agreement. A total of 67% of patients who underwent oW HTO and had postoperative full-length standing films were ≥3° of the planned final PTS; 22% of patients had a final PTS >3° above the planned PTS, and 11% had a PTS 3° lower than the planned PTS. The mean difference between the planned and actual PTS was 2.2°± 2.0°.
Based on univariate analysis, there were no differences in the change in any of the PROs based on age, BMI, sex, presence of concomitant OCA or MAT, osteotomy type (HTO or DFO), presence of concomitant Outerbridge grade 3 or 4 patellar or trochlear chondral pathology, the difference between the planned and actual slope, and the difference between the planned and actual mMTWr.
Complications and Reoperations
With regard to complications, 1 patient had an intraoperative hinge fracture, specifically an intra-articular tibial plateau fracture, which was recognized and treated intraoperatively with open reduction and internal fixation. This patient ultimately developed symptomatic OA and underwent TKA. One patient underwent subsequent arthroscopy and chondroplasty, but a wound complication required a return to the operating room for irrigation and debridement and revision closure. The patient's wound healed uneventfully; however, she subsequently had patellofemoral pain due to a grade 4 patellar chondral lesion present during the index surgery and underwent patellar OCA and revision off-loading tibial tubercle osteotomy. Two patients underwent arthroscopic lysis of adhesions and manipulation under anesthesia, and 1 patient underwent subsequent arthroscopic partial lateral meniscectomy and lateral femoral condylar chondroplasty. Six patients underwent removal of hardware. One patient had an unrelated traumatic ipsilateral femoral neck fracture after a fall from a bicycle 2.5 years postoperatively, which was treated with open reduction and internal fixation. There were no neurovascular injuries.
Excluding patients who underwent removal of hardware, the patient who had a femoral neck fracture, and patients who underwent a planned second surgery (such as a revision ACL reconstruction), 22% (5/23) of cases had ≥1 related, unplanned reoperation. Based on the aforementioned predefined criteria, the total survivorship was 91% (21/23 knees). Excluding the patient who underwent TKA, there was no difference in the final change in PROs between the 4 patients who underwent a related reoperation and the rest of the cohort.
Discussion
The primary finding of this study was that patients undergoing HTOs and DFOs utilizing a 3D PSI system had significant improvements in function and quality of life at short-term follow-up, and this system appears to accurately correct coronal alignment to within 10% of the planned mMTWr in 88% of cases. These findings are important for physicians, as they support the clinical benefits of 3D PSI osteotomy systems for HTOs and DFOs for significantly improving patients’ knee function and quality of life at short-term follow-up.
This study found the following statistically significant improvements in IKDC, Lysholm, WOMAC Pain, Stiffness, PF, and Total score. The prior reported minimal clinically important difference (MCID) values for these PROs are as follows: IKDC, 20 12.5; Lysholm, 7 13; WOMAC Pain, 24 4.2; Stiffness, 24 2.6; PF, 24 16.4; and Total, 24 25.3. Our study observed similar improvements compared with previous literature on HTO for IKDC and Lysholm scores at 30.7 and 25.2 point improvements, respectively, for this current study and 21.2 and 24.9 point improvements for IKDC and Lysholm scores, respectively, for Patel et al. 35 However, it should be noted that in the Patel et al study, patients appear to have started at a lower IKDC and Lysholm value than this current study, which may limit comparison. The improvements observed in this cohort represent not only statistically significant but clinically meaningful differences. The above values provide insight into what patients may perceive as a clinical difference, but they do not provide insight into overall satisfaction or Patient Acceptable Symptom State (PASS), which may provide a better understanding of the true improvement of a patient. Chahal et al 7 established a PASS in addition to MCID in their work, and while this current study did include satisfaction rate, analyzing PASS outcomes for 3D PSI knee osteotomies may be an avenue for future research. Nonetheless, the overall patient satisfaction rate in this cohort was 8.4 out of 10 at the final postoperative visit at minimum of 2 years. This adds to a growing body of literature that corrective osteotomies can significantly improve patients’ quality of life and knee function in the treatment of chondral and meniscal pathologies. As life expectancy and patient expectations continue to rise, there continues to be a role for joint-preserving corrective osteotomies, and this study supports the benefits of these procedures, based on a variety of PROs that evaluate different aspects of patient-reported function and physical as well as mental health, for patients wishing to avoid knee arthroplasty.
With regard to the reliability of the radiographic measurements performed in this study, there was near perfect interrater agreement when evaluating coronal alignment via mMTWr, which strengthens this study's analyses of coronal correction accuracy. Moreover, there was near perfect interrater agreement between the raters’ measurements of coronal alignment on whole-leg standing radiographs and the commercial PSI software measurements that were based on 3D CT, which supports the direct comparison of the final postoperative mMTWr on standing radiographs to the planned mMTWr based on 3D CT. There was only substantial interrater agreement for PTS measurements, which aligns with previous studies that have suggested there are numerous factors that may affect the measurement of PTS and only moderate interrater reliability.10,30,39 Small changes in radiographic assessment have been noted to have significant effects on accuracy of interpretation of PTS such as utilizing a short lateral or full-length lateral of the tibia or measuring from the anatomic or mechanical axis.10,30 And while it has been demonstrated in other work 21 that there is moderate agreement between 3D CT scan semiautomated software measurements of PTS and human raters of plain radiographs, 3D CT semiautomated software measured PTS 1.6° greater than PTS measured on plain lateral radiographs on average. It is possible that different methods of measurement of PTS on radiographs may correlate better with the 3D CT scan semiautomated software used to produce the cutting guides. Thus, the discrepancy between the planned and actual measured change in PTS observed in this cohort may be in part due to consistent measurement variation between 3D CT and plain radiographs as well as differences in radiograph rotation or limb positioning between pre- and postoperative lateral radiographs.
The median difference between the planned and actual mMTWr was 3.7% (25%-75% IQR; 1.7%-9.0%), and only 12% patients had a final mMTWr ≥10% greater than the planned correction, indicating that this technique and system is highly accurate. Nonetheless, there were 2 outliers, and this emphasizes the importance of meticulous surgical technique and abiding by osteotomy principles. In this cohort, the 2 cases of undercorrection occurred in medial cW DFOs, possibly due to an inadequate wedge of bone being removed. It is possible that the oW HTO demonstrated greater accuracy than the cW DFO because of the ability to utilize validators for the oW technique and continue to adjust correction for greater opening distance if needed. This is not possible on an oW osteotomy since the correction is often determined based on the size of the initial wedge that is resected. While the degree of correction accuracy was not correlated with PRO scores, careful surgical technique is important even when using 3D PSI systems to ensure that the planned correction is obtained. The rate of outliers is also similar to prior literature showing approximately 15% of patients deviating from the target correction when utilizing PSI. 6 However, this is substantially lower than the rate of outliers for conventional osteotomy reported in Cerciello et al 6 at around 40%. Other studies on PSI for knee osteotomies have demonstrated a comparably low rate of outliers at 0% to 25% 2 and improved coronal accuracy of correction compared with conventional osteotomy. 5 The outlier rate for sagittal correction was much higher than coronal correction in this study at around 33%. In prior literature, the outlier rate for sagittal correction has been observed at around 5% when utilizing navigation, but this was using a cutoff of 10° within planned correction, which is substantially higher than our 3° cutoff. 17 Our PTS correction accuracy values of 2.2°± 2.0° are very similar to other observed values in PSI osteotomies of 2.3°± 1.1° in the Zindel et al study. 41 It is difficult to ascertain why the sagittal correction demonstrated less overall acceptable correction in this cohort, but it is possible that due to the emphasis on correcting the mechanical axis for the patients in this cohort, preference was given to coronal accuracy, which may inadvertently result in some sagittal inaccuracy. It is possible that if the primary goal was to correct the sagittal plane for a slope increasing or reducing osteotomy, fewer outliers would be seen. Nonetheless, the 3D PSI used in this study appears to follow similar trends of previous literature and may allow for more accurate corrections than conventional osteotomies.
Five patients (22%) experienced ≥1 subsequent related surgery, not including patients who underwent removal of hardware and 1 patient who underwent subsequent TKA. These data may be helpful for physicians to use when counseling patients, as they suggest that although patients can experience significant meaningful improvement after a corrective osteotomy, approximately 1 in 5 patients may need a subsequent surgery such as an arthroscopic chondroplasty or lysis of adhesions; however, the patient will still likely have a favorable outcome.
Multiple prior papers have investigated the use of computer assistance or 3D PSI during corrective osteotomy and have found that these technologies can improve the correction accuracy and decrease surgical time when compared with conventional techniques.2,6 There is significant heterogeneity, however, in how accuracy is assessed, which makes comparisons between studies difficult. While this study did not include a control group to perform a direct comparison, the rates of outliers in this study, 12% of patients with mMTWr differing >10% from the initial plan, compare favorably with previous systematic reviews, which have reported outlier rates of 38% to 40% for conventional osteotomy6,23 and 0% to 25% for osteotomy utilizing 3D PSI. 2
Strengths and Limitations
This study had multiple strengths including acceptable follow-up (82% of cases) of minimum 2-year outcomes, prospective data collection, and evaluation of change in PROs rather than just postoperative PROs, and preoperative CT scans on all patients. While a number of technique papers have been published on the use of a recently released 3D PSI system for corrective osteotomy,14,29 there are limited studies on the outcomes and accuracy in clinical practice of this technique, and this study provides valuable information for surgeons who are considering using this technology.
This study had several limitations. Postoperative CT scans were not obtained on patients, which would likely provide more accurate assessments of postoperative alignment, particularly sagittal alignment, which has been shown to have worse interrater reliability compared with measures of coronal alignment. An attempt was made to address this issue by comparing preoperative with postoperative radiographs to assess sagittal correction.30,33 This study only included patients who underwent osteotomy with a single 3D PSI system, and there was no control group of conventional osteotomies or other PSI systems, so no conclusions can be drawn regarding whether one technique yields better outcomes. The sample size in this study was also small and 7 of the 23 patients included for analysis of PROs did not obtain postoperative full-length radiographs, thus limiting the overall generalizability of the findings. This study only included patients undergoing corrective osteotomy for chondral and meniscal pathology, not pure ligamentous instability such as prevention of recurrence of ACL rupture through correction of knee alignment, and the results cannot be generalized to all patients undergoing corrective HTO or DFO. Additionally, nearly all of the patients in this cohort had concomitant or subsequent procedures in the form of meniscal or cartilage procedures; and it may provide some confounding bias to the improvements seen in these patients when attempting to evaluate purely for improvement from the osteotomies performed.
Conclusion
This study found that patients who underwent corrective HTO or DFO using 3D PSI had significant improvement in PROs, and there was good accuracy of coronal correction, with 88% of patients falling within 10% of the planned final mMTWr and moderate accuracy with 67% of patients falling within 3° of the planned final PTS. These findings demonstrate that osteotomy utilizing 3D PSI can lead to clinically meaningful improvements in patient function with high accuracy of planned correction.
Supplemental Material
sj-tiff-1-ojs-10.1177_23259671251409361 – Supplemental material for Clinical Outcomes and Accuracy of Patient-Specific Instrumentation for Corrective High Tibial and Distal Femoral Osteotomy
Supplemental material, sj-tiff-1-ojs-10.1177_23259671251409361 for Clinical Outcomes and Accuracy of Patient-Specific Instrumentation for Corrective High Tibial and Distal Femoral Osteotomy by Ajay C. Kanakamedala, YuChia Wang, Alexa N. Dietrich, Maximilian Hinz, Richard L. Amendola, Grant J. Dornan, Jonathan McKeeman, Matthew T. Provencher and Armando F. Vidal in Orthopaedic Journal of Sports Medicine
Supplemental Material
sj-tiff-2-ojs-10.1177_23259671251409361 – Supplemental material for Clinical Outcomes and Accuracy of Patient-Specific Instrumentation for Corrective High Tibial and Distal Femoral Osteotomy
Supplemental material, sj-tiff-2-ojs-10.1177_23259671251409361 for Clinical Outcomes and Accuracy of Patient-Specific Instrumentation for Corrective High Tibial and Distal Femoral Osteotomy by Ajay C. Kanakamedala, YuChia Wang, Alexa N. Dietrich, Maximilian Hinz, Richard L. Amendola, Grant J. Dornan, Jonathan McKeeman, Matthew T. Provencher and Armando F. Vidal in Orthopaedic Journal of Sports Medicine
Footnotes
Final revision submitted November 17, 2025; accepted November 19, 2025.
One or more of the authors has declared the following potential conflict of interest or source of funding: M.T.P. is a consultant for Arthrex, Arthrosurface, Anika Therapeutics, and JRF Ortho; receives funding grants from Arthrex, US Department of Defense, and National Institutes of Health; receives travel reimbursement from Arthrex; and is a board or committee member for Arthroscopy Association of North America, American Academy of Orthopaedic Surgeons (AAOS), AOSSM, American Shoulder and Elbow Surgeons, San Diego Shoulder Institute, the Society of Military Orthopaedic Surgeons, and Arthroscopy. A.F.V. is a board or committee member for AAOS and AOSSM; has received research support and consulting fees from Arthrex Inc; receives IP royalties and consulting fees from Stryker; has received speaker fees from Vericel and Smith & Nephew; has received hospitality payments from Bodycad USA; and has received educational support from Gemini Mountain Medical. A.C.K. is a board or committee member for Arthroscopy and has received educational support from Suvon Surgical. R.L.V. is a board or committee member for AOSSM; the American Board of Orthopaedic Surgery; Clinical Journal of Sports Medicine; Foot & Ankle International; and International Society of Arthroscopy, Knee Surgery, and Orthopaedic Sports Medicine; is a paid consultant for Arthrex; is an unpaid consultant for First Ray; owns stock or stock options in Arthrosurface and First Ray; receives IP royalties from Smith & Nephew; and receives publishing royalties and financial or material support from Springer and Wolters Kluwer Health. AOSSM checks author disclosures against the Open Payments Database (OPD). AOSSM has not conducted an independent investigation on the OPD and disclaims any liability or responsibility relating thereto.
References
Supplementary Material
Please find the following supplemental material available below.
For Open Access articles published under a Creative Commons License, all supplemental material carries the same license as the article it is associated with.
For non-Open Access articles published, all supplemental material carries a non-exclusive license, and permission requests for re-use of supplemental material or any part of supplemental material shall be sent directly to the copyright owner as specified in the copyright notice associated with the article.