
Abstract
Background:
In the 2016-2017 National Hockey League (NHL) season, a bye week was introduced to give players rest in the middle of the season. Bye weeks and midseason breaks are a common practice in other sports such as football and soccer.
Purpose:
To compare the rates of different types of injuries, games missed due to injury, and number of multiple injuries by players between previous uninterrupted seasons and the succeeding seasons with bye weeks scheduled.
Study Design:
Descriptive epidemiology study.
Methods:
This study retrospectively looked at NHL injuries from 2000 to 2023. Injured players were identified from publicly available online databases: tsn.ca, cbssports.com, and sportsforecaster.com. Detailed information regarding the number and characteristics of the injuries was categorized according to different types of injuries for each season. Injury rates were compared before and after bye weeks were introduced. To evaluate the effect of bye weeks on injuries, multivariate regression models were used adjusting for position.
Results:
There was a significant difference in overall injury rates per season before and after the implementation of a bye week, from 763.7 to 646.7 injuries (P = .005). Among all players, defensemen saw a significant decrease in proportion of injuries after a bye week was introduced (P < .001). After adjusting for position, there were significantly decreased odds of muscle injuries (OR, 0.26; 95% CI, 0.22-0.29; P < .001), knee injuries (OR, 0.41; 95% CI, 0.35-0.48; P < .001), and arm and shoulder injuries (OR, 0.39; 95% CI, 0.33-0.46; P < .001) sustained by players after the implementation of a bye week. These injuries resulted in a mean of 9.02 games missed before bye week implementation and 10.53 after (P < .001).
Conclusion:
This study showed that the introduction of a bye week in the NHL was associated with lower overall injury rates and reductions in several injury types, indicating a potential relationship between scheduled breaks and observed injury patterns.
In the 2016-2017 National Hockey League (NHL) season, a bye week was introduced for each team to give players rest in the middle of the season. Taking inspiration from the National Football League (which implements bye weeks), European soccer leagues (which have midseason winter breaks), Major League Baseball (4 days off), and the National Basketball Association (1 week off for All-Star break), the NHL gave teams 5-day breaks in which players were not scheduled to practice or play any games. The allocated time off is scheduled to be given in the middle of the season during January and February. Teams are given either the game before or after the All-Star weekend off.
The NHL regular season is long, spanning from October to April and encompassing 82 games per team. Teams can play between 1 and 5 games within 7 days. 1 The more frequent the games are, the less rest players obtain. Studies have found that the less rest players have between games, the higher the risk of injury and severity of injury.1,11 This has been studied in hockey and in other sports such as soccer. 2 While the effects of decreased time between matches has been studied, the effect of dedicated time off has not been studied in professional ice hockey. Winter breaks have been successful in lowering injury incidence rates in professional soccer. 3 It remains to be seen if such breaks will have similar success in the NHL.
The purpose of this study was to compare the injury rates between previous seasons without bye weeks and seasons with bye weeks scheduled. We aimed to compare the rates of different types of injuries, games missed due to injury, and number of multiple injuries sustained by players. We hypothesized that the introduction of a bye week would result in lower overall injury rates for players.
Methods
Information regarding injuries among players in the NHL was obtained from publicly available sports databases including tsn.ca, cbssports.com, and sportsforecaster.com. These databases have been previously utilized in research studies examining NHL injuries, such as orbital injuries.7,9 Demographic and injury history information for hockey athletes is available on these platforms. This study focused on players who played in the NHL between 2000 and 2023. Injury data were compared before and after the NHL introduced a bye week into the schedule in 2016.
The main focus of the study involved comparing overall injuries per season and the proportion of injuries per subcategory of injuries in the 2 study periods. The injury rate was defined as the proportion of injuries among all reported injuries. Games missed and number of multiple injuries by players were assessed as well. “Multiple injuries” was a variable created to include the number of instances of players who sustained another injury after already being injured once in a season. Data are presented with descriptive epidemiological measures such as percentages, means, standard deviations, and odds ratios. Statistical comparisons for continuous variables were conducted using t tests, while chi-square tests were utilized for categorical variables. Logistic regression analysis was used to assess the effect of adding a bye week to each team's schedule on injury occurrences, adjusting for factors such as player position. All statistical analyses were carried out using R (Version 4.1.2; R Foundation for Statistical Computing). For determining statistical significance, a P value <.05 was adopted.
Results
There was a significant difference in overall injuries per season before and after the implementation of a bye week (mean number of injuries: 763.7 vs 646.7; P = .005) (Table 1).
Total Number and Percentage of Injuries Sustained by Position and Team in NHL Players Before and After Implementation of a Bye Week a

Data are presented as n (%) or mean (SD) unless otherwise indicated. Bold P values indicate statistical significance. NHL, National Hockey League; NY, New York.
Among all players, the proportion of injuries sustained by player position changed and defensemen saw the most significant decrease in proportion of injuries after a bye week was introduced, making up 32.8% of injuries (compared with 34.5% injuries before the rule change; P < .001) (Table 1).
When looking at specific injury by categories, most injury subtypes demonstrated significantly lower injury rates. There was a significant decrease in foot and ankle injuries (9.4% vs 4.8%; P < .001), muscle injuries (18.3% vs 5.6%; P < .001), knee injuries (10.8% vs 4.8%; P < .001), head injuries (8.4% vs 6.7%; P < .001), neck injuries (1.6% vs 1.1%; P = .008), eye injuries (1.1% vs 0.4%; P < .001), hand injuries (7.4% vs 5.3%; P < .001), hip injuries (3.0% vs 1.8%; P < .001), organ injuries (1.1% vs 0.8%; P = .046), and arm and shoulder injuries (9.8% vs 4.0%; P < .001) (Table 2). These injuries resulted in a mean of 9.02 games missed before bye week implementation and 10.53 after (P < .001). Two categories had significantly higher proportions of injuries after the bye week: chest and torso (12.4% vs 31.3%) and leg (14.4% vs 31.7%) injuries (Table 2).
Total Number and Percentage of Injuries Sustained in the NHL Before and After Implementation of a Bye Week Categorized by Injury Type (Location) and Games Missed a
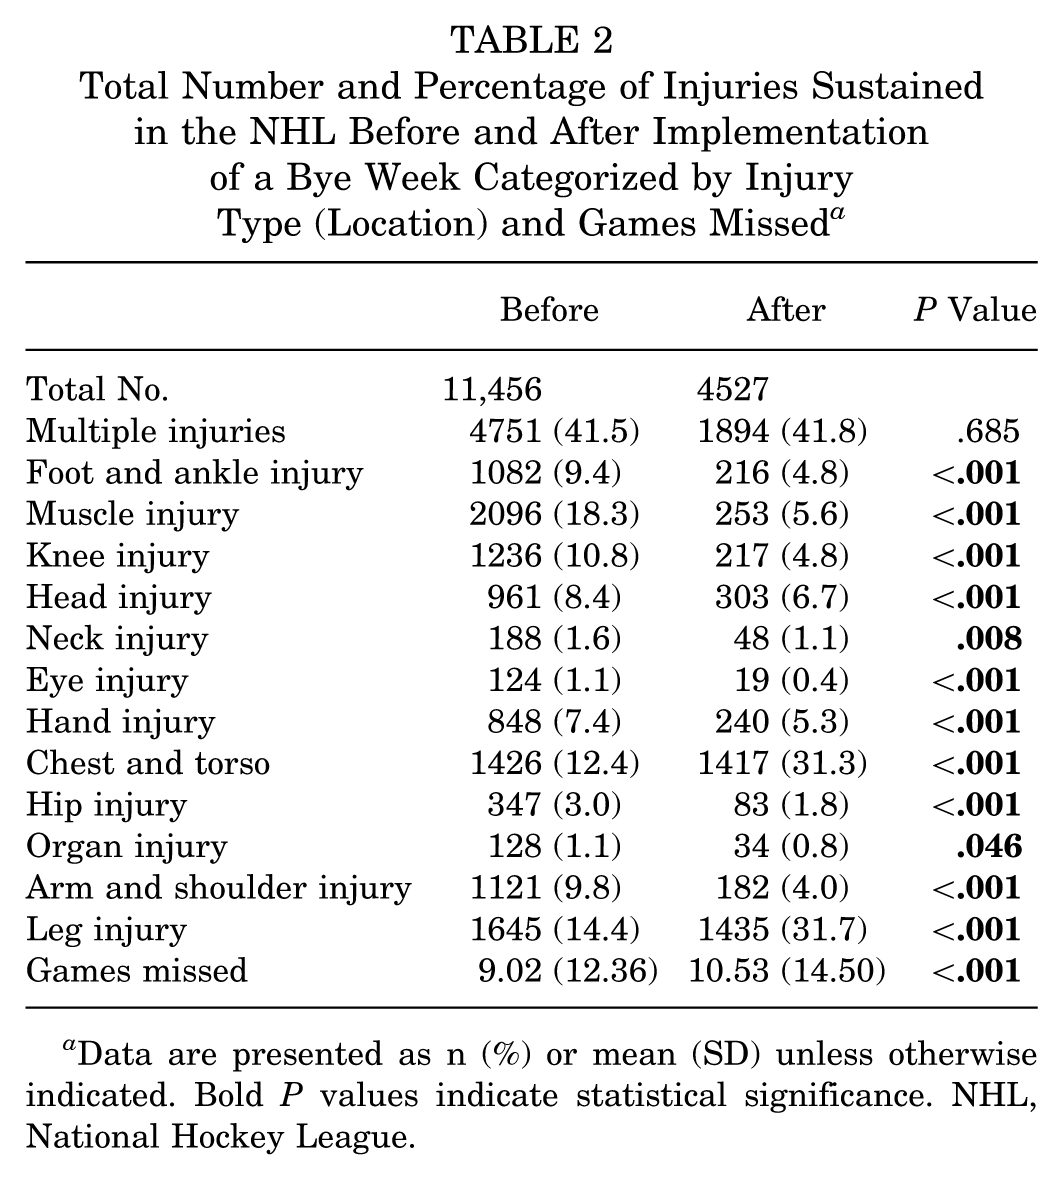
Data are presented as n (%) or mean (SD) unless otherwise indicated. Bold P values indicate statistical significance. NHL, National Hockey League.
Additionally, after adjusting for position through a logistic regression analysis, there were significantly decreased odds of foot and ankle injuries (OR, 0.48; 95% CI, 0.42-0.56; P < .001), muscle injuries (OR, 0.26; 95% CI, 0.22-0.29; P < .001), knee injuries (OR, 0.41; 95% CI, 0.35-0.48; P < .001), head injuries (OR, 0.78; 95% CI, 0.68-0.89; P < .001), neck injuries (OR, 0.64; 95% CI, 0.46-0.87; P = .006), eye injuries (OR, 0.39; 95% CI, 0.23-0.62; P < .001), hand injuries (OR, 0.71; 95% CI, 0.61-0.82; P < .001), hip injuries (OR, 0.59; 95% CI, 0.46-0.75; P < .001), organ injuries (OR, 0.67; 95% CI, 0.45-0.97; P = .038), and arm and shoulder injuries (OR, 0.39; 95% CI, 0.33-0.46; P < .001) (Table 3).
Logistic Regression of Injury Rates After Implementation of a Bye Week a
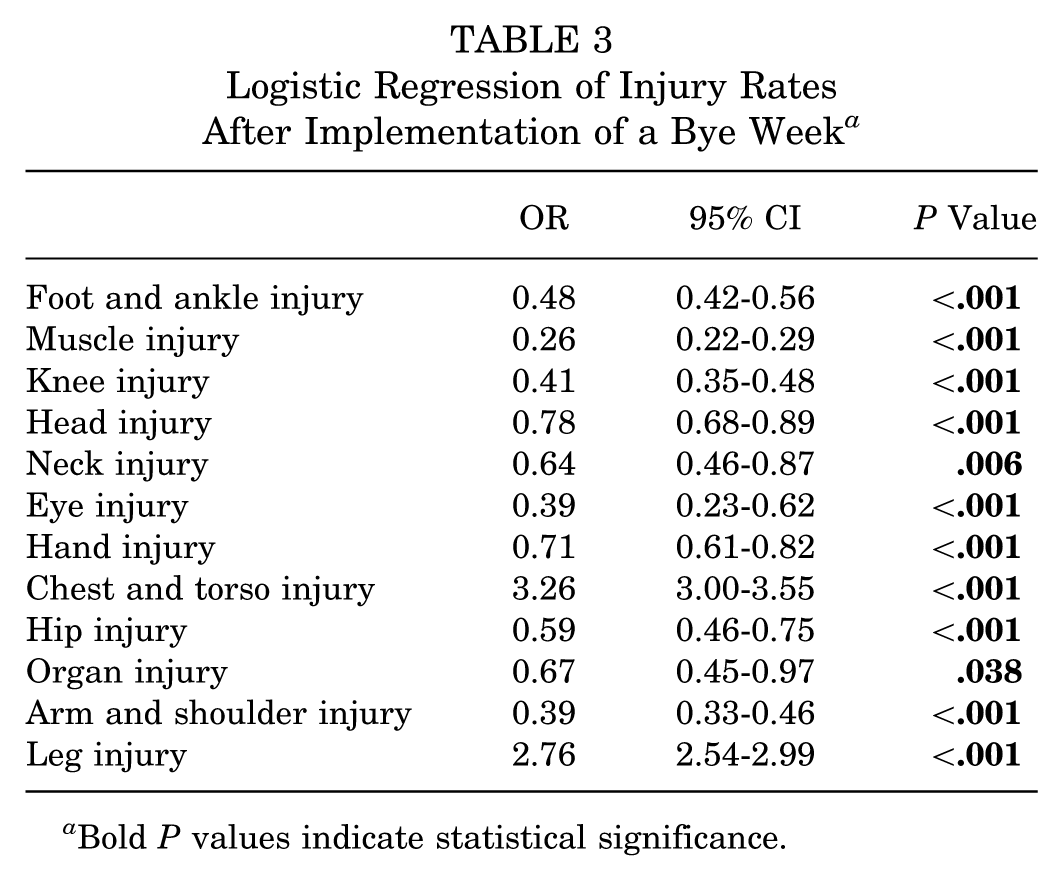
Bold P values indicate statistical significance.
Discussion
In this study, we found that injury rates in the NHL changed significantly after the implementation of a bye week, with the mean number of injuries decreasing from 763.7 to 646.7. Several injury categories showed substantial decreases post–bye week, including foot and ankle (9.4% to 4.8%), muscle (18.3% to 5.6%), knee (10.8% to 4.8%), head (8.4% to 6.7%), hand (7.4% to 5.3%), hip (3.0% to 1.8%), and arm and shoulder (9.8% to 4.0%) injuries. Chest and torso (12.4% to 31.3%) and leg (14.4% to 31.7%) injuries were the only categories that increased. Logistic regression supported these patterns, demonstrating significantly reduced odds of multiple injury types including muscle (OR, 0.26), foot and ankle (OR, 0.48), knee (OR, 0.41), head (OR, 0.78), and arm and shoulder (OR, 0.39) injuries.
Injury rates can possibly be affected by other factors as well. Rule changes, changes in reporting of injuries, player speed/size/strength, equipment changes, training room treatments, and total minutes played for individuals are just a few factors that can affect injury rates. Additionally, while we did not find a reduction in overall injury rates, we did find decreased odds of multiple injuries, muscle injuries, knee injuries, foot and ankle injuries, eye injuries, hand injuries, hip injuries, organ injuries, head injuries, neck injuries, and arm and shoulder injuries. The lack of difference in overall injury rates is due primarily to the 2 outlier categories of chest and torso and leg injuries, which saw significantly more injuries after the bye week, whereas all other categories saw decreases after bye week implementation. The introduction of a bye week in the NHL is correlated with a decreased odds of some injuries compared with seasons without bye weeks.
Notably, the mean number of games missed slightly increased after the implementation of the bye week, although this difference was not statistically significant. The number of games missed naturally varies depending on the type and severity of the injury, and given that NHL teams often play 10 to 15 games per month, a mean of approximately 8 games missed per injury is plausible and aligns with our findings. However, there is limited published data on time missed for all injury types, so available comparisons are largely based on specific injuries rather than comprehensive data sets. Even so, our results are consistent with previous studies reporting a wide range of time lost, from as little as 1.4 days (translating to minimal games missed) for minor lateral ankle sprains to a mean of 8.5 games for hip injuries and up to 45.7 games for major injuries such as Achilles tendon ruptures.4,6,13
Over the past few years, as the game has developed, there have been different methods players have taken to decrease their injury risk besides measures implemented by the league. Younger players in the NHL, especially those <24 years of age and those between the ages of 24 and 28 years, are 5.67 and 2.18 times more likely, respectively, to wear an eye visor compared with older players to protect themselves from eye injuries. 8 Coaches’ attitudes have also changed in the Irish Hockey League (IHL) to emphasize injury prevention over injury management. 12 High-order themes that came up in interviews with coaches were prioritizing player welfare, effectively communicating safety, and identifying risk factors for injury such as increased loads on younger players. 1 While coaches in the NHL may not necessarily share the same viewpoint as coaches in the IHL, it is important to note that the culture surrounding the game is prioritizing safety in certain spheres of the game. Other changes that have mitigated injuries have been the decreased incidence of fighting in the NHL. Fights per game have decreased from a peak of 0.64 fights in 2002 to a low of 0.18 in 2020, which may have had an effect on lowering player injury rates as players less frequently violently altercate. 5 These behavioral and cultural changes in hockey have made the game safer as players and coaches find ways to lower injury risks.
Limitations
This study has limitations that should be considered when drawing conclusions from these results. This study relies on publicly available data that are not as precise as injury information that would be obtained directly from patient charts. Therefore, detailed information regarding injuries is not available. Importantly, the precise timing of the injury within the season is unknown, which limits the ability to accurately evaluate the effect of the bye week and assess whether injury rates changed immediately after the bye week, whether more players returned from injury after the bye week, or whether games missed clustered around that period. A common assumption is that a week of rest may help athletes recover and enhance their resilience for the remainder of the season, particularly for teams aiming to advance to the postseason. Additionally, the absence of information on the cause of injuries, the recovery process, match frequency, player appearances, minutes played by athletes, and injury dates further limits our analysis. Notably, the data set only includes injury data since 2000. Data from seasons before 2000 are unavailable, making the data set incomplete and resulting in an uneven number of seasons before and after the implementation of the bye week. To address this limitation, we compared injuries using proportions rather than absolute numbers. It is also important to note there may be other rule changes that could have played a role in injury rates. Major rule changes during this period included Rule 48 (Illegal Check to the Head, 2010), Rule 9.7 (Mandatory Visors, 2013), and the Hybrid Icing Rule (2013) and could represent significant confounding variables affecting injury trends. Rule changes can lead to enforced safety measures or alternative behaviors, which can also decrease injury rates. This is an additional area for future research. Future research could build on this study by further examining specific injury subcategories to better understand why certain types of injuries changed in frequency while others did not. Despite these limitations, this study provides insights into injury trends before and after the implementation of a bye week and is an important addition to an area of literature that has a low volume of research. Overall, our findings suggest that the effect of a bye week may be more nuanced, influencing specific categories of injuries, with some types of injuries gaining more benefit in added rest than others.
Conclusion
Our study showed that the introduction of a bye week in the NHL was associated with lower overall injury rates and reductions in several injury types, indicating a potential relationship between scheduled breaks and observed injury patterns.
Footnotes
Final revision submitted September 30, 2025; accepted October 31, 2025.
One or more of the authors has declared the following potential conflict of interest or source of funding: J.T.R. has received royalties and consulting fees from Arthrex. C.F. has received publishing royalties and financial support from Springer. AOSSM checks author disclosures against the Open Payments Database (OPD). AOSSM has not conducted an independent investigation on the OPD and disclaims any liability or responsibility relating thereto.
Ethical approval was not sought for the present study.
Data Accessibility Statement
The data that support the findings of this study and the code used for statistical analysis are available from the corresponding author on reasonable request.