
Abstract
Background:
Every 4 years, the Winter Olympics occurs in the middle of the National Hockey League (NHL) season. The NHL allowed its players to participate in the Olympics during the 2002, 2006, 2010, and 2014 editions. The added game load, travel, and intense exertion over a short period of time may increase players’ risk of sustaining injuries.
Purpose:
To compare the injury rates between a normal NHL season and an Olympics-interrupted season and to compare the rates of different types of injuries, games missed due to injury, and the incidence of multiple injuries in NHL players.
Study Design:
Descriptive epidemiology study.
Methods:
The study retrospectively evaluated NHL injuries that occurred between 2000 and 2023. Injured players were identified from publicly available online databases: tsn.ca, capfriendly.com, cbssports.com, and sportsforecaster.com. Information regarding the number and characteristics of the injuries was categorized for each season. Injury rates were compared between Olympic and non-Olympic seasons. To evaluate the effect of the Olympics on injuries, multivariate regression models were used, adjusting for position.
Results:
No significant difference was found in overall injury rates in Olympic years compared with regular NHL seasons (P = .94). The proportion of forwards injured during Olympic seasons increased significantly (P = .041). After adjusting for position, the authors noted significantly increased odds of players sustaining multiple injuries (odds ratio [OR], 1.12; P = .002), knee injuries (OR, 1.71; P < .001), and muscle injuries (OR, 1.65; P < .001) during Olympic years. The mean injury rate was 0.671 in Olympic players compared with 0.905 in non-Olympic players during these seasons (P = .083).
Conclusion:
The study demonstrated no significantly increased rate of injuries overall to NHL players during Olympic seasons compared with regular NHL seasons. However, within Olympic seasons, an increase was noted in certain categories of injuries to players on Olympic rosters versus those who were not. The current findings may help in future discussions for policies on players’ participation in the Olympics and/or to help develop awareness and safeguards from injuries during Olympic years.
The Winter Olympics are traditionally held every 4 years in February, dating back to 1924. The National Hockey League (NHL) has allowed its athletes to participate in all Olympic hockey tournaments since 1998 except for the 2018 and 2022 editions. The NHL was initially reluctant to allow its players to participate in the Olympics due to scheduling conflicts with the NHL regular season but reached an agreement with the International Olympic Committee for the 1998 Games. 7 However, in 2017, citing concerns over player fatigue and schedule disruptions, the NHL temporarily withdrew its permission for players to participate. Nevertheless, the NHL ultimately agreed to allow participation in the 2026 and 2030 Games.5,12
Participation in the Olympics sparked concerns regarding potential adverse effects, including effects on team performance, fatigue, and injury risks.2,3,8,12 Cairney et al found that teams that sent a higher number of players to the Olympics had more goals scored against them in the period after the Games than teams that sent fewer players. 3 Longley et al 8 similarly found that teams with more athletes participating in the Olympics had a lower net goal differential (goals scored - goals against). Forwards who played more minutes during the Olympics appeared to experience greater fatigue, as shown by a decrease in their point production after returning to regular NHL play compared with teammates with fewer Olympic minutes. 2 Smith et al 13 also found that playing more minutes overall was linked to a higher risk of injury, suggesting that the additional ice time from Olympic participation may further increase injury risk for NHL players. Bremer and Cairney’s 2 examination of season-ending injuries among NHL players who participated in the Olympics revealed that 3.1% sustained such injuries during the Games. However, comprehensive studies on injury risks associated with the Olympics are lacking.
The purpose of this study was to compare the injury rates between normal NHL seasons and seasons in which NHL players participated in the Olympics, in order to analyze the possible effect that the Olympics had on athletes and to help guide future decisions regarding NHL player involvement in the Olympics. We aimed to compare the rates of different types of injuries, games missed, and multiple injuries in all injured players between the 2 types of seasons. We hypothesized that during seasons the same year as the Olympics, increases would be seen in players participating in the Olympics, muscle injuries, games missed, and multiple injuries.
Methods
Data on athlete injuries and demographic characteristics in the NHL were gathered from publicly accessible sports and professional databases that track news and updates, scores, statistics, and injuries, including tsn.ca (The Sports Network), capfriendly.com, cbssports.com, and sportsforecaster.com. These databases, used in previous research studies investigating NHL injuries (such as the change in the rate of orbital injuries after equipment requirement alterations), provided demographic and injury history details for hockey athletes.6,9,11 The current study specifically focused on NHL players active between 2000 and 2023. A comparison was made between injury data during Olympic seasons (2002, 2006, 2010, and 2014) and non-Olympic seasons.
Variables assessed included injury rates, games missed, and multiple injuries by players. Injuries were defined as any physical issue that prevented a player playing in at least 1 official game. Situations like personal leave, suspensions, or being left out for nonmedical reasons were not classified as an injury or included in this dataset. “Multiple injuries” was a variable that tracked the incidence of injuries by players who had already been injured once previously in the season. Statistical comparisons for continuous and categorical variables were conducted using t tests and chi-squared tests, respectively. Logistic regression analysis assessed the effect of the Winter Olympics on injury occurrences, adjusting for player position. All statistical analyses were done using R (Version 4.1.2; R Foundation for Statistical Computing). P < .05 was considered to indicate statistical significance.
Results
A mean of 983 injuries per season occurred among all NHL players during Olympic seasons and 987 injuries during non-Olympic seasons (P = .94) (Table 1).
Injuries Sustained by Position in the National Hockey League During Olympic and Non-Olympic Years

P values were not reported for the total number of injuries because these values were drawn from an unequal number of seasons between Olympic (4 seasons) and non-Olympic years (20 seasons).
Statistically significant.
Forwards saw a small but significant increase in proportion of injuries during Olympic years, making up 59.8% of injuries compared with 58.2% injuries in non-Olympic years (P < .041). During Olympic years, a significant increase was seen in multiple injuries by players (P = .002), foot and ankle injuries (P < .001), muscle injuries (P < .001), knee injuries (P < .001), eye injuries (P = .032), hand injuries (P = .016), hip injuries (P = .005), and arm and shoulder injuries (P = .001) (Table 2). These injuries resulted in a mean of 8.23 games missed in non-Olympic years and 7.44 games missed in Olympic years (P < .001).
Injuries Sustained in the National Hockey League During Olympic and Non-Olympic Years Categorized by Type (Location) of Injury, Whether Injury Occurred During the Playoffs, and Games Missed Due to Injury a

Values are expressed as n (%) unless otherwise noted.
P values were not reported for the total number of injuries because these values were drawn from an unequal number of seasons between Olympic (4 seasons) and non-Olympic years (20 seasons).
Statistically significant.
After adjustment for player position, Olympic years were associated with significantly higher odds of several injury types, including multiple injuries by players as well as foot and ankle, muscle, knee, arm and shoulder, hand, eye, and hip injuries (P < .05) (Table 3).
Logistic Regression of the Winter Olympics on a Normal National Hockey League Season

Statistically significant.
We then separated out players who participated in the Olympics compared with those players who did not participate in the Olympics during NHL seasons in which the Olympics occurred. Players who participated in the Olympics had a total of 655 injuries whereas those who did not participate in the Olympics had 3277 injuries during NHL seasons in which the Olympics were played. We found no significant difference in overall injury rate between the 2 groups, with a mean injury rate of 0.671 in Olympic players compared with 0.905 in non-Olympic players during these seasons (P = .083). Non-Olympic players had a mean of 1.486 injuries per year whereas Olympic players had 1.194 injuries per year (P = .18). We noted significantly more injuries in defensemen and goalies who participated in the Olympics compared with their counterparts who did not participate in the Olympics (35.9% vs 32.9%; 8.5% vs 6.4%, respectively; P = .022) (Table 4).
Injuries Sustained by Position in National Hockey League Olympic and Non-Olympic Players in Olympic Years a

Values are expressed as n (%).
P values were not reported for the total number of injuries because these values were drawn from an unequal number of seasons between Olympic (4 seasons) and non-Olympic years (20 seasons).
Statistically significant.
We noted significantly more muscle injuries (P = .04), multiple injuries (P = .026), and chest and torso injuries (P = .028) in non-Olympic players (Table 5). Overall, these injuries resulted in a mean of 7.87 games missed in non-Olympic players and 5.30 games missed in Olympic players (P < .001) (Table 5).
Injuries Sustained in Olympic and Non-Olympic Players in Olympic Years Categorized by Type (Location) of Injury, Whether Injury Occurred During the Playoffs, and Games Missed Due to Injury a

Values are expressed as n (%) unless otherwise noted.
P values were not reported for the total number of injuries because these values were drawn from an unequal number of seasons between Olympic (4 seasons) and non-Olympic years (20 seasons).
Statistically significant.
Olympic players had 1.23 higher odds of having multiple injuries (95% CI, 1.04-1.46; P = .018) and 1.37 higher odds of chest and torso injuries (95% CI, 1.06-1.76; P = .007) but lower odds of foot and ankle injuries (odds ratio [OR], 0.62; 95% CI, 0.43-0.87; P = .007) and arm and shoulder injuries (OR, 0.63; 95% CI, 0.43-0.89; P = .012) (Table 6).
Odds Ratios of Non-Olympic and Olympic Players’ Injuries in Olympic Years
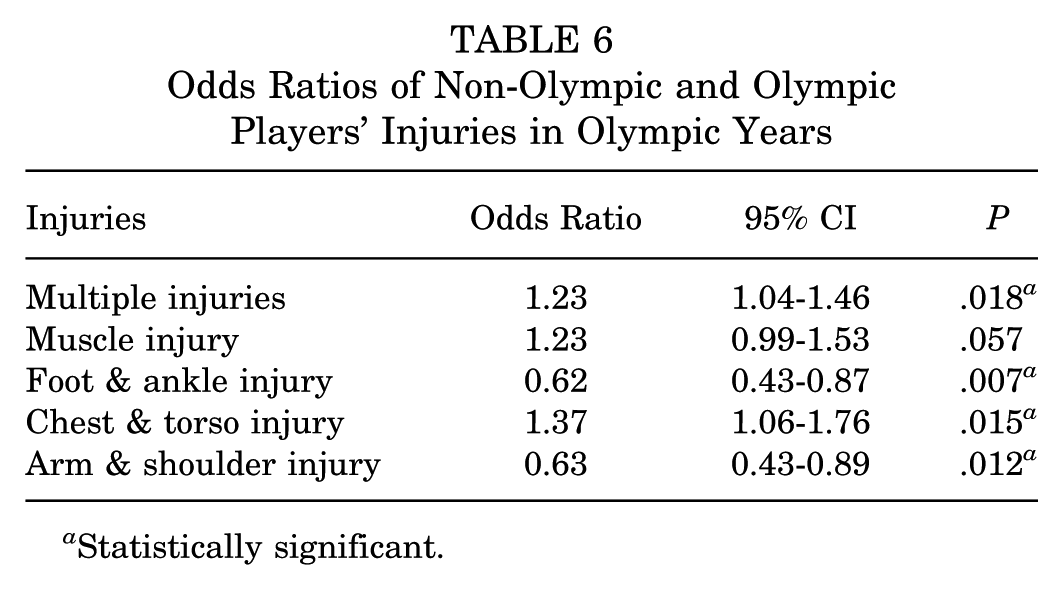
Statistically significant.
When specifically looking at Olympic players during Olympic years and non-Olympic years, we found no significant change in distribution of players injured by position (P = .795) (Table 7).
Injuries Sustained by Position in National Hockey League Olympic Players in Olympic and Non-Olympic Years a
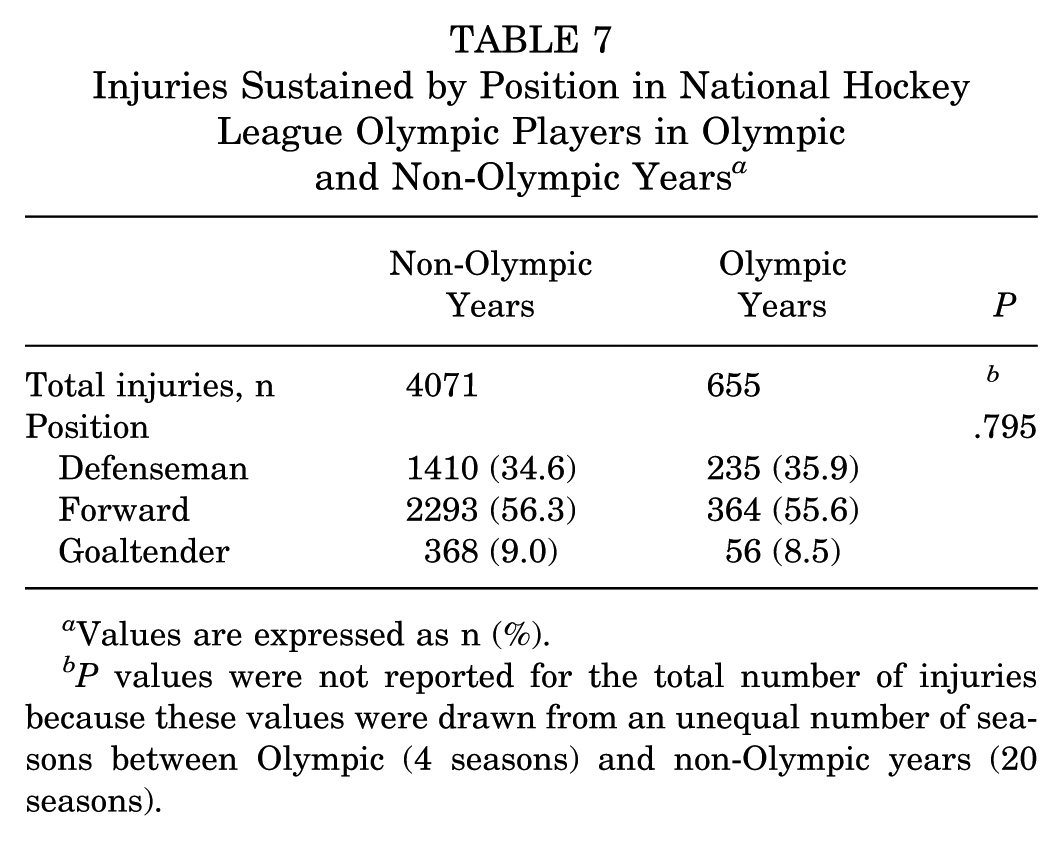
Values are expressed as n (%).
P values were not reported for the total number of injuries because these values were drawn from an unequal number of seasons between Olympic (4 seasons) and non-Olympic years (20 seasons).
However, Olympic players had significantly higher rates of knee injuries and muscle injuries than non-Olympic players (P = .005 and P = .001, respectively) (Tables 8 and 9).
Injuries Sustained in Olympic Players in Non-Olympic and Olympic Years Categorized by Type (Location) of Injury, Whether Injury Occurred During the Playoffs, and Games Missed Due to Injury a

Values are expressed as n (%) unless otherwise noted.
P values were not reported for the total number of injuries because these values were drawn from an unequal number of seasons between Olympic (4 seasons) and non-Olympic years (20 seasons).
Statistically significant.
Odds Ratios of Olympic Players’ Injuries in Olympic Years Versus Non-Olympic Years

Statistically significant.
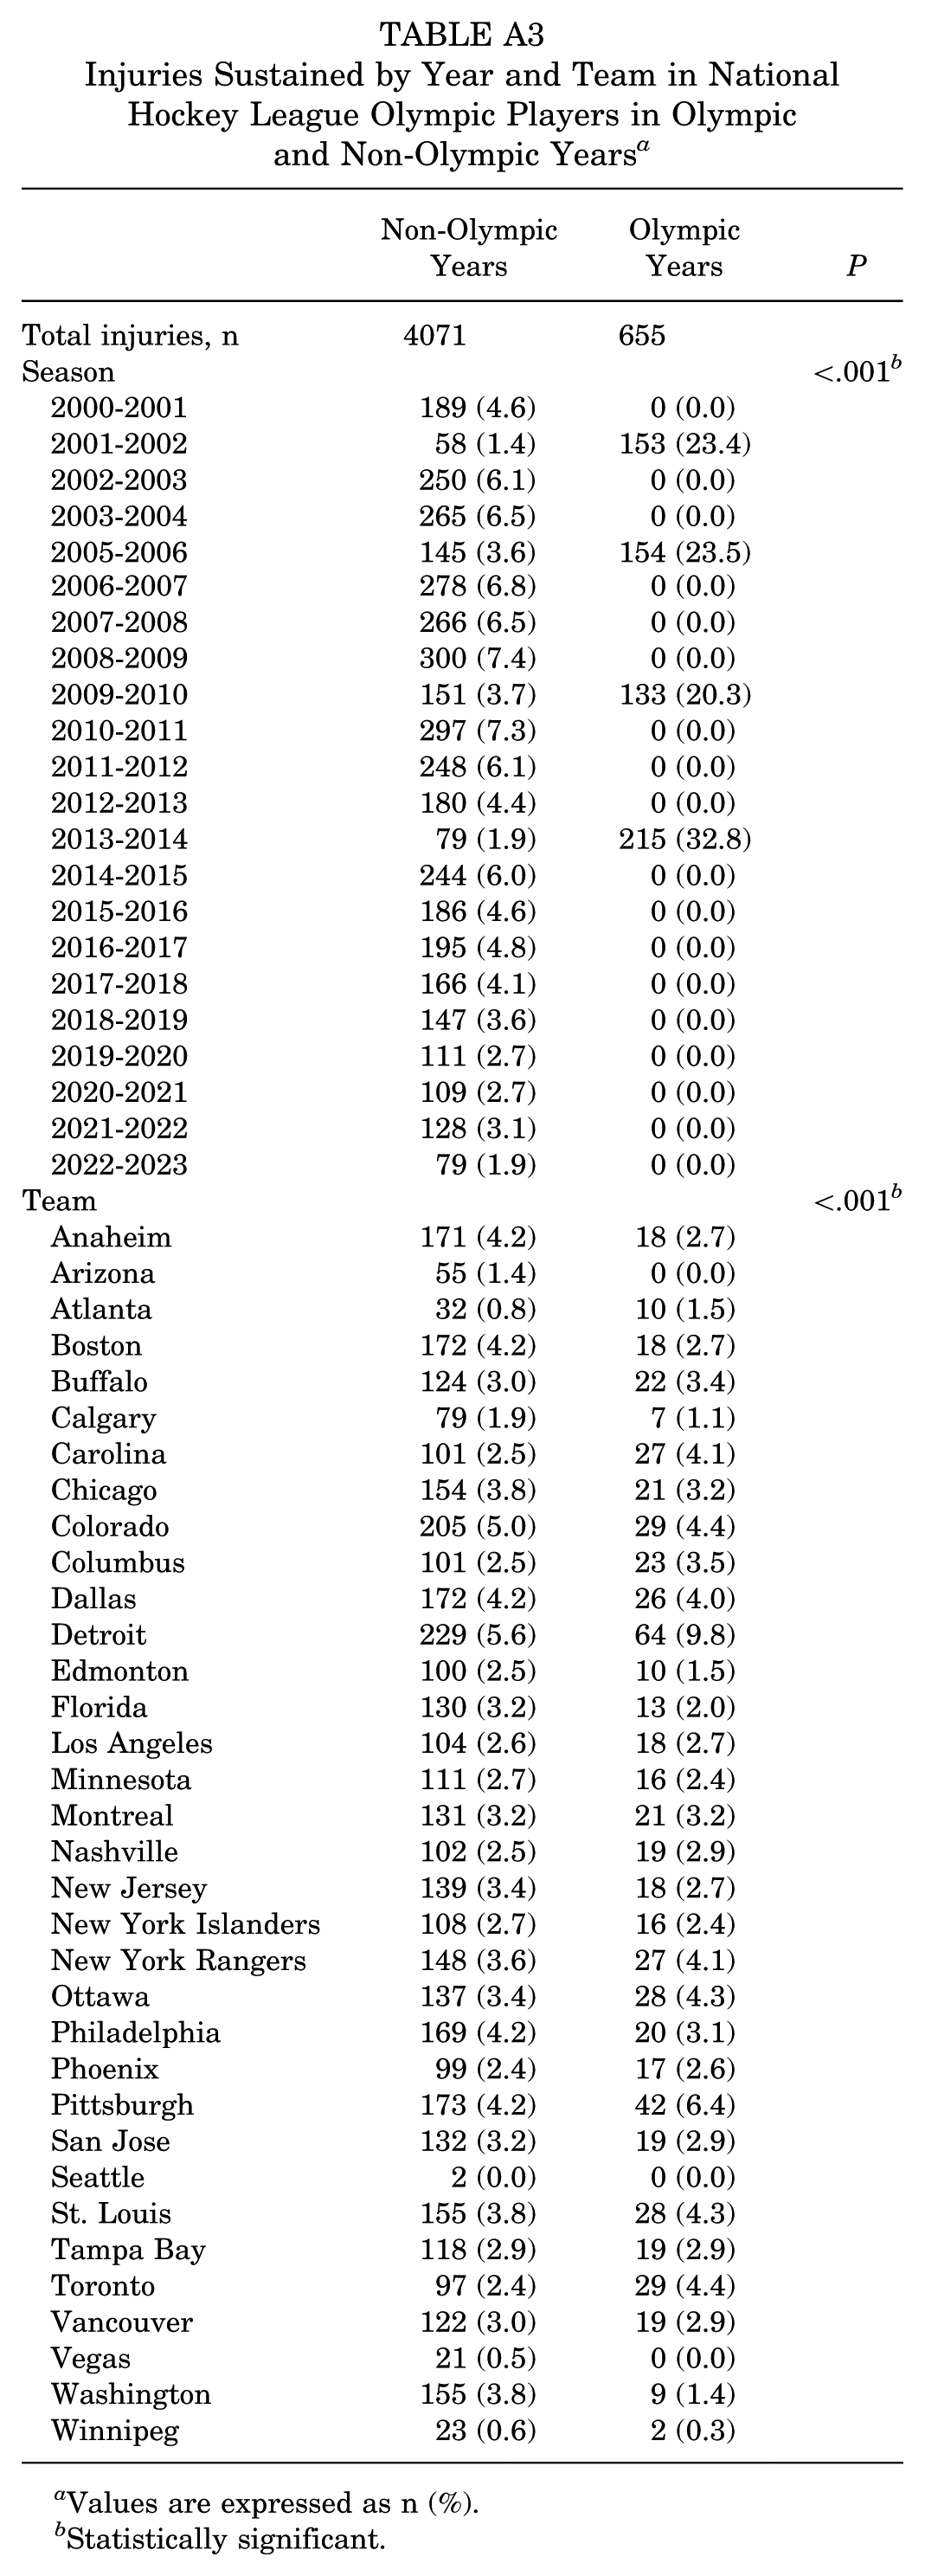
Significant differences were observed in injury distribution by team between Olympic and non-Olympic seasons (P < .001), between Olympic and non-Olympic players within Olympic seasons (P < .001), and by season and team among Olympic players (P < .001), indicating notable variation in injury burden across franchises and seasons related to Olympic participation (AppendixTables A1, A2, A3).
Discussion
The most important finding in this study was that overall injury rates did not significantly increase for NHL players during Olympic seasons, with mean injuries per season nearly identical between Olympic and non-Olympic years (983 vs 986.7, respectively; P = .94) (Table 1). Similarly, no significant difference in injury rates was found between Olympic participants and non-participants, with Olympic players averaging 0.671 injuries and non-Olympic players averaging 0.905 injuries (P = .083) (Table 5) during Olympic seasons. Additionally, non-Olympic players had a mean of 1.486 injuries per year, whereas Olympic players averaged 1.194 injuries per year (P = .18) when we observed all seasons they played. However, despite the overall similarity in injury rates, Olympic participants had significantly higher odds of sustaining specific types of injuries such as multiple injuries (OR, 1.23; 95% CI, 1.04-1.46; P = .018), muscle injuries (P = .040), and chest and torso injuries (P = .028) during Olympic seasons (Tables 5 and 6). Significant positional differences were noted, with a greater proportion of Olympic defensemen and goaltenders sustaining injuries compared with their non-Olympic counterparts (defensemen, 35.9% vs 32.9%; goaltenders, 8.5% vs 6.4%; P = .022) (Table 4).
The Olympics are not the only midseason tournament to affect injury trends in sports. The recent 2022 FIFA World Cup took place in November and December, which is in the middle of the European soccer season. Correlated with the World Cup, a 23% increase in injuries was demonstrated in domestic soccer leagues like the French Ligue 1. 10 The midseason tournament saw an increase in muscle, knee, and ankle injuries. 10 Another tournament that occurs in the middle of European domestic soccer leagues is the African Cup of Nations (AFCON) tournament, commonly held in January and February. Although the effect of this tournament on American soccer leagues has not been studied, Chaabeni et al 4 found the incidence of injuries during the 2021 AFCON tournament to be 1.70 injuries per match, which was greater than the 1.22 and 1.04 injuries per match of the 2017 Gold Cup and 2004 European Championship. Midseason tournaments have been shown to have a higher incidence of injuries than some offseason tournaments that take place after the conclusion of domestic leagues. These midseason tournaments also have been correlated with an increased number of injuries after the league's resumption. 4 Notably, although the 2022 FIFA World Cup led to a break in all domestic leagues, AFCON does not result in such a pause.
Few studies have reported on injuries in ice hockey players in the Olympics. However, the International Olympic Committee's Medical Committee identified ice hockey as one of the Winter Olympic sports with a high injury risk, along with speed skating, alpine skiing, freestyle skiing, and snowboarding. 1 A meta-analysis looked at injuries of the Winter Olympic Games between 2010 and 2023, incorporating 4 Winter Olympics. 14 The investigators found a total of 1304 injuries among the 11,197 athletes. Of those athletes, 1935 athletes were ice hockey players who had a total of 250 injuries (12.9% injury rate), which accounted for the third highest incidence of injuries among Winter Olympic sports. 14 Of these injuries, contusion/hematoma/bruise, sprains, and fractures were the 3 most common injury categories among ice hockey players in the Olympic Games. 14 Although these studies did not look directly at ice hockey players and how injuries affect their playing career, the findings highlight that ice hockey is an inherently dangerous sport and injuries are common during the Winter Olympics.
The current study is not without limitations. It relies on data sourced from public databases which, drawn from injury reports, may lack the precision of formal patient injury charts. Consequently, our dataset may contain inaccuracies due lack of comprehensive details within injury reports. These sources document only those injuries that result in missed games, so injuries that did not lead to absence from competition are likely underreported or excluded, limiting the completeness of the dataset. Additionally, the true number of injuries is not available without access to every injury chart from every team. The absence of detailed information on injury mechanisms, recovery techniques, match frequency, player appearances, minutes played by athletes, and injury dates further limits our analysis. Notably, the dataset includes injury data since 2000, which includes every Olympics in which the NHL has participated except for 1998, making it incomplete. One additional detail to keep in mind when comparing midseason tournaments is that the Olympics take place during a league-wide break in the NHL season, similar to how the 2022 World Cup led to a pause in all domestic soccer leagues, whereas other tournaments like AFCON occur during ongoing league play. This difference may affect injury rates and makes direct comparisons between tournaments less reliable. Nonetheless, despite these limitations, the study remains valuable in assessing the correlation between the Olympic and non-Olympic years on NHL players and providing insights into injury trends. Researchers are encouraged to explore alternative data sources to complement and authenticate these findings.
Conclusion
We found no significantly increased rate of injuries overall to NHL players during Olympic seasons compared with regular NHL seasons. However, within Olympic seasons, there was an increase in certain categories of injuries to players on Olympic rosters versus those who were not. The current findings may help in future discussions for policies on player participation in the Olympics and/or to help develop awareness and safeguards from injuries during Olympic years.
Footnotes
Appendix
Injuries Sustained by Year and Team in National Hockey League Olympic Players in Olympic and Non-Olympic Years a
| Non-Olympic Years | Olympic Years | P | |
|---|---|---|---|
| Total injuries, n | 4071 | 655 | |
| Season | <.001 b | ||
| 2000-2001 | 189 (4.6) | 0 (0.0) | |
| 2001-2002 | 58 (1.4) | 153 (23.4) | |
| 2002-2003 | 250 (6.1) | 0 (0.0) | |
| 2003-2004 | 265 (6.5) | 0 (0.0) | |
| 2005-2006 | 145 (3.6) | 154 (23.5) | |
| 2006-2007 | 278 (6.8) | 0 (0.0) | |
| 2007-2008 | 266 (6.5) | 0 (0.0) | |
| 2008-2009 | 300 (7.4) | 0 (0.0) | |
| 2009-2010 | 151 (3.7) | 133 (20.3) | |
| 2010-2011 | 297 (7.3) | 0 (0.0) | |
| 2011-2012 | 248 (6.1) | 0 (0.0) | |
| 2012-2013 | 180 (4.4) | 0 (0.0) | |
| 2013-2014 | 79 (1.9) | 215 (32.8) | |
| 2014-2015 | 244 (6.0) | 0 (0.0) | |
| 2015-2016 | 186 (4.6) | 0 (0.0) | |
| 2016-2017 | 195 (4.8) | 0 (0.0) | |
| 2017-2018 | 166 (4.1) | 0 (0.0) | |
| 2018-2019 | 147 (3.6) | 0 (0.0) | |
| 2019-2020 | 111 (2.7) | 0 (0.0) | |
| 2020-2021 | 109 (2.7) | 0 (0.0) | |
| 2021-2022 | 128 (3.1) | 0 (0.0) | |
| 2022-2023 | 79 (1.9) | 0 (0.0) | |
| Team | <.001 b | ||
| Anaheim | 171 (4.2) | 18 (2.7) | |
| Arizona | 55 (1.4) | 0 (0.0) | |
| Atlanta | 32 (0.8) | 10 (1.5) | |
| Boston | 172 (4.2) | 18 (2.7) | |
| Buffalo | 124 (3.0) | 22 (3.4) | |
| Calgary | 79 (1.9) | 7 (1.1) | |
| Carolina | 101 (2.5) | 27 (4.1) | |
| Chicago | 154 (3.8) | 21 (3.2) | |
| Colorado | 205 (5.0) | 29 (4.4) | |
| Columbus | 101 (2.5) | 23 (3.5) | |
| Dallas | 172 (4.2) | 26 (4.0) | |
| Detroit | 229 (5.6) | 64 (9.8) | |
| Edmonton | 100 (2.5) | 10 (1.5) | |
| Florida | 130 (3.2) | 13 (2.0) | |
| Los Angeles | 104 (2.6) | 18 (2.7) | |
| Minnesota | 111 (2.7) | 16 (2.4) | |
| Montreal | 131 (3.2) | 21 (3.2) | |
| Nashville | 102 (2.5) | 19 (2.9) | |
| New Jersey | 139 (3.4) | 18 (2.7) | |
| New York Islanders | 108 (2.7) | 16 (2.4) | |
| New York Rangers | 148 (3.6) | 27 (4.1) | |
| Ottawa | 137 (3.4) | 28 (4.3) | |
| Philadelphia | 169 (4.2) | 20 (3.1) | |
| Phoenix | 99 (2.4) | 17 (2.6) | |
| Pittsburgh | 173 (4.2) | 42 (6.4) | |
| San Jose | 132 (3.2) | 19 (2.9) | |
| Seattle | 2 (0.0) | 0 (0.0) | |
| St. Louis | 155 (3.8) | 28 (4.3) | |
| Tampa Bay | 118 (2.9) | 19 (2.9) | |
| Toronto | 97 (2.4) | 29 (4.4) | |
| Vancouver | 122 (3.0) | 19 (2.9) | |
| Vegas | 21 (0.5) | 0 (0.0) | |
| Washington | 155 (3.8) | 9 (1.4) | |
| Winnipeg | 23 (0.6) | 2 (0.3) |
Values are expressed as n (%).
Statistically significant.
Final revision submitted July 9, 2025; accepted August 15, 2025.
One or more of the authors has declared the following potential conflict of interest or source of funding: J.T.R. has received royalties and consulting fees from Arthrex. AOSSM checks author disclosures against the Open Payments Database (OPD). AOSSM has not conducted an independent investigation on the OPD and disclaims any liability or responsibility relating thereto.
Institutional review board (IRB) approval was not required for this study.
Data and Code Availability
The data that support the findings of this study, and the code used for statistical analysis, are available from the corresponding author, upon reasonable request.