
Abstract
Background:
Social determinants of health (SDoH), including education level, are associated with postoperative outcomes and complication rates after orthopaedic surgery.
Purpose:
To evaluate the relationship between patient preoperative educational attainment (PEA) and (1) SDoH demographics, (2) long-term patient-reported outcomes (PROs), and (3) rates of revision surgery and conversion to total hip arthroplasty (THA) after primary hip arthroscopy.
Study Design:
Cohort study; Level of evidence, 3.
Methods:
A retrospective cohort study was conducted of patients who underwent hip arthroscopy at a single institution. Patients ≥18 years old with minimum 8-year follow-up PROs who underwent primary hip arthroscopy for treatment of symptomatic labral tears were included. Patient demographic, radiographic, and intraoperative variables were collected. Patients were divided into 2 PEA cohorts: (1) college education or less (CL) and (2) graduate or doctorate education (GD). PRO measures (PROMs) utilized in this study included modified Harris Hip Score (mHHS), International Hip Outcome Tool-33 (iHOT-33), and the Non-Arthritic Hip Score (NAHS). PROs, pain scores, satisfaction rates, revision rates, and THA conversion rates were compared.
Results:
Overall, 164 patients met inclusion criteria. Both the CL and the GD PEA groups consisted of 82 patients, with mean follow-up of 11.2 ± 2.6 years and 11.1 ± 2.4 years, respectively (P = .34). There were no differences in baseline demographics and radiographic findings between cohorts (P > .05). CL PEA patients resided in more socioeconomically disadvantaged neighborhoods (mean Area Deprivation Index, 23.1 vs 13.9; P < .001) and lived in neighborhoods with worse community-level health literacy estimates (254.4 vs 257.6; P = .03). At minimum 8-year follow-up, GD PEA patients demonstrated higher mean modified Harris Hip Score (mHHS) (89.5 vs 82.8; P = .003) and International Hip Outcome Tool–33 (iHOT-33) (77.5 vs 69.4; P = .04) scores. By multivariate logistic regression, GD PEA patients had greater odds of achieving 10-year Patient Acceptable Symptom State (PASS) for mHHS and the Non-Arthritic Hip Score) compared with CL PEA patients (odds ratio [OR], 3.0; 95% CI, 1.38-6.51; P = .006; OR, 2.4; 95% CI, 1.14-5.22; P = .02). Revision hip arthroscopy and conversion to THA rates were similar between cohorts.
Conclusion:
Our study demonstrates that GD PEA patients have significantly higher PROs and greater odds of reaching the PASS at minimum 8-year follow-up compared with CL PEA patients. Furthermore, lower PEA is associated with greater socioeconomic disadvantage. The data suggest that orthopaedic surgeons may use education-level data as an important clinical decision-making tool to assess for long-term functional outcomes and secondary surgery rates after hip arthroscopy.
Social determinants of health (SDoH), according to the World Health Organization, include a wide range of social environmental conditions in which individuals are born, learn, grow, live, and age that affect a wide range of health and quality-of-life outcomes. 11 The US Department of Health and Human Services defines SDoH in 5 domains: economic stability, education access and quality, health care access and quality, neighborhood and built environment, and social and community context. 9 Recent investigations have revealed the significant effect of SDoH on a patient's physical functioning, mental well-being, health literacy, pain scores, and postoperative outcomes after orthopaedic surgery.3,18,21,24,30 Therefore, it is imperative to identify SDoH that affect patient care to bridge the gap in health disparities and achieve health equity.
Within the education access and quality domain of SDoH, preoperative educational attainment (PEA) has emerged as an important determinant in orthopaedic surgery associated with postoperative functional outcomes, readmission rates, and subsequent surgery rates.18,24,30 Recent studies suggest lower PEA patients who underwent surgery for knee osteoarthritis and long-bone and nonunion fracture had worse functional outcomes compared with their higher PEA counterparts.18,30 Another study found that lower PEA patients, defined by mean educational attainment by zip code, had higher odds of revision arthroscopy and total hip arthroplasty (THA) conversion after hip arthroscopy compared with those living in neighborhoods with higher education levels. 24 However, there are no studies evaluating the effect of patient PEA on long-term functional outcomes and subsequent surgery rates after hip arthroscopy.
Therefore, the purpose of this study was to evaluate the relationship between PEA and (1) SDoH demographics, (2) long-term patient-reported outcomes (PROs) after primary hip arthroscopy, and (3) rates of revision surgery and conversion to THA after primary hip arthroscopy. We hypothesized that lower PEA will be associated with worse socioeconomic status, inferior PRO measure (PROM) scores at long-term follow-up, and lower odds of reaching the Patient Acceptable Symptom State (PASS) compared with higher PEA patients.
Methods
After receiving institutional review board approval, a retrospective cohort study was conducted involving patients who underwent hip arthroscopy at a single institution from 2001 to 2013. Surgeries were performed by a single fellowship-trained orthopaedic surgeon (S.D.M.). Patients ≥18 years old with minimum 8-year follow-up PROs who underwent primary hip arthroscopy for the treatment of symptomatic labral tears secondary to femoroacetabular impingement (FAI) were included in our study. Patients <18 years of age, with a history of ipsilateral hip surgery, moderate to severe osteoarthritis (Tönnis grade >1), hip dysplasia (lateral center-edge angle (LCEA) <20°), or absent PEA-level data were excluded from analysis (Figure 1). PEA data were obtained through a retrospective online survey sent to patients asking for their highest level of education at time of index surgery (grade school, high school, college, or graduate/doctorate degree).

CONSORT (Consolidated Standards of Reporting Trials) flowchart detailing patient selection criteria. CL, college or less; GD, graduate or doctorate; LCEA, lateral center-edge angle; PEA, preoperative educational attainment; PROM, patient-reported outcome measure.
Patients were divided into 2 cohorts based on their PEA. Patients with college or less (CL) level of education before hip arthroscopy were categorized into the “CL PEA group.” Patients with a graduate or doctorate (GD) school level of education before hip arthroscopy were categorized into the “GD PEA group.”
Demographic factors including race, sex, age, length of follow-up, and body mass index were collected. Radiographic measurements and intraoperative findings including Tönnis grade (0 and 1), Beck classification of labral damage (0, 1, 2, 3, and 4), LCEA, traction time, type of additional chondral treatment (microfracture or none), labral tear size, FAI treatment (none, acetabuloplasty, femoroplasty, or femoroacetabular osteoplasty), and labral treatment (repair or debridement) were collected.
Socioeconomic status (SES) factors including income level (≥$250,000, >$150,000-$249,000, >$100,000-$150,000, $50,000-$100,000, and <$50,000) and insurance status (private/commercial, uninsured/out-of-pocket, Medicare, Medicaid) were collected as well.
Furthermore, Area Deprivation Index (ADI), a method of ranking neighborhoods by socioeconomic disadvantage by accounting for 17 factors from the 2022 US Census, was calculated using patient residential addresses (Figure 2). 17 The online tool was developed by the US Department of Health and Human Services and validated to the census block group level. A census block group is the smallest geographical unit (neighborhood level) that is established by the US Census Bureau. Domains accounted for in ADI calculation included income, education, housing, and household characteristics. ADI scores were ranked in the United States on a scale from lowest to highest (0 to 100), with higher scores indicating greater neighborhood-level disadvantage.

US neighborhood disadvantage level in 2022, measured in Area Deprivation Index (ADI) deciles. 20
In addition, health literacy (HL) scores were calculated using a validated scoring system developed at the University of North Carolina that uses information from the National Assessment of Adult Literacy and US Census to estimate community-level HL by census block group (Figure 3). 19 The scores ranged from lowest to highest (177-280), with higher scores indicating a higher level of HL. The scores were categorized into 4 even quartiles based on the range of scores for the entire United States (Q1, ≤235; Q2, 236-247; Q3, 248-254; Q4, ≥255). HL scores were calculated using each patient's residential address.
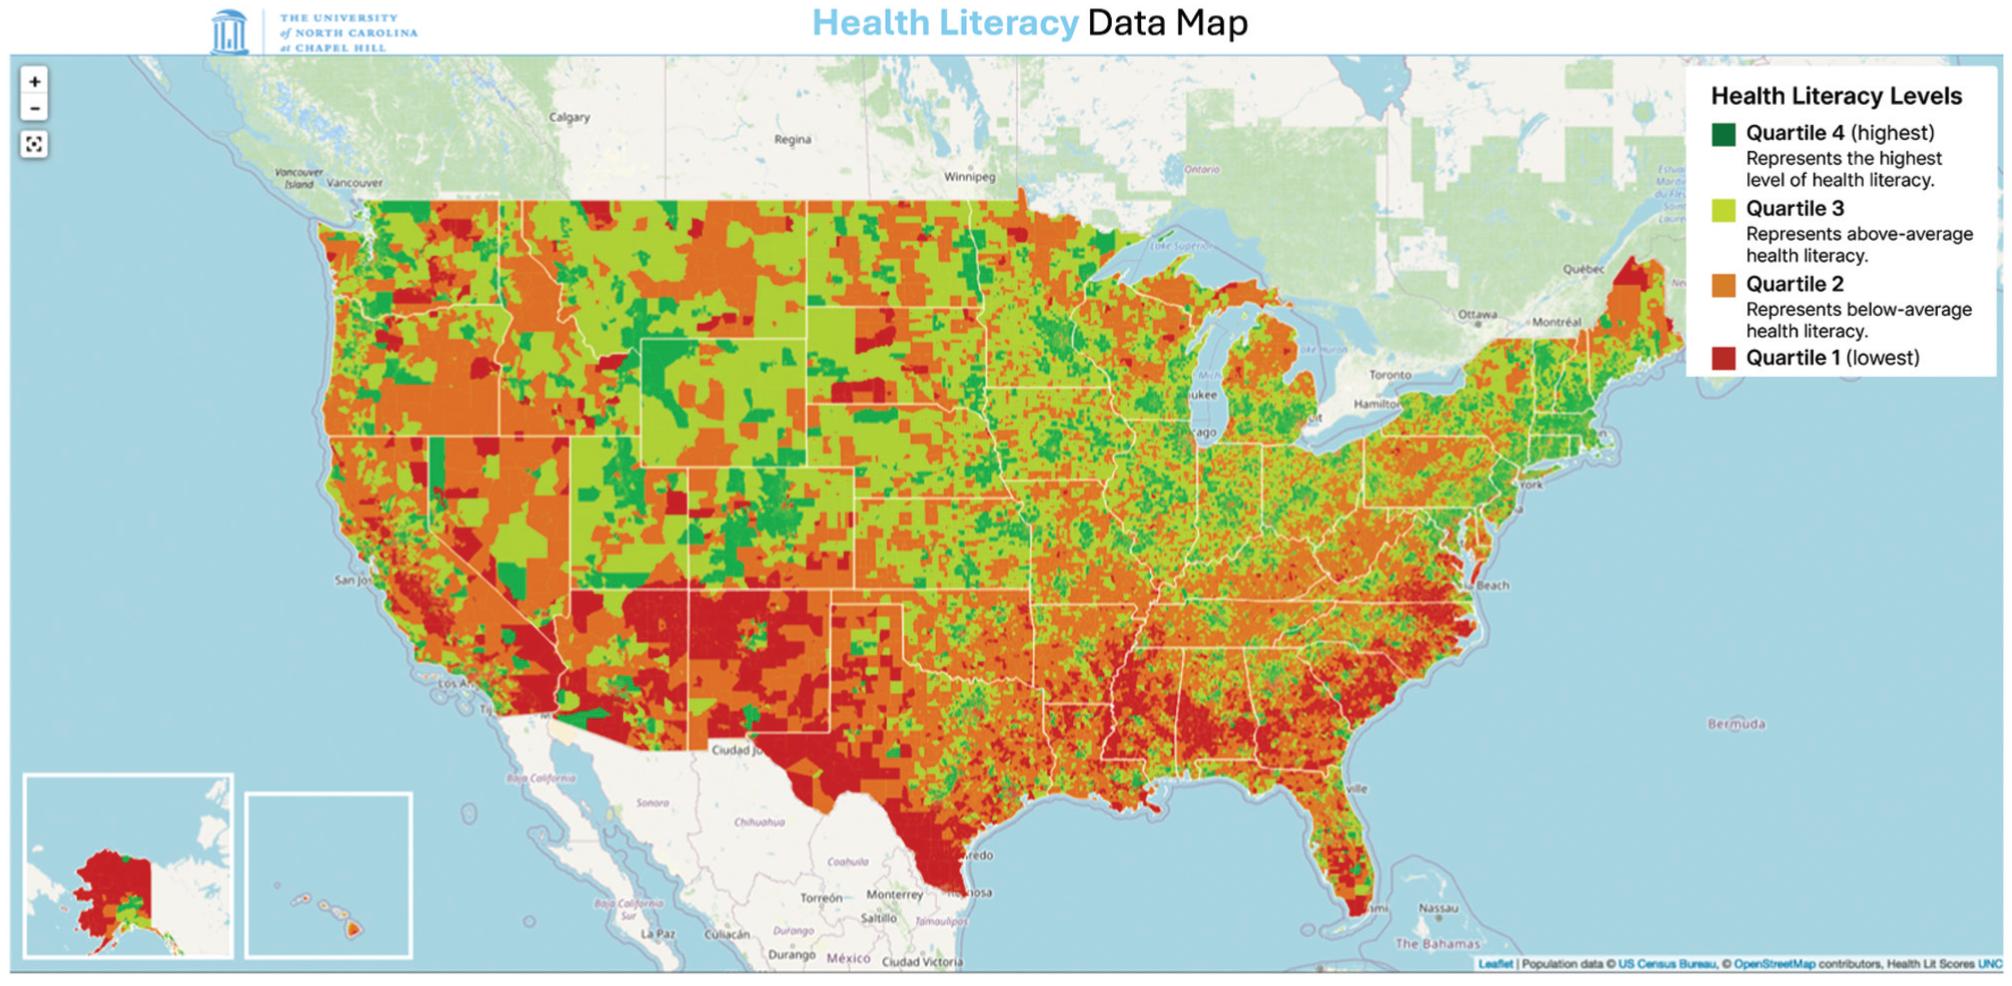
University of North Carolina health literacy index map, measured in quartiles. 23
Through the US Health Resources and Services Administration database, we also identified patients in each cohort who were from a health professional shortage area (yes/no), and medically underserved areas (yes/no) using residential addresses. 9
Primary PROMs included the modified Harris Hip Score (mHHS), Non-Arthritic Hip Score (NAHS), and International Hip Outcome Tool–33 (iHOT-33). Secondary outcome measures included conversion to THA, revision, pre- and postoperative pain, PASS achievement, and patient satisfaction rates. The 10-year PASS achievement rates were measured using previously published thresholds: mHHS (76.0), NAHS (83.6), and iHOT-33 (84.6).2,29 We also quantified pain using the visual analog scale (VAS) and patient satisfaction based on responses to “yes/no—are you satisfied with the treatment you were given”; “yes/no—if given the choice in the future, would you choose the same treatment”; and “yes/no—are you satisfied with the regimen you were given.”
Abbreviated Surgical Technique and Postoperative Rehabilitation
Hip arthroscopy was performed on all patients in our study using the senior surgeon's (S.D.M.) puncture capsulotomy technique to gain intra-articular access to the hip joint.4,7,8 Postoperatively, patients followed a previously published 5-step, 6-month rehabilitation protocol. 22
Statistical Analysis
Chi-square tests were used to compare counts between cohorts, while 2-tailed, unpaired Student t tests were used to compare means for demographic and SES factors between low and high PEA patients. To account for any significant differences in demographic factors, radiographic measures, and intraoperative findings between the 2 cohorts, a multivariate logistic regression was used to measure the adjusted odds of reaching 10-year PASS for GD PEA patients compared with CL PEA patients. All results were reported as an odds ratio (OR) with 95% CI. A P value of <.05 was deemed statistically significant. All statistical analyses were performed using SPSS Version 25 (IBM Corp).
Results
A total of 164 patients met inclusion criteria. The CL PEA group consisted of 82 patients (mean ± SD follow-up, 11.2 ± 2.6 years) while the GD PEA group consisted of 82 patients (follow-up, 11.1 ± 2.4 years) (Table 1). There were no significant differences in baseline demographics, radiographic measurements, and intraoperative findings between the 2 cohorts (P > .05 for each). CL PEA patients had a significantly higher mean ADI score (23.1 ± 16.0 vs 13.9 ± 13.6; P < .001), worse mean HL scores (254.4 ± 7.1 vs 257.6 ± 11.3; P = .03), and lower mean income level (P = .006) (Table 2).
Patient Demographics, Intraoperative Findings, and Procedures Performed a

Data are reported as mean ± SD or n (%). BMI, body mass index; CL, college or less; FAI, femoroacetabular impingement; GD, graduate or doctorate; LCEA, lateral center-edge angle; PEA, preoperative educational attainment.
Social Determinants of Health Factors a

Data are reported as mean ± SD or n (%). Bolded P values denote statistical significance (P < .05). CL, college or less; GD, graduate or doctorate; PEA, preoperative educational attainment.
At minimum 8-year follow-up, compared with CL PEA patients, GD PEA patients demonstrated significantly higher scores for PROMs including mHHS (mean ± SD, 89.5 ± 12.9 vs 82.8 ± 15.8; P = .003) and iHOT-33 (77.5 ± 22.0 vs 69.4 ± 25.8; P = .04) (Table 3). The GD PEA cohort also had significantly greater rates of achieving the PASS for mHHS (71% vs 51%; P = .006) and NAHS (70% vs 54%; P = .02) (Table 3).
Minimum 8-Year PROMs and PROM PASS Rates a
Data are reported as mean ± SD or n (%). Bolded P values denote statistical significance (P < .05). CL, college or less; GD, graduate or doctorate; iHOT-33, International Hip Outcome Tool–33; mHHS, modified Harris Hip Score; NAHS, Non-Arthritic Hip Score; PASS, Patient Acceptable Symptom State; PEA, preoperative educational attainment; PROM, patient-reported outcome measure.
Furthermore, multivariate logistic regression, accounting for baseline demographic, radiographic, and intraoperative finding differences, indicated GD PEA patients had significantly greater odds of achieving 10-year PASS for mHHS and NAHS compared with CL PEA patients (OR, 3.0;, 95% CI, 1.38-6.51; P = .006; OR, 2.44; 95% CI, 1.14-5.22; P = .02) (Table 4).
Multivariate Logistic Regression of PASS Achievement a

Bolded P values denote statistical significance (P < .05). BMI, body mass index; CL, college or less; GD, graduate or doctorate; iHOT-33, International Hip Outcome Tool–33; mHHS, modified Harris Hip Score; NAHS, Non-Arthritic Hip Score; OOP/un, out-of-pocket/uninsured; OR, odds ratio; PASS, Patient Acceptable Symptom State; PEA, preoperative educational attainment; ref, reference.
There was no significant difference in pre- and postoperative VAS pain scores between the CL and GD PEA cohort (preoperative VAS, 72.2 ± 20.3 vs 69.4 ± 18.0; P = .35; postoperative VAS, 24.3 ± 23.0 vs 29.0 ± 24.8; P = .22) (Table 5). There were also no significant differences in long-term postoperative patient satisfaction rates (P = .33; P = .52) (Table 5). Furthermore, at minimum 8-year follow-up, there were no significant differences in rates of revision hip arthroscopy (9.8% vs 7.3%; P = .39) or conversion to THA (19.5% vs 18.3%; P = .92) between the CL and GD cohorts (Table 6).
Pain Levels and Satisfaction Rates a
Data are reported as mean ± SD or n (%). Bolded P values denote statistical significance (P < .05). CL, college or less; GD, graduate or doctorate; PEA, preoperative educational attainment; VAS, visual analog scale.
Conversion to THA and Revision Rates a

Data are reported as mean ± SD or n (%). CL, college or less; GD, graduate or doctorate; THA, total hip arthroplasty; PEA, preoperative educational attainment.
Discussion
Although previous studies have examined the association between PEA and midterm readmission rates and functional outcomes after various orthopaedic surgeries, no study has analyzed its association with long-term postoperative functional outcomes and subsequent surgery rates after orthopaedic surgery.3,18,21,24,30 Furthermore, no studies have assessed the relationship between PEA and PROs after hip arthroscopy. The first key finding of the present study is that GD PEA patients had significantly greater PROs scores at minimum 8-year follow-up. Additionally, the present study found that by multivariate logistic regression, GD PEA patients had significantly greater odds of achieving PASS compared with CL PEA patients. Finally, the present study found that CL PEA patients resided in neighborhoods with greater socioeconomic disadvantage, lower HL, and lower income levels. The present study is the first to establish an association between patient PEA level and long-term PROs and secondary surgery rates after hip arthroscopy, suggesting that CL PEA patients undergoing hip arthroscopy experience greater socioeconomic disadvantage and have worse long-term PROs but similar subsequent surgery rates compared with GD PEA patients.
Our study determined that CL PEA is associated with worse long-term functional outcomes compared with GD PEA after hip arthroscopy. After accounting for demographic differences, the multivariate logistic regression held true with our findings that GD PEA patients have significantly greater odds of mHHS and NAHS PROM 10-year PASS achievement compared with CL PEA patients (OR, 3.0, P = .006; OR, 2.4, P = .02). Our findings are in line with several studies that have evaluated the effect of PEA on postoperative outcomes. A study by Kim et al 16 found that lower PEA was an independent predictor for lower 4-year satisfaction rate (mean ± SD, 4.9 ± 2.7 vs 7.1 ± 2.4; P < .05), American Shoulder and Elbow Surgeons (57.8 ± 23.8 vs 90.7 ± 11.2; P < .05), and Simple Shoulder Test (4.4 ± 3.8 vs 9.8 ± 2.3; P < .05) after recurrent rotator cuff repair. Furthermore, a study by Zhou et al 30 found that at 1-year postoperative follow-up after total knee arthroplasty, lower PEA patients had worse American Knee Society scores (P < .05) and worse flexion and extension range of motion (P < .05; P < .05) compared with higher PEA patients. In addition, a study by Kugelman et al 18 found that lower PEA was an independent predictor of worse functional outcomes at mean 2-year follow-up after surgical repair of traumatic nonunion fractures (P = .01).
We found that GD PEA patients lived in neighborhoods with significantly greater HL levels compared with CL PEA patients (mean ± SD, 257.6 ± 11.3 vs 254.4 ± 7.1; P = .03). It has been previously established that there is a strong association between PEA and HL.25,26 Studies have shown patients with low HL have worse postoperative outcomes.6,27 A study by Narayanan et al 23 found that low HL patients undergoing total knee arthroplasty had significantly greater odds of requiring discharge to a rehabilitation facility compared with high HL patients (OR, 1.8; P = .009) compared with those with average HL. Furthermore, patients undergoing orthopaedic surgery with lower HL were found to ask fewer questions and have 20% shorter clinic visits compared with their high HL counterparts. 21 Recent studies have also found that the reading level for online text articles and video patient materials on hip arthroscopy to be at an inappropriately high reading level compared with the recommendations by the National Institutes of Health.1,20 The combination of these factors may have led to a mismatch in postoperative outcome expectations between the physician and the patient. PEA is not a modifiable risk factor at time of surgery. However, it is imperative that surgeons employ educational initiatives during pre- and postoperative visits to ensure that all patients have sufficient understanding of their diagnosis and surgical prognosis.
In addition to PEA, SDoH including income level and neighborhood resource availability may have contributed to worse long-term PROs in the CL PEA cohort. We found that lower PEA patients had lower income levels and resided in neighborhoods with worse social, physical, and economic conditions compared with higher PEA patients. Kugelman et al 18 found that patients with an income level <$50,000 undergoing surgical management of nonunion fractures had significantly worse postoperative functional outcomes (P < .001) and pain scores (P = .002) at mean 2-year follow-up. Furthermore, Khlopas et al 15 found that patients undergoing total knee arthroplasty with greater ADI scores had greater lengths of stay, nonhome discharges, and 90-day readmissions compared with lower ADI score patients. Along with PEA, lower income and greater neighborhood socioeconomic disadvantage may have had a multifactorial effect on patients’ long-term outcomes.
Globally, education level has also been found to be associated with working conditions that require higher physical demand in multiple countries. 5 de Brejj et al 5 found that patients with low educated workers had significantly higher risk of high physical demand and worse physical health. Furthermore, the study found that even after work exit, low educated workers continued to have worse physical health compared with their high educated counterparts. Similarly, GD PEA patients may have had less physically demanding jobs compared with CL PEA patients, leading to less hip strain and better long-term functional outcomes.
Our study found that CL PEA patients underwent revision hip arthroscopy surgery and conversion to THA at similar rates compared with GD PEA patients. Our study also found that there were no significant differences in pain scores and satisfaction rates between the CL and GD PEA cohorts. A 2024 study by Serna et al 24 found that low PEA patients, using patient zip code as a proxy for educational attainment, had significantly greater odds of 2-year revision (OR, 1.42; P = .005) and conversion to THA (OR, 1.58; P = .002) after undergoing hip arthroscopy compared with high PEA patients. There are currently no studies that look at the relationship between PEA and long-term hip arthroscopy secondary surgery rates. The differences in long-term PROs but similarity in secondary surgery rate between the 2 cohorts may be due to fewer CL PEA patients deciding to pursue revision or THA conversion despite lower functional PROs compared with GD PEA patients. With lower income levels and higher ADI scores, CL PEA patients may have had greater barriers to care that would deter them from pursuing surgeries that require a prolonged time away from their family and job compared with GD PEA patients.
Considering medical care accounts for only 20% of the modifiable contributors to healthy outcomes, orthopaedic surgeons and their health care teams must bridge the gap in health disparities for patients experiencing worse SDoH factors (HL, PEA, income, ADI, etc) by prioritizing a multifaceted evidence-based approach. 10 For instance, past studies have shown that patients who attended an organized preoperative education program before total joint arthroplasty had significantly lower postoperative length of stay and greater ambulation distances. 13 Furthermore, patients who attended a preoperative education session before orthopaedic surgery had significantly reduced pain medication usage and increased self-efficacy postoperatively. 12 Another study has shown that patients who had access to and utilized an electronic patient portal (EPP) had lower no-show rates and greater postoperative patient satisfaction. 28 Improving access to electronic health tools such as EPP by having medical staff assist all patients with EPP enrollment and walking them through access to the portal may help bridge the gap in care. Furthermore, a study found that patients after total joint arthroplasty who had greater perceived social support from health care teams had a higher rate of return to work 6 months after surgery. 14 Asking patient-centered questions and working with a multidisciplinary group of mental health professionals to care for patients’ emotional and mental well-being to return to work after surgery may help to bridge the gap in care. As a patients' health care team, our responsibility is to provide the necessary tools and resources to ensure that all patients can achieve equitable orthopaedic outcomes.
Limitations
Our study has several limitations. First, due to the retrospective nature of our study design, our results are inherently susceptible to selection bias. To mitigate this limitation, we collected data from a consecutive cohort of patients with minimum 8-year follow-up. Another limitation of our study is that we did not have preoperative PROM data because of the retrospective collection. While this may have led to inaccuracies, our results consistently demonstrated significantly lower minimum 8-year follow-up PROs and PASS achievement rates in CL PEA patients compared with GD PEA patients. Second, our results may not be generalizable to all populations given that our data are derived from a patient population within an urban hospital in the United States with high SES and low racial diversity that may not be seen in different rural and urban settings. Third, our study inclusion criteria may have led to age being a limiting factor to educational achievement (eg, 18 years old). However, our study included 3 patients who were 18 years old; 2 of these patients were in the CL PEA group while 1 was in the GD PEA group. Last, in addition to high school graduate patients, our study included college educated patients in the lower PEA group. Therefore, our lower PEA group still included patients with what is traditionally understood as a higher education. However, our results found that the GD PEA group patients continued to experience significantly greater PROMs and greater odds of reaching PASS compared with the CL PEA group, showing that great disparities in PROMs exist between CL and GD PEA patients. Future studies may look to perform further subanalysis by dividing patients into several different education levels.
Conclusion
Our study demonstrates that GD PEA patients have significantly higher PROMs and greater odds of reaching PASS at minimum 8-year follow-up compared with CL PEA patients. Furthermore, lower PEA is associated with greater socioeconomic disadvantage. The data suggest orthopaedic surgeons may use education-level data as an important clinical decision-making tool to assess for long-term functional outcomes and secondary surgery rates after hip arthroscopy.
Footnotes
Acknowledgements
The authors thank the Conine Family Fund for Joint Preservation for their continued research support.
Final revision submitted June 27, 2025; accepted August 15, 2025.
The authors declared that there are no conflicts of interest in the authorship and publication of this contribution. AOSSM checks author disclosures against the Open Payments Database (OPD). AOSSM has not conducted an independent investigation on the OPD and disclaims any liability or responsibility relating thereto.
Ethical approval for this study was waived by the Mass General Brigham institutional review board.