
Abstract
Background:
The implementation of the Major League Baseball (MLB) pitch clock in 2023 aimed to shorten game durations and enhance pace of play. However, concerns have been raised regarding its potential effect on pitcher health, particularly related to musculoskeletal and elbow-specific injuries.
Purpose:
To determine if recent MLB pitch clock rule changes have affected total pitch counts, time to first injury, total injury time, pitches per inning, total batters faced, or total musculoskeletal injuries for the 200 highest-volume pitchers across 2 full seasons postimplementation (2023 and 2024) as compared with 2 seasons before the change (2021 and 2022).
Study Design:
Descriptive epidemiology study.
Methods:
Pitching and injury data were collected from the MLB official website for the 2021-2024 seasons. A total of 800 high-volume pitcher-specific seasons were evaluated, representing 290 individual pitchers over the 4 seasons. The 200 highest-volume pitchers by pitch count per season were included. Outcomes included total pitches, batters faced, time to first injury, total injuries, and injury type. Statistical comparisons were made between the preimplementation (2021–2022) and postimplementation (2023–2024) periods via t tests, chi-square tests, and Cox proportional hazards modeling. An injury was defined as a musculoskeletal injury resulting in a player being placed on the injured list or missing at least 15 consecutive days of game time.
Results:
The total number of injuries decreased significantly, from 50.4% in the preimplementation period to 39.3% in the postimplementation period (P = .003), and mean time to first injury increased from 142.8 days to 160.9 days (P < .001). While the number of batters faced rose significantly from 525 to 575 (P < .001), total pitches and pitches per inning remained stable. Although elbow injuries increased in 2024 after declining in 2022 and 2023, the overall rate did not significantly differ from 2021 to 2022.
Conclusion:
The current study shows that after the implementation of the MLB pitch clock, injury rates among high-volume pitchers decreased and time to first injury increased, with no significant rise in elbow injuries. These findings suggest that the pitch clock has not increased short-term injury risk, although ongoing research is needed to assess its long-term effects.
Recent Major League Baseball (MLB) rule changes in pitch clocks and defender positioning were enacted in 2023 to improve hit rates and quicken the pace of professional games. 1 The pitch clock requires pitchers to deliver a pitch within 15 seconds when the bases are empty and within 20 seconds when runners are on base, significantly shorter than the previous mean pitch pace of 22.6 seconds. 18 While this change successfully shortened game durations by a mean 30 minutes, it has raised concerns about its potential effect on player health, particularly pitchers. 3 Pitchers play one of the most physically demanding roles in baseball, performing repetitive, high-intensity motions that place extraordinary stress on their arms.4,16 Consequently, pitchers are more prone to injuries across all body regions as compared with other defensive positions.5,10 For pitchers, these injuries can be career defining, often requiring significant recovery time and occasionally operative procedures. Beyond the physical toll, such injuries can have profound psychological effects on players and significant implications for their teams. Understanding the factors that contribute to pitcher injuries has therefore become a critical topic in MLB, especially given that the effect of recent rule changes on pitcher injuries, total pitch counts, and interpitch recovery has yet to be fully evaluated.
The introduction of the pitch clock has added a new dimension to discussions about injury risk in baseball. A primary concern is whether the allotted recovery time between pitches is sufficient for pitchers to recover adequately. Pitching involves short, intense bouts of activity that rely heavily on the adenosine triphosphate–creatine phosphate energy system. 9 However, this energy system does not fully replenish within the 20-second recovery window mandated by the pitch clock. Shortened recovery intervals may increase muscle fatigue, which, over time, could elevate the risk of overuse injuries—particularly to critical structures such as the shoulder labrum, ulnar collateral ligament (UCL), and flexor tendons.7,12 Furthermore, the pressure to adhere to the pitch clock may disrupt pitchers’ established routines, potentially affecting their mental preparation and altering biomechanics, thereby heightening injury risk.
Several studies have explored the potential effect of the pitch clock on pitcher injuries. Sonne et al 17 used computer simulations to show that shorter pitch clock intervals elevated muscle fatigue, jeopardizing joint stability. Similarly, in a study of 7 intercollegiate pitchers, Yang et al 19 found that 8- and 12-second rest intervals were insufficient, leading to significant muscle inflammation and elevated markers of muscle damage as compared with the 20-second interval. However, early data from the implementation of the pitch clock in Minor League Baseball did not establish a clear relationship between the pitch clock and injury rates. 14
Although one study found no increase in injury rates during the 2023 MLB season, there is a lack of research examining the short- and long-term effects of the pitch clock across multiple seasons. 15 This study aims to determine if recent MLB pitch clock rule changes have affected total pitch counts, time to first injury, total injury time, pitches per inning, total batters faced, or total musculoskeletal injuries for the 200 highest-volume pitchers across 2 full seasons postimplementation (2023 and 2024), as compared with 2 seasons before the change (2021 and 2022). We hypothesize that after the pitch clock rule change, total pitch counts, pitches per inning, and total risk of injury will increase. Furthermore, we hypothesize that time to first injury will shorten and total injury time will be prolonged because of more severe injuries.
Methods
This study analyzed pitching data from the MLB website (mlb.com) for the 2021, 2022, 2023, and 2024 seasons. The data set was stratified by total number of pitches thrown per season, identifying the 200 highest-volume pitchers by total pitch count for each of these years. In addition to pitch counts, performance measures were gathered. Injury event data were extracted from MLB injury reports, including the type of injury, associated surgical procedures, and time spent on the injured list. Injury data were recorded by 2 independent researchers (A.L. and T.I.), and the accuracy was verified by team-based reporting. An injury was defined as a musculoskeletal injury resulting in a player being placed on the injured list or missing at least 15 consecutive days of game time. Injury time was determined by calculating the total amount of time that a player spent on the injured list during the regular season. Time from injury/surgery date until return to play or the end of the regular season was measured for each player. For pitchers without a listed initial date of injury/surgery, the injured list retroactive date was used.
To quantify injury burden, the total number of days missed for injury was calculated by subtracting the injury/surgery date from the return date, providing a comprehensive measure of time away from play. Injury events were classified by anatomic location (eg, shoulder, elbow) and surgical procedures (eg, UCL repair/reconstruction, rotator cuff repair) to allow for subgroup analyses of injury patterns.
Statistical Analysis
Descriptive statistics were used to summarize the baseline characteristics of the 200 highest-volume pitchers. T tests were employed to compare continuous variables between injured and noninjured pitchers, while categorical variables were analyzed by chi-square tests. Injury event rates were further evaluated in relation to pitching performance, with additional stratification by injury type and time off.
Total batters faced, number of pitches, pitches per inning, and days until first injury were summarized with means and 95% confidence intervals and compared across time (pre- vs postimplementation) via a Student t test. Rate of injuries was summarized with frequency and percentage and compared across time by a chi-square test. Time to injury was further analyzed with a Cox proportional hazards model, comparing the 2 groups and adjusting for those who did not sustain an injury.
Statistical significance was set at P < .05. Analyses were conducted in SPSS Version 29.0 (IBM).
Results
A total of 800 high-volume pitcher-specific seasons were evaluated, representing 290 individual pitchers over 4 seasons. This included 250 starting pitchers, 39 relief pitchers, and 1 hybrid (starting/relief pitcher). The mean number of batters faced increased significantly from 525 (95% CI, 507-542) in 2021-2022 to 575 (95% CI, 556-594) in 2023-2024 (P < .001). However, there were no significant differences in the number of pitches thrown or pitches per inning across the 2 periods (P = .095 and P = .734, respectively). The mean time to first injury increased significantly from 142.8 days (95% CI, 135.8-149.7) in 2021-2022 to 160.9 days (95% CI, 154.98-166.81) in 2023-2024 (P < .001). The percentage of injured pitchers decreased significantly, from 50.4% in the preimplementation period to 39.3% in the postimplementation period (P = .003) (Table 1). Specifically, the total number of injuries reported decreased progressively from 131 in 2021 to 113 in 2022 and 95 in 2023, followed by a slight increase to 99 in 2024 (Table 2).
Summary Statistics

Total Number of Injuries by Category a
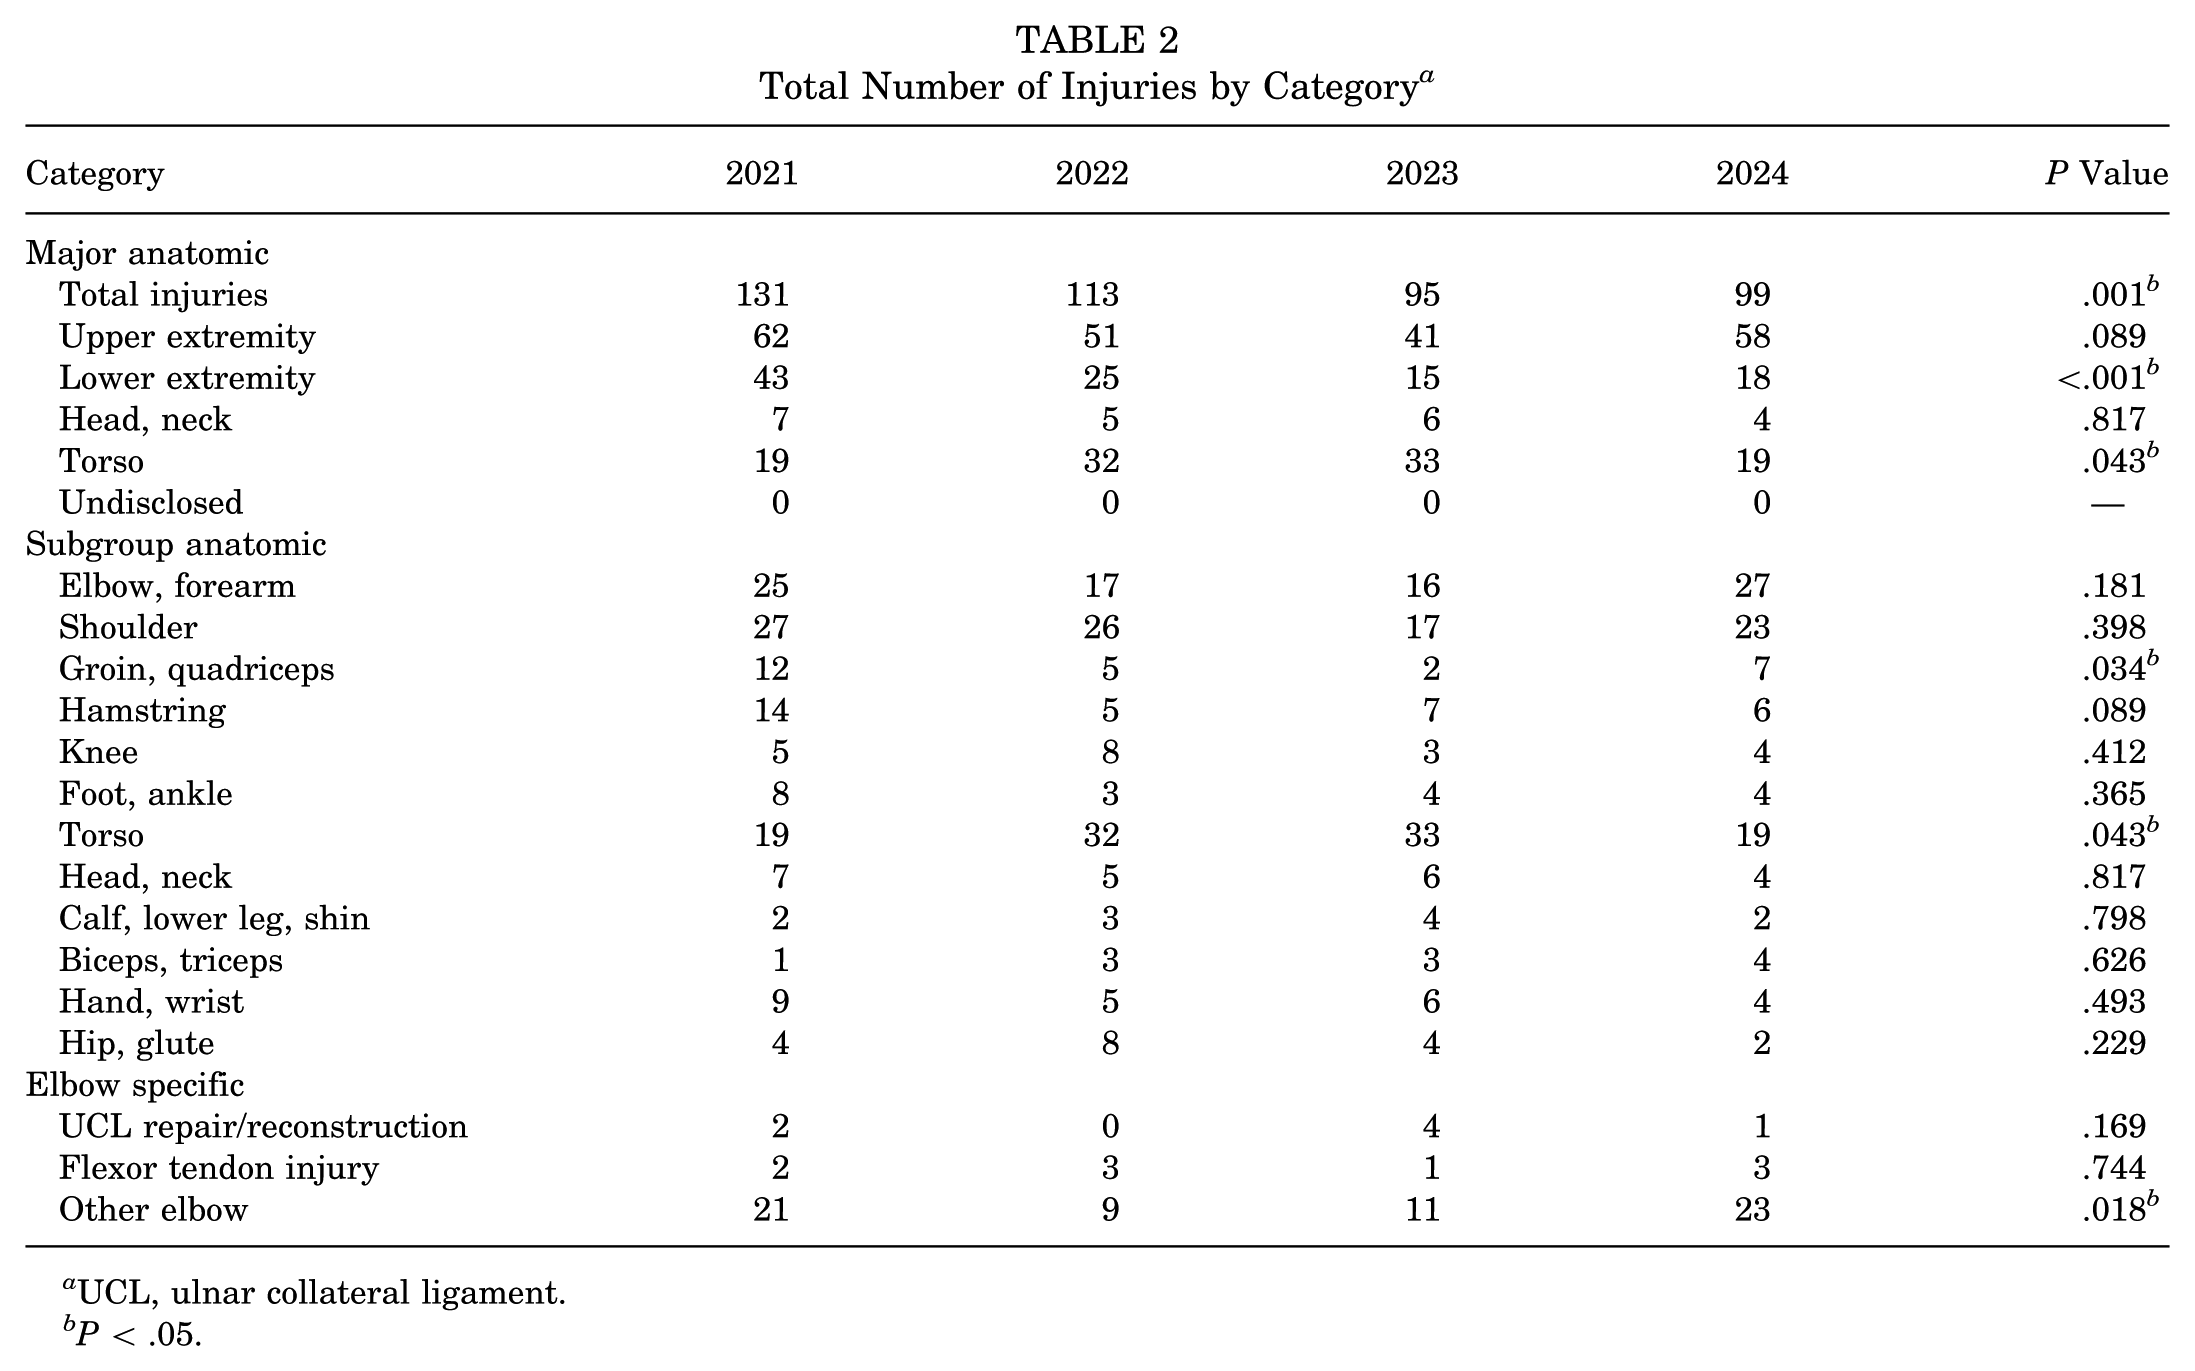
UCL, ulnar collateral ligament.
P < .05.
Major Anatomic Categories
Upper extremity injuries, which represented the majority of injuries, declined from 62 in 2021 to 41 in 2023 but increased to 58 in 2024 (P < .001). Lower extremity injuries exhibited a sharp decline, from 43 in 2021 to 15 in 2023, with a minor increase to 18 in 2024. Injuries to the torso peaked in 2023 with 33 cases, before declining to 19 in 2024 (P = .043). Head and neck injuries remained relatively stable across the study period, with 7 in 2021 and 4 in 2024 (Table 2).
Anatomic Subgroups
A closer examination of anatomic subgroups revealed changes in specific injury types over the study period. Elbow/forearm injuries decreased from 25 in 2021 to 16 in 2023 but rebounded to 27 in 2024. Shoulder injuries remained stable, with a high of 27 in 2021 and 23 in 2024. Groin and quadriceps injuries declined significantly, from 12 in 2021 to 2 in 2023, before increasing to 7 in 2024 (P = .034). Hamstring injuries followed a similar pattern, decreasing from 14 in 2021 to 7 in 2023 and 6 in 2024. Injuries to the hand and wrist and to the calf, lower leg, and shin remained steady, with slight fluctuations over time (Table 2).
Elbow-Specific Injuries
Elbow-specific injuries demonstrated variability during the study period. UCL repair/reconstruction surgery was uncommon, with 2 reported in 2021, none in 2022, 4 in 2023, and 1 in 2024. Flexor tendon injuries remained consistent, with 2 or 3 cases reported annually. Other elbow injuries, such as inflammation, decreased from 21 in 2021 to 9 in 2022, before rising to 23 in 2024 (P = .018) (Table 2).
Survival Analysis
A Cox proportional hazards model indicated that pitchers during the postimplementation period were 31.4% less likely to experience an injury than pitchers in the preimplementation period (hazard ratio, 0.686; 95% CI, 0.553-0.850; P < .001) (Figure 1).

Time to first injury event: survival analysis (before vs after the game clock rule change).
Discussion
The major findings of our study demonstrated that after 2 full seasons with the MLB pitch clock, injury rates among high-volume pitchers decreased and time to first injury increased. Specifically, the percentage of injured pitchers decreased significantly from 50.4% in the preimplementation period to 39.3% in the postimplementation period (P = .003), and the mean time to first injury increased from 142.8 days to 160.9 days (P < .001). We also found a significant increase in the number of batters faced (575 vs 525; P < .001) despite total pitch counts remaining stable (P = .095). These findings suggest that the pitch clock has not elevated the short-term injury risk for pitchers.
Effect on Pitching Workload and Batters Faced
The pitch clock aimed to create a more dynamic pace of play, and our findings suggest that it has achieved this without significantly increasing total pitch counts or pitches per inning. While we hypothesized that total pitch counts would increase after the rule change, the data showed no statistically significant difference (P = .095). Similarly, pitches per inning remained stable (P = .734). However, the mean number of batters faced rose significantly from 525 in 2021-2022 to 575 in 2023-2024 (P < .001). This finding indicates that while pitchers maintained consistent pitch volumes, they encountered more at bats per game, reflecting a faster-paced game. This adaptation likely resulted because pitchers had less time between pitches, requiring greater efficiency and possibly reducing recovery between batters. The long-term effect of more batters faced per season on cumulative fatigue and injury risk warrants further study.
Changes in Musculoskeletal Injury Patterns
Although the number of batters that pitchers faced increased, there was a reduction in injury rates. The mean time to first injury increased, and the proportion of injured pitchers decreased significantly. These findings suggest that the pitch clock may have indirectly reduced injury risks by limiting prolonged periods of inactivity, which may help maintain muscle readiness and reduce the likelihood of acute overuse injuries during games. Puga et al 15 found similar results with a decrease in total pitcher injuries in a first-year analysis. Moreover, independent analysis by a Johns Hopkins study found no evidence that the introduction of the pitch clock has increased injuries. 8
Upper Extremity Injuries and Long-term Trends
The pitch clock's influence on upper extremity injuries, including shoulder and elbow injuries, demonstrated a rebound effect. While the shorter recovery intervals mandated by the pitch clock may reduce lower extremity injuries and acute overuse in the short term, they may also contribute to cumulative strain on the upper extremity over multiple seasons. Elbow-specific injuries showed notable variability, with UCL repair and reconstruction surgery peaking at 4 cases in 2023 and other elbow injuries rising from 9 in 2022 to 23 in 2024. Although these patterns raise concern, it is important to acknowledge that multiple unmeasured factors, such as player-specific training regimens and recovery practices outside of games, may contribute to these trends. These potential confounders should be considered when interpreting causality, and further longitudinal studies are needed to determine whether the accelerated pace exacerbates these injuries.
Importantly, these findings indicate that the pitch clock is unlikely to be the sole cause of arm injuries or overall injury trends among pitchers. A range of additional factors likely contribute to these patterns, including lingering effects from the COVID-19–interrupted 2020 season, which disrupted training and competition schedules. 14 Other critical contributors that merit further investigation include increased pitch velocity and spin rate. Pitchers have increasingly prioritized velocity and spin rate in pursuit of more effective pitches. 13 However, research has shown that this emphasis elevates torque on the elbow, significantly increasing the risk of injury.6,11 Moreover, these trends can be seen in youth workloads and amateur careers, where pitchers face early arm strain. 2 These interconnected factors suggest that pitcher injuries are a multifactorial issue rather than attributable to a single cause.
While this study provides valuable insights, several limitations must be acknowledged. First, our focus on the 200 highest-volume pitchers each season, as defined by total pitch count, may not fully capture the broader effect of the pitch clock on lower-workload or injury-prone pitchers. This methodology inherently excludes players who sustained early-season or severe injuries and were therefore unable to accumulate sufficient pitch counts for inclusion. As a result, our findings likely reflect trends among more durable pitchers and may underestimate the true incidence of high-impact injuries, such as UCL tears requiring repair/reconstruction surgery. We also acknowledge a limitation in our injury definition. While our study included 200 unique pitchers each year, this represents only a subset of all pitchers who pitched per season and limits the generalizability of our findings to the broader pitching population. Moreover, the aggregation of all injury types into a single “total injuries” metric restricts our ability to analyze specific injury mechanisms, anatomic locations, or severities. In addition, we did not control for potentially important confounding variables, such as pitch velocity, pitch type, spin rate, and rest days. Notably, other recent MLB rule changes, such as the 3-batter minimum rule implemented in 2020, may influence pitcher usage patterns, particularly for relievers. Finally, the study spans only 2 postimplementation seasons, limiting our ability to assess long-term effects or adaptation over time. Future studies should aim to incorporate more inclusive pitcher cohorts, disaggregated injury data, biomechanical variables, and longer follow-up to better understand the sustained impact of the pitch clock across the full spectrum of pitcher health and performance.
Conclusion
Our study shows that after the implementation of the MLB pitch clock, injury rates among high-volume pitchers decreased and time to first injury increased, with no significant rise in elbow injuries. These findings suggest that the pitch clock has not increased short-term injury risk, although ongoing research is needed to assess its long-term effects.
Footnotes
Final revision submitted September 24, 2025; accepted October 19, 2025.
One or more of the authors has declared the following potential conflict of interest or source of funding: R.G. is an editorial or governing board member of Arthroscopy and a paid presenter or speaker for ENOVIS and has received other financial or material support from Smith & Nephew. O.E. is a board or committee member of the American Academy of Orthopaedic Surgeons, American Association of Hip and Knee Surgeons, and New York State Society of Orthopaedic Surgeons and holds stock or stock options in Premia Spine. AOSSM checks author disclosures against the Open Payments Database (OPD). AOSSM has not conducted an independent investigation on the OPD and disclaims any liability or responsibility relating thereto.
Ethical approval was not sought for the present study.