
Abstract
Background:
Pitch counts are tightly monitored in Major League Baseball (MLB). Hidden pitches—including warm-up pitches before and between innings and pitches before the starting/relieving pitcher’s appearance in a game—are not as closely monitored.
Purpose/Hypothesis:
To report the number of hidden pitches thrown per game and over the course of a season for a single organization. We hypothesized that players who threw more hidden pitches would be at an increased risk of injury compared with those who threw fewer hidden pitches.
Study Design:
Case-control study; Level of evidence, 3.
Methods:
All pitchers who played for a single MLB organization in the 2021 season were included. Hidden pitches, in-game pitches, and total pitches thrown during all games in the season were recorded. Injuries to these pitchers were also recorded. Players were defined as having an injury if they spent any time on the injured list.
Results:
Overall, 137 pitchers were included, 66 (48%) of whom sustained an injury and were placed on the IL during the 2021 season (mean time on IL, 53.6 ± 45.6 days). Of the 66 players who sustained an injury, 18 (27.3%) sustained an elbow injury, while 12 (18.2%) sustained a shoulder injury. Only 1 player sustained an ulnar collateral ligament tear. When comparing hidden pitches, in-game pitches, and total pitches between pitchers who sustained an injury and those who did not, there were no significant differences between groups (P = .150; P = .830; and P = .377, respectively). On average, hidden pitches made up 45.4% of the total number of pitches thrown during the course of the season. When evaluating the number of hidden pitches as a percentage of the total number of pitches thrown in a season, there was no significant difference between pitchers who sustained an injury and those who did not (P = .654).
Conclusion:
MLB pitchers who sustained an injury did not throw more hidden pitches than those who did not sustain an injury. Larger scale studies are needed to confirm the results of this single-team study.
The number of injuries in Major League Baseball (MLB) pitchers has been on the rise over the past 10 years. 1,4,7 These injuries include everything from oblique strains and ulnar nerve issues to shoulder impingement and ulnar collateral ligament (UCL) tears. 1,8,10,11,13 Many risk factors for injury in baseball pitchers have been identified—including loss of shoulder motion, loss of hip motion, fastball velocity, and fatigue. 2,3,5,14,21,22 One of the major risk factors that has been correlated with injury is pitch count. 6,15,17,18 However, most attention surrounding pitches has involved the pitches that are thrown only during gameplay. While in-game pitches are likely the highest-stress pitches thrown, there are many other pitches that are thrown during a game but are often forgotten about. These pitches are commonly referred to as hidden pitches, as they are not accounted for in the pitch count for the game. 23 These hidden pitches are as follows: those thrown by the starting pitcher before the first live pitch of the game; pitches thrown between innings; pitches thrown after a mound visit for injury; pitches thrown after a rain delay; and itches thrown by relievers who are getting ready to enter a game; and warm-up pitches from the mound by relievers when they enter the game. If pitch counts are indeed a risk for injury, a high volume of hidden pitches may also increase a player’s risk for injury.
The purpose of this study was to report the number of hidden pitches thrown per game and over the course of a single season for a single professional baseball organization and to determine whether hidden pitches correlate with injury risk. We hypothesized that players who threw more hidden pitches during warm-up and between innings would be at an increased risk of injury than pitchers who threw fewer hidden pitches.
Methods
Pitchers were included if they pitched for the Phillies baseball organization during the 2021 season and had their hidden pitches recorded. All pitches thrown by pitchers in a single MLB organization over the course of the 2021 baseball season were recorded by the pitching staff. Pitches were divided into in-game pitches and hidden pitches: in-game pitches included those thrown during the course of the game while the game was in play; and hidden pitches included those that were thrown before the first inning of a game by the starting pitcher, pitches thrown between innings by the pitcher during the course of a game, pitches thrown in the bullpen by any reliever before he entered the game, and warm-up pitches thrown by relievers from the mound when they were about to enter the game. These pitches were counted by the coaching staff. All player data were provided in a deidentified manner by the professional baseball team; therefore, institutional review board approval was not required.
Injuries sustained by these pitchers were tracked over the course of the entire 2021 season. Players who were injured were then compared with players who were not injured, as an injury was related to each category of pitches thrown. Players were defined as having an “injury” if they spent time on the injured list (IL). Days on the IL were also recorded for injured pitchers.
Statistical Analysis
Continuous data are presented as mean ± SD. The number of hidden pitches, in-game pitches, and total pitches were compared between the injured and uninjured players using t tests, and the corresponding P values were considered significant at P < .05.
Results
Overall, 137 pitchers were included in this study, of whom 66 pitchers (48%) sustained an injury and were placed on the IL during the 2021 season. The mean time spent on the IL was 53.6 ± 45.6 days. Of the 66 players who sustained an injury, 18 (27.3%) sustained an elbow injury, 12 (18.2%) a shoulder injury, and 36 (54.5%) an injury to another body part. As such, 30 of the 137 pitchers (21.9%) included in the study sustained an injury to their shoulder or elbow in 2021. With respect to elbow injuries, only 1 player sustained a UCL tear.
The results of the comparison between injured and uninjured pitchers are shown in Table 1. There were no significant differences between the groups when comparing the total number of hidden pitches, in-game pitches, or overall total pitches thrown over the course of the 2021 season.
Comparison of Hidden Pitches, In-Game Pitches, and Total Pitches Between Injured and Uninjured Pitchers During the 2021 Season a

a Values are presented as mean ± SD.
On average, hidden pitches made up 45.4% of the total number of pitches thrown during the course of the season (Table 2). When evaluating the number of hidden pitches as a percentage of the total number of pitches thrown in a season, there was no significant difference between pitchers who sustained an injury and those who did not (Table 2).
Comparison of Hidden Pitches as a Percentage of Total Pitches Between Injured and Uninjured Pitchers During the 2021 Season a
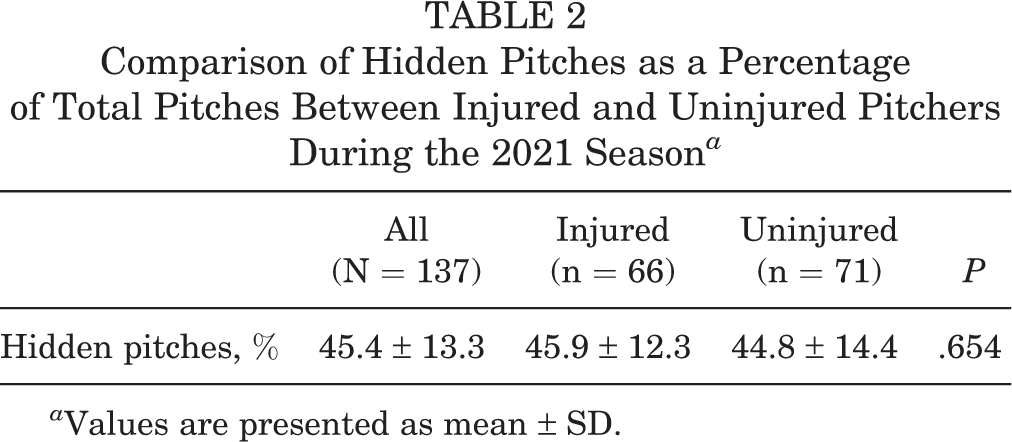
a Values are presented as mean ± SD.
Discussion
The results of this study did not confirm our hypothesis, as players who sustained an injury during the course of a single season did not throw significantly more hidden pitches during the season compared with pitchers who did not sustain an injury.
Pitch counts are one of the many components that make up a pitcher’s workload and have been tracked for quite some time. 5,16 To reduce injury risk in adolescents, MLB created the Pitch Smart Program, 20 which provides recommendations on the maximum number of pitches per game, as well as the number of rest days that players should have based on their age and the number of pitches they threw in a game. The institution of pitch count limits rather than inning limits in youth baseball was started in 2007 as a way to more tightly monitor workload. 15,18,19 Erickson et al 9 attempted to evaluate the effectiveness of these pitch count limits when compared with inning limits in reducing the risk of future UCL injury if these players made it to professional baseball. 9 The authors compared players who pitched in the Little League World Series (LLWS) before 2007 to those who pitched after 2007. They divided up the players who pitched before 2007 based on whether the number of pitches they threw in the LLWS would have followed the current pitch count recommendations. Despite the small number of pitchers included, 50% of LLWS pitchers who exceeded the current pitch count recommendations and went on to pitch professionally required UCL reconstruction (UCLR), while only 1.7% (1/58) of those who went on to play professionally and did not exceed pitch count recommendations required UCLR. This study did not take hidden pitches into account. Thus, while pitch count limits may be effective, it is unclear whether the hidden pitches played a role in injury risk.
As this is the first study to evaluate hidden pitches as a risk factor for injury in professional baseball players, there has been limited work on hidden pitches thus far in the literature. Hidden pitches are often thrown at a lower intensity and with less stress than in-game pitches, and as such, it is not clear whether they pose the same injury risk as in-game pitches. Zaremski et al 23 evaluated the total number of pitches accumulated during a typical high school varsity baseball game, including bullpen, between-innings warm-up, and in-game pitches, with 105 pitches as the upper limit of a “safe” pitch count based on the current Pitch Smart guidelines. They reported 13,769 total pitches during 115 starting pitcher outings and found that no pitcher exceeded the recommended maximum of 105 in-game pitches. However, when assessing all pitches—including the hidden pitches—the mean number of pitches was 120 per game, thereby exceeding the maximum pitch count recommendations. They found that the mean number of total pitches thrown during a pitcher outing was ≥42.4% than that documented during the game alone. Furthermore, 70.4% of pitcher outings (81/115 outings) resulted in >105 game-day pitches thrown. However, the authors did not report injury rates in these players.
The results of the present study mirror those of Zaremski et al, 23 as hidden pitches made up approximately 45% of the total number of pitches over the course of a season. It is interesting that the percentage of hidden pitches thrown does not vary between high school and professional baseball players. However, the number of hidden pitches thrown did not appear to play a significant role in injury risk to the study pitchers.
It is not clear whether hidden pitches increase a player’s risk for injury, as they increase workload and resistive stress, or whether they are protective to pitchers, as they allow the pitchers to warm up. Taking the proper time to warm up allows muscles to increase pliability and may help to reduce the risk of injury when the players enter the game and increase their throwing intensity. However, this warming up comes at the cost of increased use of the arm. The results of the present study indicate that hidden pitches are more protective than detrimental.
The present study did not find the number of in-game pitches thrown over the course of a season to be a risk factor for injury. While many have included pitch counts as a part of the workload equation, most studies on professional players have failed to show a correlation between high pitch counts during the season and the risk of injury. Erickson et al 12 reviewed all players who underwent UCLR and evaluated whether total in-game pitches over the course of a season after UCLR was a risk factor for needing a revision UCLR. The authors found that a player’s pitch count in the first full season back from UCLR was not a risk factor for requiring subsequent UCLR. Chalmers et al 5 evaluated the number of innings pitched as a risk factor for sustaining a latissimus dorsi injury in professional baseball pitchers and found that players who pitched more innings had a higher risk of injury; however, they did not evaluate pitch counts specifically. While the present study did not find the total number of hidden pitches or the total number of in-game pitches to be a risk factor for injury, this study only evaluated 1 professional baseball club over the course of 1 season. Further work regarding hidden pitches is needed to include multiple seasons across multiple teams to confirm these results.
Limitations
This study only evaluated professional baseball players in a single MLB organization, and therefore, the results may not be generalizable to pitchers in other organizations or to college/youth pitchers. Furthermore, this study only looked at 1 baseball season. Thus, the number of hidden pitches may have a cumulative effect on injury risk over the course of a player’s career. Days on the IL were not factored into the calculations in this study. Finally, although all pitchers for this organization were included, it is possible that the study was underpowered to detect a difference in injury rates. The authors plan to repeat this study each year, adding in the subsequent year’s pitch counts (in-game and hidden) to the current data to continually reassess these findings.
Conclusion
Professional baseball pitchers who sustained an injury did not throw more hidden pitches than those who did not sustain an injury. Larger scale studies are needed to confirm the results of this single-team study.
Footnotes
Acknowledgment
The authors acknowledge the training staff for the Philadelphia Phillies who recorded and entered all of the data over a period of several years. It is because of their hard work, diligence, and attention to detail that this study was possible.
Final revision submitted December 19, 2022; accepted January 25, 2023.
One or more of the authors has declared the following potential conflict of interest or source of funding: B.J.E. has received research support from Arthrex, education payments from Arthrex and Smith & Nephew, consulting fees from Arthrex and DePuy, nonconsulting fees from Arthrex, and hospitality payments from Linvatec and Stryker. M.G.C. has received grant payments from Arthrex and DJO and education support from Liberty Surgical. S.B.C. has received education payments from Liberty Surgical and consulting fees from Zimmer Biomet. AOSSM checks author disclosures against the Open Payments Database (OPD). AOSSM has not conducted an independent investigation on the OPD and disclaims any liability or responsibility relating thereto.
Ethical approval for this study was waived by Thomas Jefferson University (ref No. iRISID-2022-0991).