
Abstract
Background:
Current methods to quantify glenoid bone loss after anterior shoulder instability assume that the inferior glenoid fossa represents a perfect circle with minimal side-to-side variability.
Purposes/Hypotheses:
The purpose of this study was to (1) determine normal glenoid parameters—including height, width, surface area (SA), and shape of the glenoid fossa as a function of glenoid notch type—and (2) characterize whether side-to-side, sex- and race-based differences exist in these parameters. It was hypothesized that the inferior glenoid would be better represented as an ellipse rather than a perfect circle, that side-to-side differences in glenoid SA would exist as a function of notch type, and that there would be sex and race-based differences for all other measured variables.
Study Design:
Descriptive laboratory study.
Methods:
A total of 58 pairs of human scapulae from individuals between 18 and 35 years of age at the time of death were randomly selected and stratified according to human race and sex. All specimens were digitized using a 3-dimensional laser scanner, and all parameters were calculated using MATLAB software. Descriptive statistics were computed on all dependent variables and were stratified by sex, race, and side. Generalized estimating equations models were used to compare group means. Intra- and interrater reliability of the notch classification was assessed.
Results:
Of the 58 matched left and right pairs (116 glenoid specimens), there were 30 Black women, 30 Black men, 26 White women, and 30 White men. Small but statistically significant side-to-side differences were found for nearly all linear and SA measurements. The left glenoid parameters, on average, have larger glenoid height (0.37 mm [95% CI, 0.15 to 0.59]; P = .001), larger width (0.27 mm [95% CI, 0.05 to 0.49 mm]; P = .017), larger total glenoid SA (22.3 mm2 [95% CI, 15.2 to 29.5 mm2]; P≤ .001), and larger inferior glenoid SA (11.9 mm2 [range, 3.11 to 20.6mm2]; P = .008) compared with the right side. Women, on average, have smaller linear parameters—including glenoid height (−3.06 mm [95% CI, −4.08 to −2.04 mm]; P < .001), glenoid width (−2.93 mm [95% CI, −3.71 to −2.14 mm]; P < .001), glenoid width-to-height ratio (−0.02 [95% CI, −0.04 to 0 mm]; P = .034), anterior glenoid width (−0.82 mm [95% CI, −1.36 to −0.27]; P = .003), and posterior glenoid width (−2.11 mm [95% CI, −2.71 to −1.50 mm]; P < .001), and smaller SA measurements—including total glenoid SA (−139.9 mm2 [95% CI, −178.1 to −101.6 mm2]; P < .001) and inferior glenoid SA (−23.2 mm2 [95% CI, −158.6 to −87.8 mm2]; P < .001). There were no differences in linear or SA measurements as a function of human race. The inferior aspect of the glenoid articular surface was elliptical in shape. Intraobserver reliability of the notch classification revealed an overall consistency of 0.56 (95% CI, 0.26 to 0.77), while the interobserver reliability kappa coefficient was 0.43 (95% CI, 0.4 to 0.45).
Conclusion:
In this anatomic study, the inferior glenoid fossa was better represented by an ellipse than a circle, and small side-to-side differences were found between linear and SA measurements. The latter 2 findings contradict assumptions made by current techniques for calculating bone loss and therefore raise concern about their validity, especially those that depend on the placement of a circle on the glenoid fossa. Using the contralateral normal total glenoid width or other linear measurements may be considered to calculate the magnitude of glenoid bone loss. However, we do not recommend using contralateral SA measurements for this purpose.
Clinical Relevance:
To our knowledge, this is the first study to define the normal shape and SA of the inferior glenoid fossa in dry specimens and the first to attempt to stratify these data according to the anterior glenoid notch. The data from this study can be used to create validated methods to measure glenoid bone loss preoperatively to help determine when a glenoid bone augmentation procedure is indicated.
The shoulder remains the most commonly dislocated major joint, with recurrence rates decreasing with age.13,22,28 Glenoid support is critical for humeral head containment and thus stability of the glenohumeral joint and is a result of both the deepening effect and the articular arc length or safe zone of the glenoid surface.9,45,67 Both biomechanical24,32,79 and clinical5,6,9,13,40,51,65,66,73 studies have shown that when bone loss approaches a clinically important threshold, Bankart repairs have a high failure rate when performed alone. Valid preoperative assessment of both critical9,40 (>20%-25%) and subcritical17,27,69 (≥13.5%-20%) glenoid bone loss in shoulder instability is therefore crucial for surgical decision-making.
Multiple radiographic methods have been developed to quantify glenoid deficiency preoperatively and are based on either linear3,15,24,26,54 or surface area (SA)4,21,39,53,74 measurements, expressed as a percentage of the normal inferior glenoid circle. Recent evidence suggests that SA measurements of glenoid bone loss provide the most reproducible and accurate results.7,18,29,42,43 Such methods commonly rely on imaging of the contralateral unaffected shoulder to obtain normal parameters of glenoid size and shape to calculate bone loss of the affected shoulder and are based on the assumption that the inferior glenoid fossa represents a perfect circle10,19,30,53,74 with minimal side-side variability.27,33,70,74 However, others have found significant variability in the shape of the inferior glenoid fossa that relates to the anterior glenoid notch14,48,60,62,78 as well as the circular shape of the glenoid cavity. 1 Such variability has questioned the generalizability of the current linear or SA circle-dependent techniques that are used to measure bone loss in the population.
This study aimed to determine normal glenoid parameters—including height, width, SA, and shape of the glenoid fossa as a function of glenoid notch type—and to characterize whether side-to-side, sex, and racial differences exist in these parameters. We hypothesized that the inferior glenoid would be better represented as an ellipse rather than a perfect circle, that side-to-side differences in glenoid SA would exist as a function of notch type, and that there would be sex- and race-based differences for all other measured variables. Secondary objectives of the study were to determine the inter- and intrarater reliability of the notch classification. We hypothesized that the notch classification would be reliable among assessors.
Methods
A total of 2967 specimen pairs (ie, glenoid pairs) were available for screening within the Hamann-Todd Osteological Collection at the Cleveland Museum of Natural History (CMNH). This collection contains the skeletal remains of Cleveland’s unclaimed dead from 1912 through 1938 (ie, between 87 and 113 years ago). Only specimens who were between 18 and 35 years of age at the time of death were studied to ensure skeletal maturity35,72 and minimize the possibility of degenerative changes. This age group was also representative of patients who experience recurrent anterior shoulder instability in the general population.22,28 The age, sex, human race, body height, and weight were known for each specimen; hand dominance was an unknown variable. The specimens were categorized according to human race (ie, 2 different human racial groups [White and Black]) and sex, and then further subcategorized according to glenoid notch type (eg, types 0, 1, and 2) as reported by Merrill et al 48 (Figure 1). Institutional review board approval was not required for this anatomic study of dry scapular specimens.

Three different right shoulder specimens demonstrating the adapted anterior glenoid notch classification as described by Merrill et al. 48 (A) Type 0 glenoid notch (no notch). (B) Type 1 glenoid notch (slightly curved). (C) Type 2 glenoid notch (distinct notch).
All scapulae with glenoids that were damaged (eg, erosion or loss of the anterior/posterior glenoid rim), contained degenerative or posttraumatic changes (eg, osteophytes or surface defects/irregularities), or represented rare glenoid morphologies (ie, type 3 glenoid, scalloped notch) 48 or anomalies (eg, hypoplastic glenoid)60,78 were excluded. Specimen categorization and exclusion were performed by 1 investigator (A.R.). A second investigator (A.J.B.) assisted with categorization and exclusion when the initial assessment of specimens was unclear; consensus was reached in all cases during the secondary review. Only specimens of the White and Black human races were included in the study, based on the availability of specimens in the sampled collection. Five scapulae were randomly chosen for each human race-sex-notch type group, and the contralateral scapulae were included, yielding 10 scapulae in each group except for the White female type 0 glenoid group, for which the collection consisted of only 3 pairs (ie, 6 scapulae) for a total of 116 specimens studied. Of note, this was a convenience sample and not based on a power calculation.
Each included specimen was then digitized using a 3-dimensional (3D) scanner, which has a stated accuracy of 0.005 inches (3D Scanner HD, NextEngine; http://edu.nextengine.com). Before specimen digitization, each scapula was placed on a horizontal platform supported by the medial border of the scapula, with the glenoid fossa 6.5 inches away from the scanner as per the manufacturer’s recommendations. The 3D data of the glenoid fossa obtained from each specimen were then converted into a 2D image, accounting for the concave shape of the glenoid. All measurements (linear, SA, and shape) were obtained along the articular surface of the glenoid fossa and excluded the peripheral, nonarticular regions of the glenoid rim, due to concerns that this would lead to overestimation and error in linear/SA measurements and in the assessment of glenoid shape.
Custom software was written in MATLAB (Mathworks) by 1 investigator (A.G.) to measure anatomic parameters of glenoid size (eg, height, width), adapted from Merrill et al, 48 SA, and shape (eg, eccentricity), utilizing the image data created from the laser scanner. The MATLAB script was designed to automate measurements; the accuracy of the script was validated by manual measurements on a subset of scans and verified by the creation of measurement schematics for all scans to ensure that all measurement lines were drawn accurately and consistently across all 116 specimens. The glenoid was oriented vertically along the true vertical axis before measuring the linear parameters. Height (HT) was measured first by identifying the most superior and inferior points of the glenoid fossa, near the supraglenoid tubercle and inferior cortical rim, respectively (Figure 2). Next, glenoid width measurements were recorded; all widths were parallel with the anteroposterior axis, which was perpendicular to height. Three glenoid widths were recorded: total glenoid width (WGlenoid), the greatest anterior (WAnt), and posterior widths (WPost) perpendicular to the line denoting HT (Figure 2).
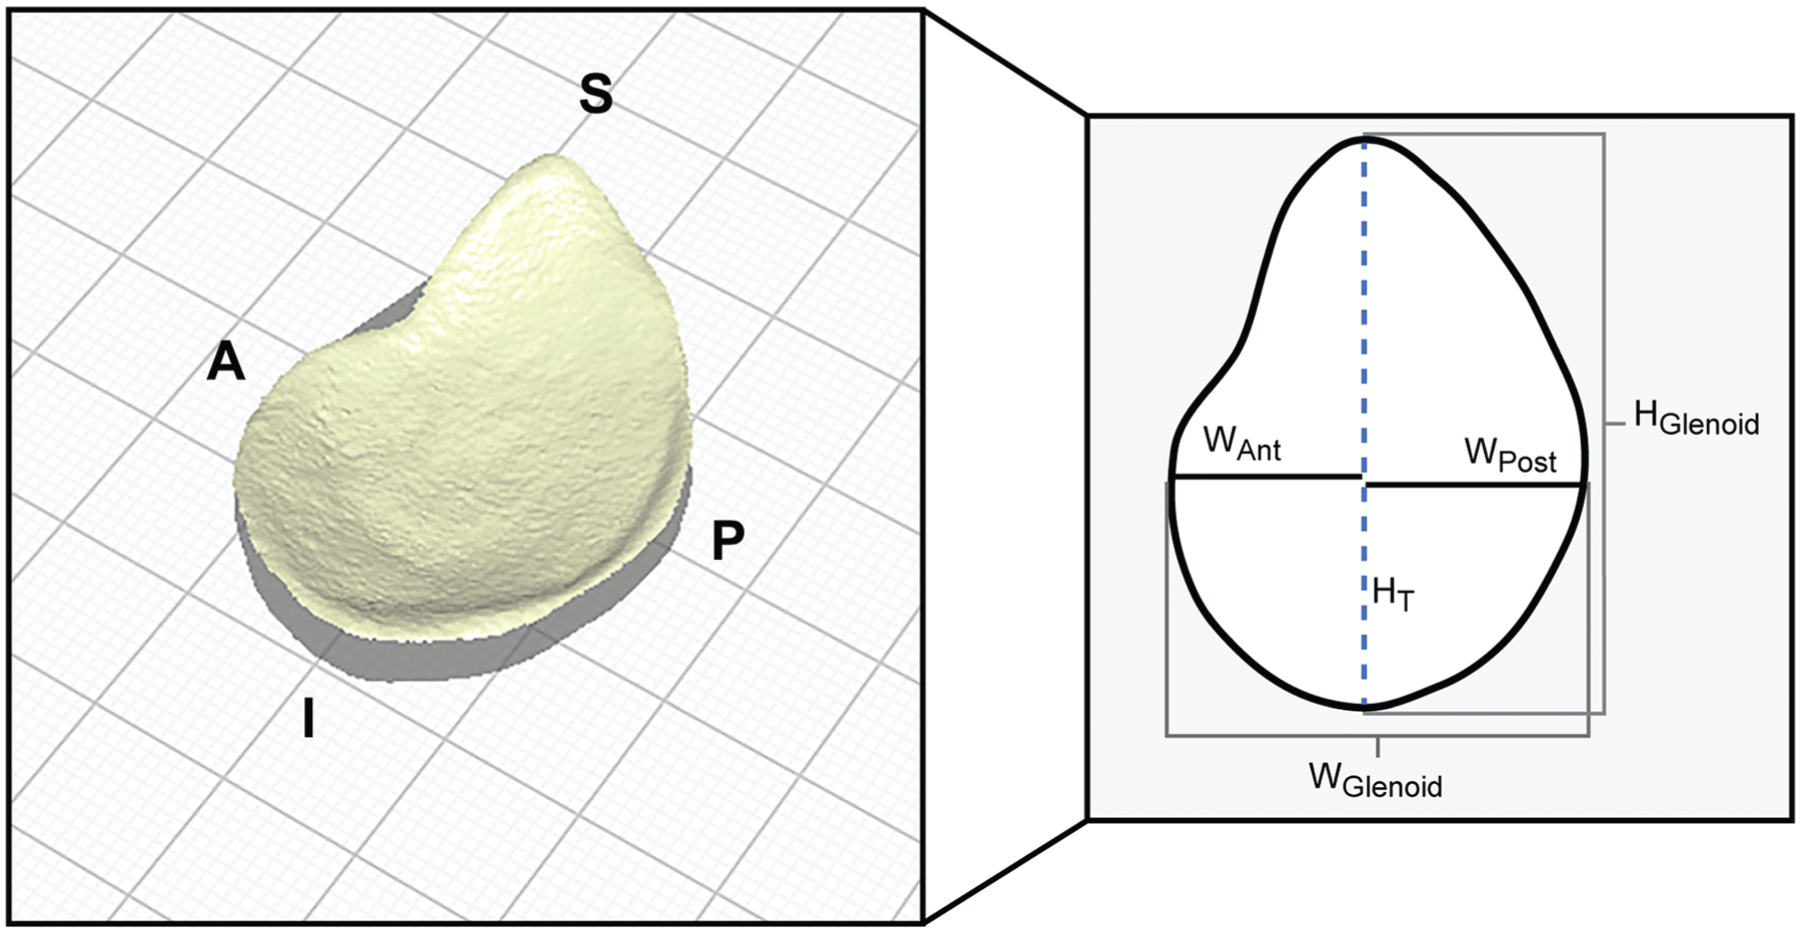
Representative example of a left scapular specimen after initial data acquisition of the glenoid fossa using a 3D laser scanner, which is subsequently converted to a 2D image to obtain linear parameters of the glenoid articular surface. 2D, 2-dimensional; 3D, 3-dimensional; A, anterior; P, posterior; S, superior; I, inferior; WAnt, anterior width; WGlenoid, total glenoid width; WPost, posterior width; HT, height.
To determine the shape of the inferior glenoid fossa (ie, articular surface), a best-fit ellipse was applied to the circumference of the inferior glenoid—including the articular portion of the cortical rim that serves as the region of glenoid labrum attachment and excluding the outer nonarticular regions of the cortical rim/glenoid bone to assess whether the inferior glenoid fossa resembles a perfect circle. This method would ensure that the entire surface of the glenoid fossa that contacts the humeral head (ie, the articular arc of the glenoid fossa) 9 would be included in our measurements and was decided upon by 1 investigator (A.R.), and assistance was provided in select cases by a second investigator (A.J.B.) if the boundaries of the articular margin were unclear. Once the best-fit ellipse was applied, the eccentricity of this ellipse was recorded. For reference purposes, the eccentricity of a perfect circle is zero, and that of an ellipse is >0.01 and <1 (ie, the further away from zero, the further from the shape of a perfect circle). Two separate SA measurements were recorded: total SA of the glenoid fossa (SAGlenoid) and the area contained within the inferior glenoid fossa within the best-fit ellipse (SAInfGlenoid) (Figure 3).

(A) Representative example of a right scapular specimen after registration of the entire cortical rim of the glenoid articular surface used to calculate the total glenoid SA, excluding the peripheral nonarticular regions of the glenoid. (B) The inferior glenoid cortical rim of the articular surface is utilized to determine the shape of the inferior glenoid fossa, which is predominantly elliptical in shape (white dashed line = best fit ellipse). The SA contained within the best-fit ellipse represents the inferior glenoid SA. An overlay of a perfect circle (solid white line with internal blue shading) has been used to demonstrate how a perfect circle would appear for this specimen using the largest dimension of the best-fit ellipse, which is along the outer nonarticular cortical margin (ie, posteriorly) and beyond (ie, anteriorly), resulting in overestimation of the inferior glenoid surface area. SA, surface area.
Lastly, the intra- and interrater reliability of the glenoid notch classification as reported by Merrill et al 48 was assessed among 13 raters (senior medical students, orthopaedic residents, sport medicine fellows, sport medicine-trained orthopaedic surgeons, and a musculoskeletal radiologist [all 5 authors were among the group of 13 raters]) using the en face view of 20 glenoid specimens that were randomly selected from the total group of 116 specimens. Raters were asked to list each notch type for the 20 specimens (types 0, 1, and 2). To permit an assessment of intrarater reliability, this process was repeated 2 weeks after the first assessment using the identical images; however, the images were resorted using a random number generator so that they were not analyzed in the same order. Study conceptualization and initial methodology were designed by 2 investigators (A.J.B., M.H.J.), and all investigators contributed to the final methodology before starting the study.
Statistical Analysis
Data comprised measurements on 116 glenoid paired specimens from 58 human skeletons, with between-subject explanatory variables including sex (female vs male), race (Black vs White), and human height (in mm). Within-subject variables included side (left vs right). For regression modeling, human height was divided by 100; thus, regression coefficients represent the effects of an additional 10 cm of height. Descriptive statistics on 9 dependent variables (glenoid height, 3 glenoid width measurements, glenoid width/height ratio, eccentricity, total glenoid SA, SA of the inferior glenoid within the best-fit ellipse, and SA inferior/total glenoid ratio)—including mean, standard deviation, and 95% CIs for the mean—were computed in the overall sample, as well as stratified by each binary explanatory variable (sex, race, and side). Generalized estimating equations (GEE) models were used to compare group means and compute the confidence intervals. We calculated Spearman rank correlations between human height and each dependent variable. Furthermore, linear GEE regression models were fit regressing each dependent variable on each explanatory variable (univariable models), on all 3 between-subject explanatory variables together (multivariable models), and on all 3 between-subject explanatory variables plus all 3 two-way interaction terms. As no interaction term was statistically significant, interaction models were excluded from the results. The within-subject model was not adjusted for the between-subject variables, as the between-subject variables were perfectly balanced across the 2 sides (left/right) and therefore no adjustment was required. Model fit was assessed via normal quantile-quantile plots of the standardized residuals. Left-versus-right percentage differences were also computed, along with 95% CIs. Left-right differences were additionally analyzed using paired t tests. Statistical significance was set at P < .05. Analyses were performed using SAS Version 9.4 (SAS Institute Inc).
The kappa coefficient was used to assess intraobserver and interobserver reliability of the notch type classification among 13 raters. Reliability values ranged from 0 to 1, with 1 indicating perfect reliability. The remaining values were interpreted as follows: poor reliability when <0.20; fair reliability from 0.21 to 0.40; moderate reliability from 0.41 to 0.60; substantial or good reliability from 0.61 to 0.80; and almost perfect or very good reliability23,37 from 0.81 to 1.
Results
Of the 2967 specimen pairs (ie, glenoid pairs) available within the CMNH collection for screening, a total of 2321 pairs were excluded because of age criteria, 157 pairs because of degenerative changes, structural damage and/or surface irregularities of the glenoid surface, 36 pairs because of missing anthropometric data (primarily height data), 7 incomplete pairs, and 4 Asian paired specimens because of an insufficient sample size. A total of 442 glenoid pairs were eligible for block randomization, of which 58 matched left and right pairs (116 glenoids) were used for the final data collection and analysis: 30 Black women, 30 Black men, 26 White women, and 30 White men (Figure 4).

Flowchart demonstrating specimen eligibility, exclusion, randomization, and final inclusion for analysis. CMNH, Cleveland Museum of Natural History.
Using information from the original historical data of each specimen, the mean age for the entire study population was 28.1 years, the mean height was 170.2 cm, and the mean weight was 54.4 kg (Table 1). Analysis of intraobserver reliability of the anterior glenoid notch type revealed an overall consistency of 0.56 (95% CI, 0.26-0.77), while the interobserver reliability kappa coefficient was 0.43 (95% CI, 0.4-0.45). Based on the overall poor to moderate reliability statistics, glenoid parameters measured in this study were grouped together as right or left to permit side-to-side comparisons and were therefore not stratified per notch type but only stratified as a function of sex and human race (Figure 4).
Descriptive Data of Included Glenoid Specimens a

Data are presented as mean ± SD.
For all dependent variables measured, men had, on average, larger linear and SA measurements (Table 2). In addition, the left glenoid, on average, had larger glenoid height, overall glenoid width, and glenoid SA measurements compared with the right glenoid (range, 0.4%-3.5%) (Tables 2 and 3). No differences were observed in linear or SA measurements as a function of human race.
Descriptive Data of the 116 Glenoid Specimens a
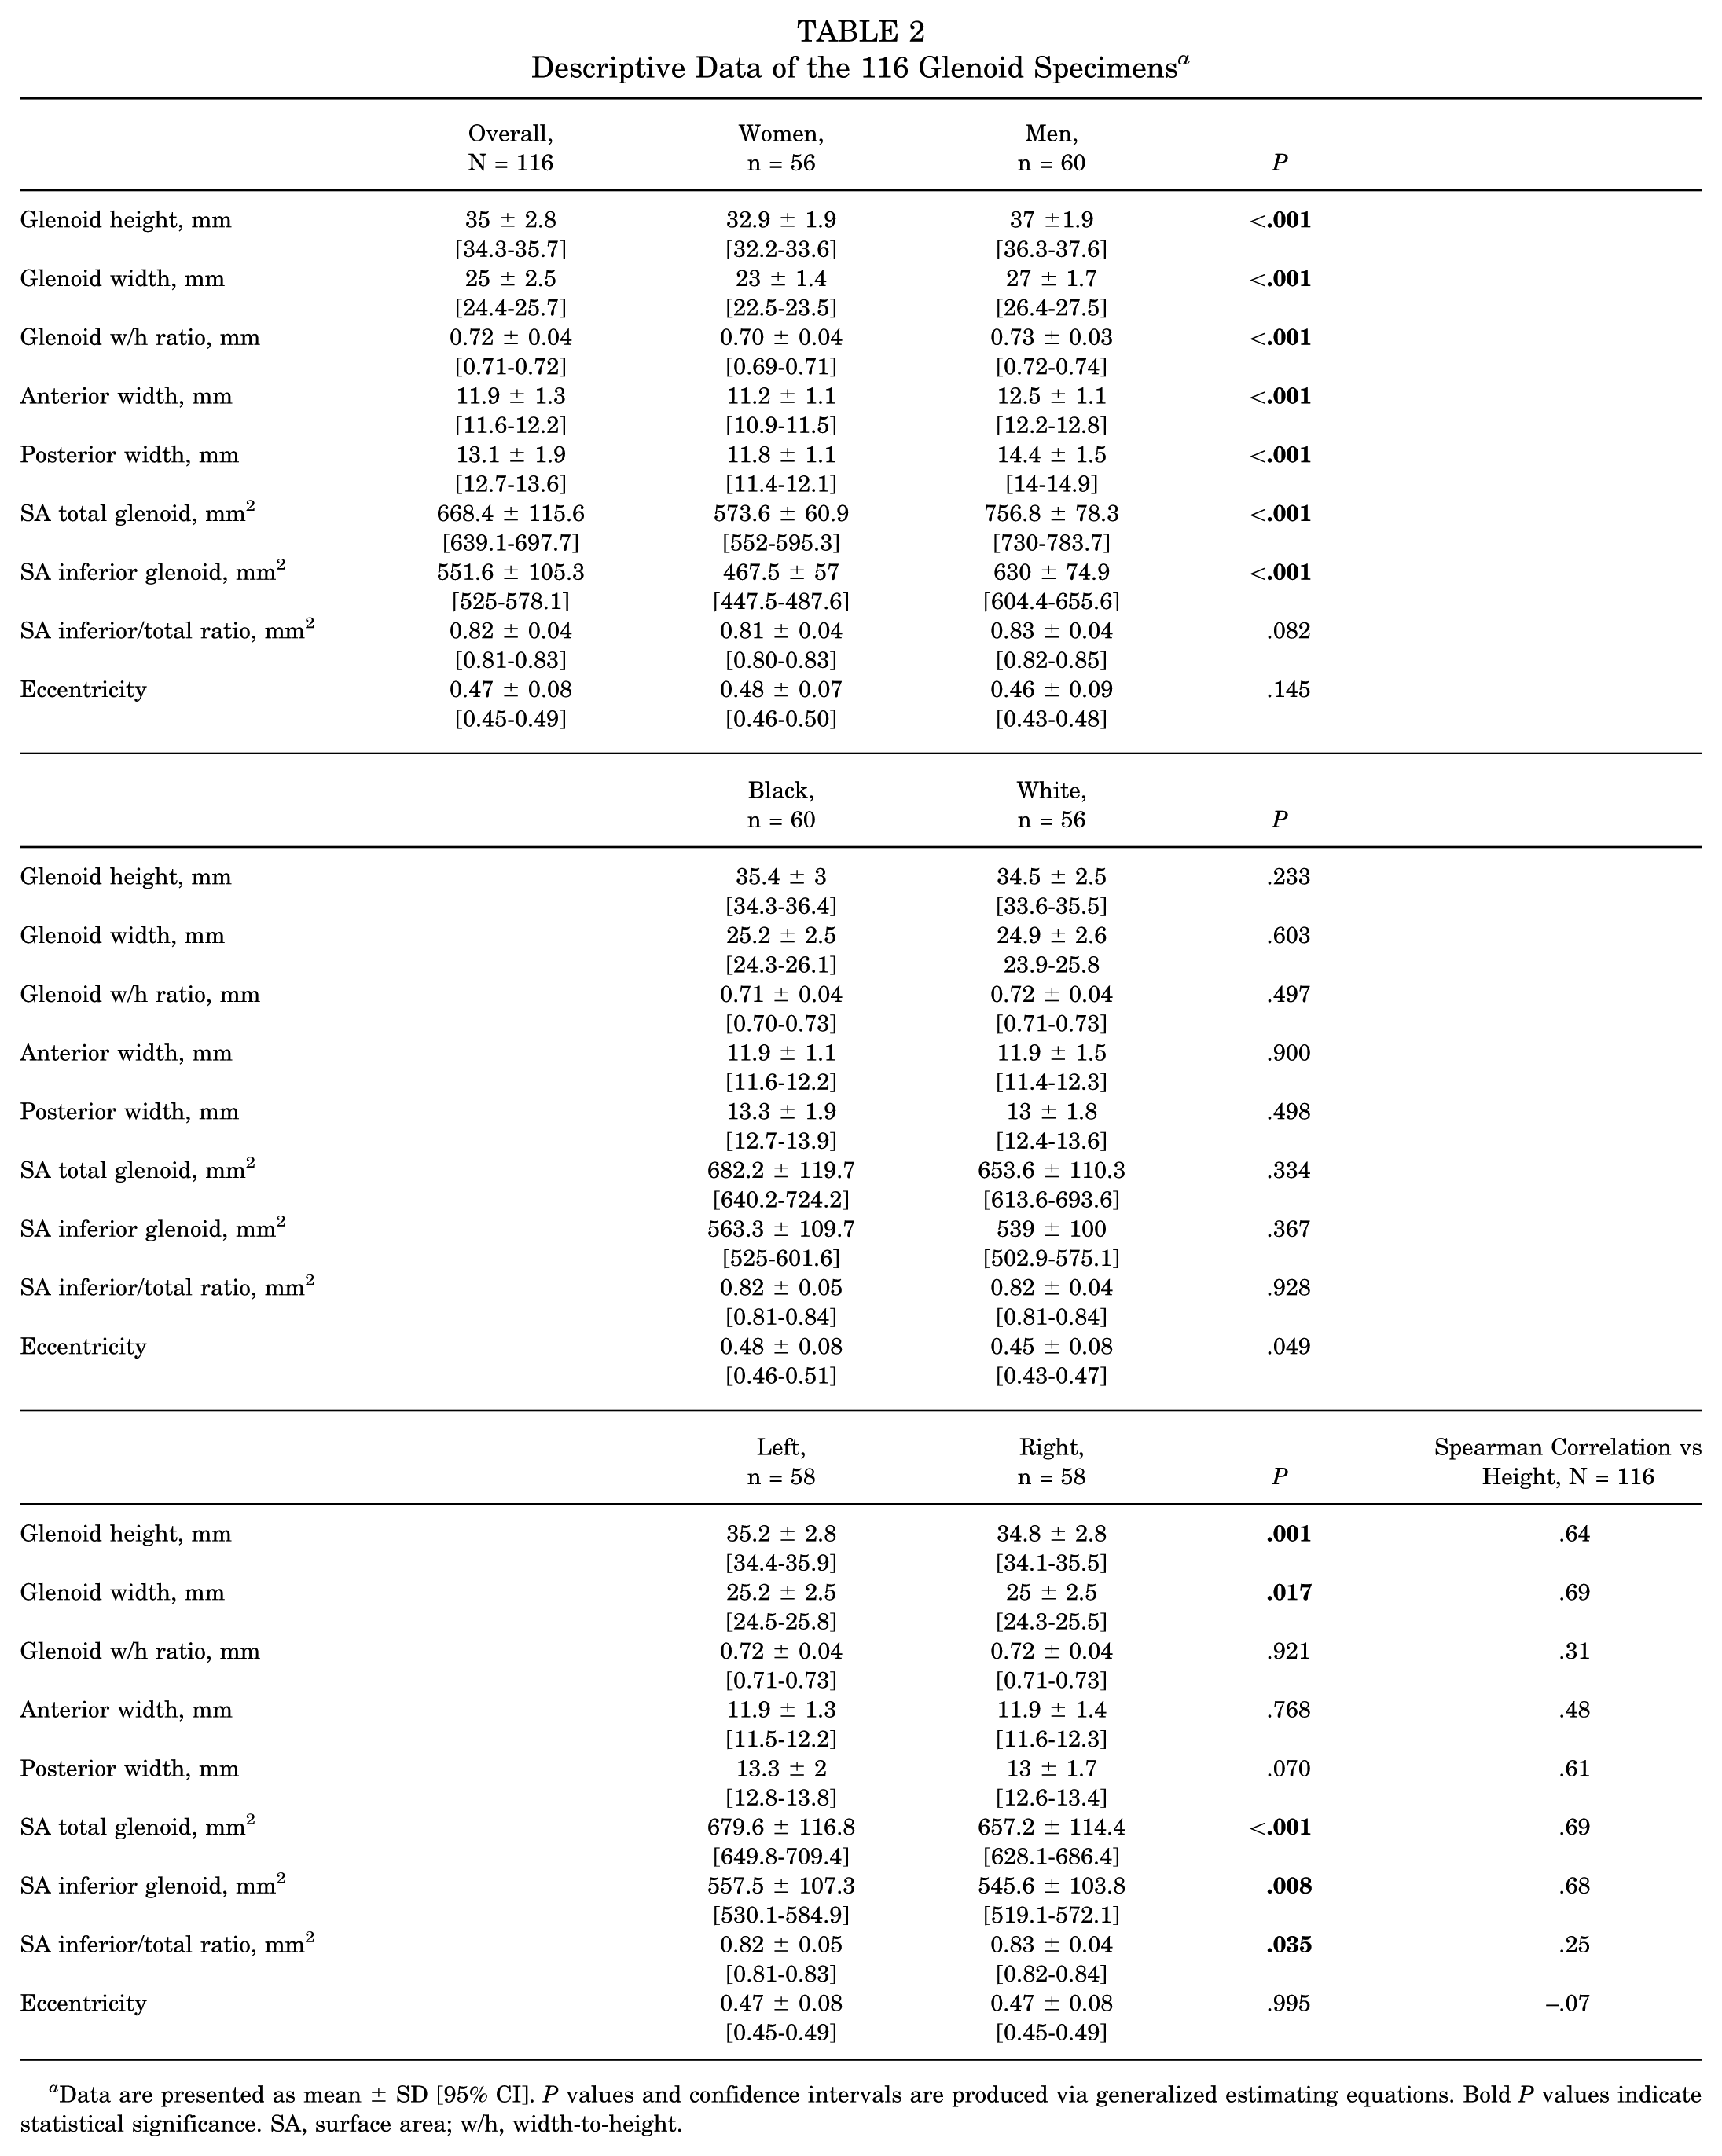
Data are presented as mean ± SD [95% CI]. P values and confidence intervals are produced via generalized estimating equations. Bold P values indicate statistical significance. SA, surface area; w/h, width-to-height.
Percent Difference Between Left and Right Glenoid Specimen Measurements a

SA, surface area; w/h, width-to-height.
With respect to glenoid shape, every subgroup (ie, sex, human race, and unilaterality [left vs right]) was greater than zero eccentricity. Therefore, there was no evidence that the inferior aspect of the glenoid was circular in shape but rather resembled an elliptical/oval shape. Glenoid shapes were significantly different between White and Black human race; however, there were no differences in glenoid shape as a function of human sex or unilaterality (Table 2). Correlation of linear, SA measurements and glenoid shape (ie, eccentricity) to human height was found to be strong for glenoid height, glenoid width, posterior width, total and inferior glenoid SA measurements, moderate for anterior glenoid width, weak for glenoid width/height and inferior/total SA ratios, and very weak for eccentricity (Table 2). Percentage differences for each dependent variable as a function of unilaterality are summarized in Table 3.
In the univariable models, sex, unilaterality (left vs right) and human height revealed significant associations with the linear and SA variables measured. Specifically, left glenoid parameters, on average, have larger glenoid height, glenoid width, total glenoid SA, inferior glenoid SA, and an inferior/total glenoid SA ratio compared with the right side (Table 4). In the multivariable models, sex and human height remained significant when controlling for human race and unilaterality (Table 4). Specifically, women, on average, have smaller linear parameters—including glenoid height, glenoid width, glenoid width-to-height ratio, anterior glenoid width, and posterior glenoid width, and smaller SA measurements—including total glenoid SA and inferior glenoid SA. There was no significant association between the inferior/total SA ratio and sex. For every 10 cm (100 mm) of incremental increase in human height, there were significant increases in linear parameters—including glenoid height, glenoid width, anterior glenoid width, posterior glenoid width, and SA parameters—including total glenoid SA and inferior glenoid SA, but not between the inferior/total SA ratio or glenoid width-to-height ratio and human height. There were no significant associations in the linear or SA parameters for the human race when controlling for the other independent variables. With respect to glenoid shape (ie, eccentricity), there was evidence of a significant association between human race and glenoid shape in the univariable model only, but no association between glenoid shape and sex, unilaterality, or human height (Table 4). The results of the paired t tests were identical to the primary analysis.
GEE Linear Regression Models a
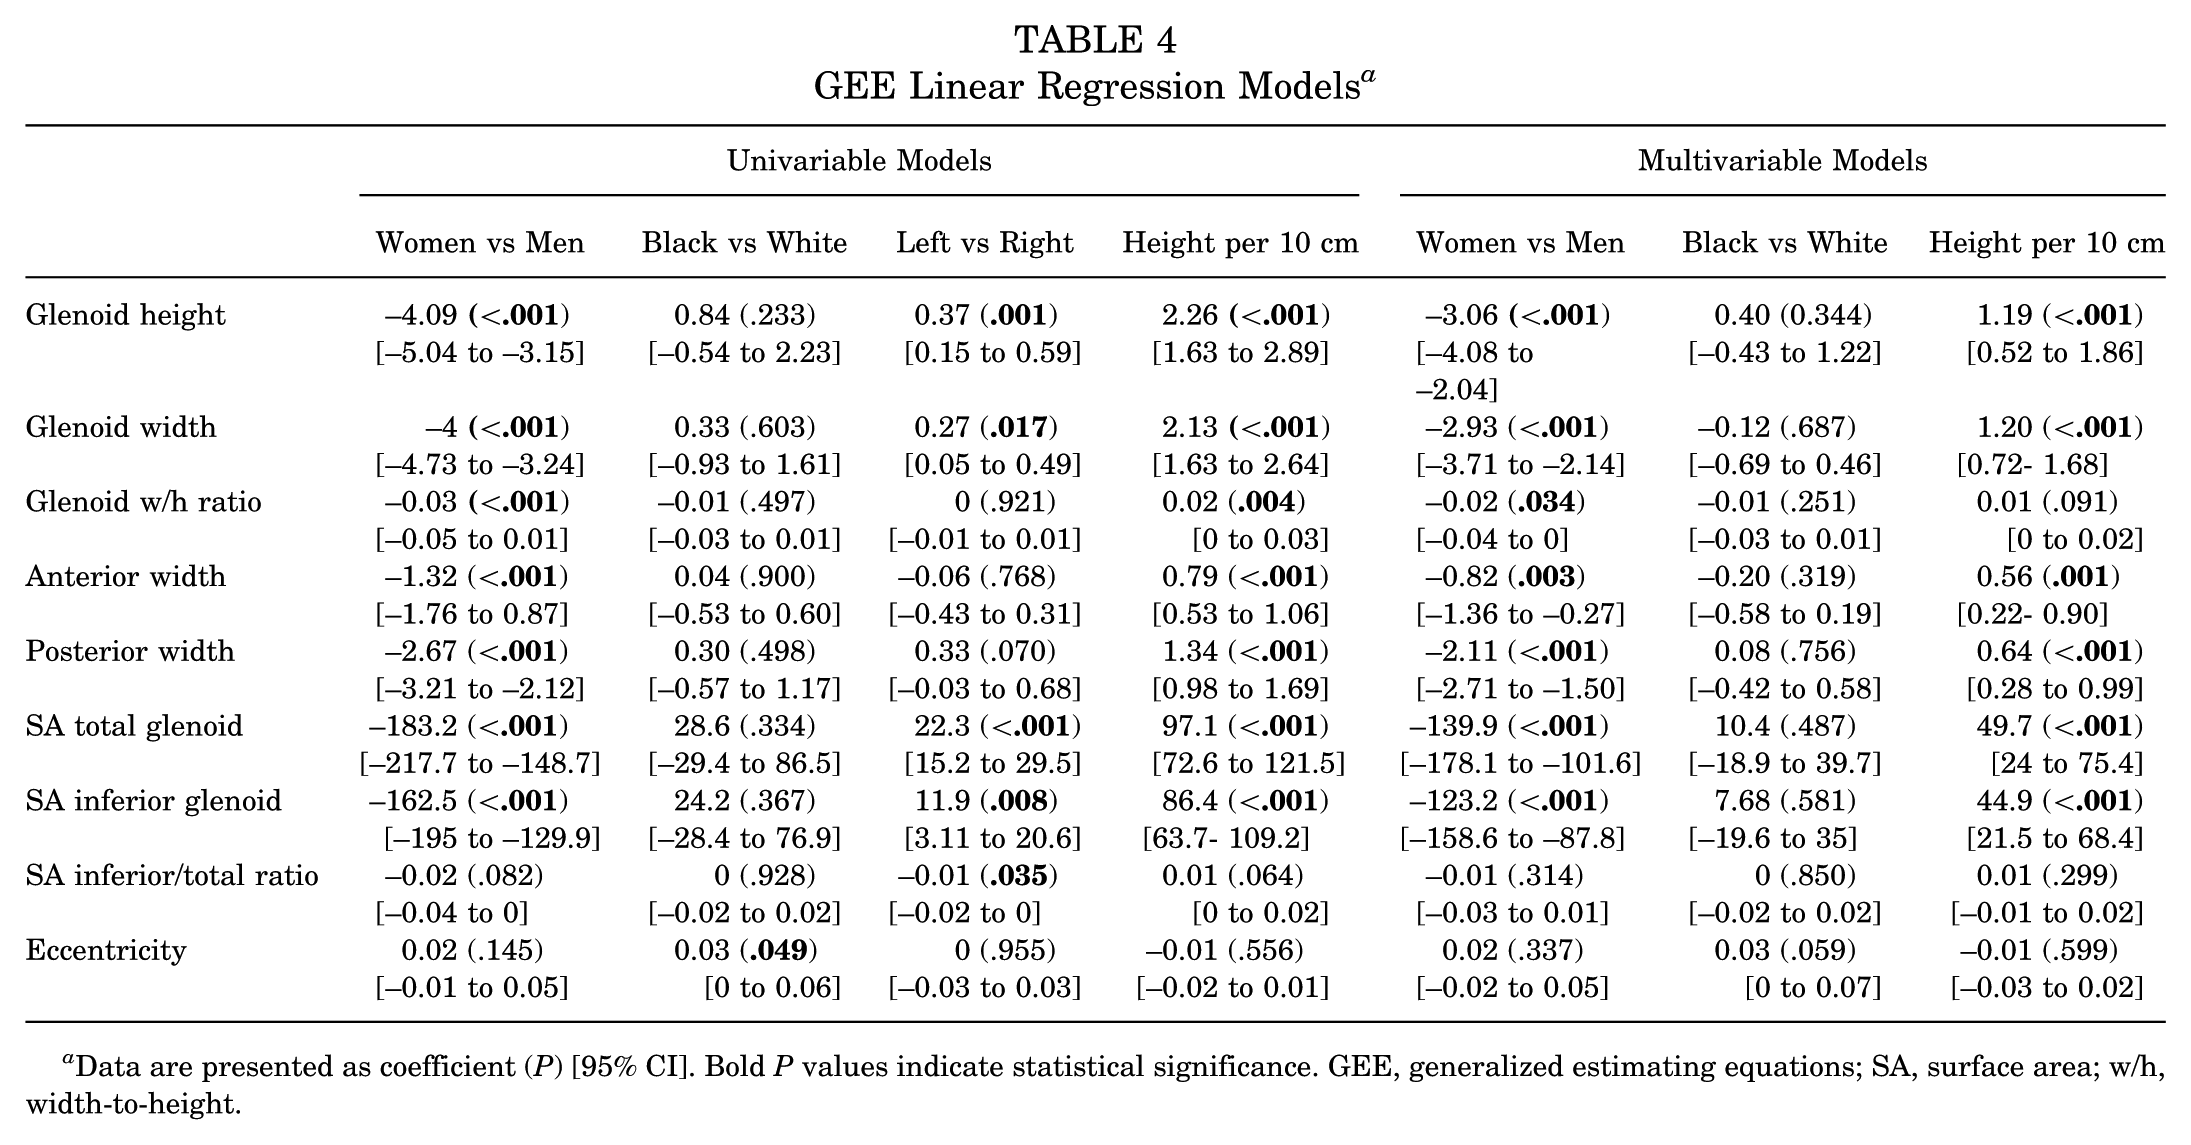
Data are presented as coefficient (P) [95% CI]. Bold P values indicate statistical significance. GEE, generalized estimating equations; SA, surface area; w/h, width-to-height.
Discussion
This was the first study to our knowledge that attempted to define normative glenoid data stratified according to the normal variability of the glenoid fossa shape (ie, anterior glenoid notch); however, only moderate reliability of the glenoid notch classification was observed in our study group, which can, in part, be explained by the subjectivity of differentiating notch type within this classification system. Data were therefore grouped as right or left to permit side-to-side comparisons and stratified by sex and human race alone. Our study demonstrated small but statistically significant side-to-side differences for human glenoid parameters of height, width, and SA (left > right). Furthermore, across all dependent variables, men had, on average, larger linear and SA measurements. Such differences did not exist as a function of the human race. We also demonstrated that the inferior aspect of the glenoid articular surface was not a perfect circle but rather oval/elliptical, and that this shape is influenced by the human race alone and does not differ between left/right shoulders or by sex. Both linear and SA measurements positively correlate with human height; however, human stature does not influence glenoid shape.
Several anatomic studies have been previously performed to determine normal linear parameters of glenoid height and width.16,31,34,47,48,78 Overall, our results (Table 2) appear consistent with those of other anatomic and radiographic studies for most linear parameters measured.27,31,47,78 The slight differences found in our results (ie, smaller dimensions) and those obtained in other studies may be explained by differences in (1) specimen preparation (dry specimens vs cadaveric specimens), (2) measurement technique (digital calipers vs computer software vs radiographic measurements), and (3) demographic differences between study groups (ie, age, sex, race, and possibly nutritional status). Interestingly, 2 previous studies using dry scapular specimens from the same skeletal collection as the present study found glenoid height/width results similar to those presented here,16,48 confirming the importance of specimen and demographic information when comparing anatomic measurements between studies from different regions of the world.
Although there was a statistically significant difference between paired glenoid width measurements in the present study, the overall difference was small (ie, <0.2 mm or <2%) and did not reach a clinically important difference (≥ 3mm). 71 Based on these findings, using the contralateral normal total glenoid width (or any other linear parameter assessed in this study) to calculate the magnitude of glenoid bone loss in cases of unilateral recurrent anterior instability may be considered. This contrasts with a recently performed anatomic study by Provencher et al, 55 where a total of 4 of 46 pairs of glenoids (8.6%) showed a difference of >3 mm versus the contralateral glenoid (ie, right > left), leading authors to recommend against using the contralateral glenoid for bone loss measurements. This study was performed using cadaveric specimens (vs dry specimens), and width measurements may have unintentionally included the outer (ie, nonarticular) peripheral regions of the glenoid; these differences in methodology may explain the differences between this study and our findings. Furthermore, our study revealed that left-sided glenoid dimensions were, on average, larger than the right for all paired specimens analyzed, a finding that has been supported by other authors. 48 Such findings may seem counterintuitive in the modern world that is predominantly right-handed, where one may assume that larger glenoid dimensions would be found on the dominant side; however, a review of the literature clearly reveals that observations and measurements of the human skeleton cannot determine one’s handedness with confidence. 76
Few anatomic studies have been published in the English literature assessing the normal human glenoid SA using adult dry specimens. In 1995, Prescher and Klumpen 61 studied 214 adult dry scapular specimens (114 men and 100 women) to determine the total SA of the glenoid fossa using computer software and found a mean SA for the entire sample of 8.60 ± 1.72cm2 (range, 5.32-13.59 cm2). When each sex was considered separately, there was a statistical difference between male (9.87 ± 1.23 cm2) and female (7.18 ± 0.89 cm2) specimens. In 2003, Griffith et al 26 assessed total glenoid SA using 2-dimensional computed tomography in 10 healthy patients (20 shoulders) and found that the normal side-to-side variation was, on average, 4.1% (range, 0.4%-12%). The total glenoid SA calculated in our grouped/pooled data was 6.68 cm2 (95% CI, 6.39-6.98 cm2), and side-to-side variation was 3.5% (range, 2.4%-4.6%). The discrepancy between our study results and those described above may be due to either the differences in the study populations examined or in the measurement technique used. In the present study, the SA was calculated for the total and inferior glenoid surfaces (ie, within the best-fit ellipse) using a high-resolution laser scanner; both measurements increased as a function of increasing human height and were larger in men than in women. There were also statistically significant and clinically important differences between left and right shoulders for total and inferior glenoid SA measurements in the present study (Tables 2 and 3), and it is therefore not recommended to use the contralateral normal SA to calculate the magnitude of glenoid bone loss in cases of unilateral anterior instability.
For all dependent variables measured in the present study, men, on average, had larger linear and SA measurements (ie, independent of human stature). In 2001, Churchill et al 16 recorded the height, width, version, and inclination of 344 scapular specimens (172 matched pairs) using digital calipers. Glenoid dimensions (height and width) did not vary between the races (Black vs White) but did reach clinically significant differences between men and women. These latter findings were further supported by Merrill et al 48 who not only found sex differences but also side-to-side differences for nearly all linear dimensions measured (ie, left > right). These same authors also found differences in glenoid shape between female specimens (ie, more oval in shape) and male specimens (ie, more circular in shape). Four other radiographic and 2 anatomic studies have confirmed the finding of sex differences in linear parameters of glenoid height and width27,33,41,46,59and total SA,41,61 respectively.
Racial differences for linear parameters of the glenoid—including glenoid width and height—have been previously described in studies performed in different regions of the world.50,58,59,68 Such findings in the literature are in contrast with the findings of the current study, where there were no statistical differences in linear or SA parameters measured between Black and White specimens. This may be due to a small sample size in this study or differences in methodology between studies. However, statistical differences in glenoid shape (ie, eccentricity) were demonstrated between Black and White specimens in the present study; the shape in both racial groups deviated similarly from the shape of a perfect circle, and the overall differences in shape observed between Black and White specimen groups are likely of little clinical importance (see Table 2).
Descriptions of the shape of the glenoid fossa and contour of the anterior glenoid rim date back 49 to the early 1900s. In 1992, Iannotti et al 31 described the glenoid as pear-shaped, with the larger diameter below the midglenoid notch. In 2002, Burkhart et al 10 developed an arthroscopic technique for determining anterior glenoid bone loss in the inferior glenoid fossa, which represented the shape of a circle, which was subsequently reinforced in several radiographic studies.33,53,74 However, Aigner et al 1 found that the inferior glenoid fossa represented a true circle in only 50% of the sample studied; the other half of the specimens were oval in shape. In 2006, Huysmans et al 30 found that the inferior part of the glenoid fossa represented a true circle in 39 of 40 cadaveric specimens; however, there are methodological concerns in this study (ie, digital placement of a circle on the outer/peripheral nonarticular regions of the glenoid). In our study using dry scapulae, we found that the inferior glenoid shape of the articular surface was best represented by an elliptical shape and not a perfect circle (eccentricity of 0.47 ± 0.08), a finding that we attribute to the variability in the shape and contour of the anterior glenoid rim as represented by the glenoid notch and its variations14,48,62 and the relative flat/oblique surface of the posterior/posteroinferior glenoid rim. 38 The elliptical shape of the glenoid fossa may also be partly explained by the shape of the opposing humeral head articular surface (ie, elliptical shape peripherally) and high conformity of the glenohumeral joint.31,47
Multiple radiographic techniques have been described to measure glenoid bone loss in the setting of recurrent shoulder instability. 8 To date, there is no universally accepted gold standard method of measurement, and few validation studies have been performed with varying results.2,7,29,75 Furthermore, most measurement techniques have been developed on the assumption that (1) the inferior glenoid fossa is circular in shape3,4,15,21,39,44,53,54,74 and that (2) there are little to no side-to-side differences in glenoid size and shape.4,15,26,27,33,39,70,74 Even if the true shape of the inferior articular glenoid surface was that of a perfect circle supporting its clinical use for bone loss measurement, multiple studies have demonstrated substantial errors related to the approximation in size and positioning of the normal circle in clinical scenarios of both anterior 7,12,20,36,52,56,75 and posterior 57 glenoid bone loss. Similar to the study by Aigner et al, 1 we also observed that the inferior glenoid is not consistently represented as a perfect circle but is rather elliptical/oval in shape. In addition, we found clinically important side-to-side differences in glenoid fossa SA measurements, reflecting size variations between the left/right sides (see Tables 2 and 3). Based on these findings, there continues to be concern regarding the validity of current quantification techniques that assess glenoid bone loss. Recent work has focused on the creation of statistical shape models25,63,64 and artificial intelligence 11 for predicting the magnitude of glenoid bone loss; however, future work is required to validate the utility of such methods. 77
The strengths of our study include the rigor in study methodology, such as random selection of dry scapulae without bony pathology from a large sample of specimens in an age group that matches a typical instability patient (age, 18-35 years). A MATLAB script was created to automate measurements, and its accuracy was validated. To our knowledge, this is the first study to define the normal shape and SA of the inferior glenoid fossa on dry specimens. The small number of specimens used in this study may have prevented sufficient power to detect racial differences in linear and SA measurements statistically and to detect sex differences in glenoid shape. Another limitation is that our results are not generalizable to other racial groups worldwide. The authors also utilized manual registration techniques to define the outer articular margin of the glenoid cortical rim to ensure that non-articular regions of the glenoid were excluded from measurements; more accurate computer-enhanced methods may exist today that did not exist at the time of the study. Lastly, this is a laboratory study that needs to be clinically evaluated to determine its applicability and validity.
Conclusion
In this anatomic study, the inferior glenoid fossa was better represented by an ellipse than a circle, and small side-to-side differences were found between linear and SA measurements. The latter 2 findings contradict assumptions made by current techniques to calculate bone loss and therefore raise concern about their validity, especially those techniques that depend on the placement of a circle on the glenoid fossa. Using the contralateral normal total glenoid width or other linear measurements may be considered to calculate the magnitude of glenoid bone loss; however, we do not recommend using contralateral SA measurements for this purpose. Future work is required to create validated, unilateral measurement techniques of glenoid bone loss.
Footnotes
Acknowledgements
The authors thank the Cleveland Museum of Natural History for their support and unlimited access to the Hamann-Todd Osteological Collection.
Final revision submitted September 29, 2025; accepted October 19, 2025.
One or more of the authors has declared the following potential conflict of interest or source of funding: A.J.B. has a financial educational license/relationship with Elsevier and is a board member of the Canadian Shoulder and Elbow Society. M.H.J. is a consultant for Grunenthal, is an editorial board member of The Orthopaedic Journal of Sports Medicine, and has received research support from Pacira and the Arthritis Foundation. A.M. receives royalties and consulting fees from Arthrosurface. AOSSM checks author disclosures against the Open Payments Database (OPD). AOSSM has not conducted an independent investigation on the OPD and disclaims any liability or responsibility relating thereto.
Ethical approval was not required for the present study.