
Abstract
Background:
Given that there are 27 bone stress injury (BSI) severity classification and scoring systems described in the literature, most systems are based solely on imaging, while the literature stresses the importance of considering clinical risk factors for return to running.
Purpose:
To propose a modified BSI classification score incorporating clinical factors, bone location, Fredericson and Nattiv magnetic resonance imaging (MRI) grading systems, and bone type to improve prediction of return-to-running times.
Study Design:
Cohort study; Level of evidence, 2.
Methods:
A 7-year prospective study of National Collegiate Athletic Association Division I cross-country and track and field athletes was conducted from 2013 to 2020. Participants completed an annual questionnaire about known risk factors for injury or impaired bone health. Information about BSIs and time to return to running was collected at team physician meetings, in discussions with athletes, from athlete questionnaires, and from medical chart review. A 0 to 7 score was calculated based on the Cumulative Risk Assessment (CRA) category (low, medium, and high risk of female athlete triad), bone location (low-, medium-, and high-risk locations), MRI grade, and type of bone (cortical vs trabecular). Generalized estimating equations accounting for correlated observations assessed the relationship between the score and return-to-running times.
Results:
In total, 83 athletes, including both men and women, experienced 140 BSIs. The average return-to-running time was 47.8 days for men and 64.8 days for women. Higher modified BSI classification scores were significantly associated with increased return-to-running times: each additional risk point was associated with an 8.5-day longer return-to-running time on average (P < .0001). When examining the individual components of the score, MRI grade and CRA score were most strongly associated with return-to-running times in men, and bone location and type were most strongly associated in women. However, return-to-running times were highly variable, and the modified BSI classification score explained only a small amount of the total variance in return-to-running times.
Conclusion:
A higher modified BSI classification score was associated with increased return-to-running times in both men and women; however, the predictive ability was only low to moderate. Adding CRA risk score, bone location, and bone type to MRI grade alone resulted in a moderate improvement in predicting return-to-running times in women, but adding these additional variables to MRI grade alone resulted in no improvement in men. Additional studies will be needed to determine whether this system results in better prediction than MRI grade alone.
Bone stress injuries (BSIs) are common in athletes. 1 A BSI is a condition where a bone becomes weakened due to repetitive mechanical stress that exceeds its ability to repair itself. Stratifying patients with BSIs into prognostic and treatment groups has been difficult given the lack of a standardized classification system. There have been 27 BSI classification systems described in the literature, with no new classification systems proposed since 2011. 17
Magnetic resonance imaging (MRI) grading has been widely used for classifying BSI severity. The Fredericson system was one of the initial systems to use an MRI classification system for tibial BSIs. 11 The Fredericson classification correlated with clinical features (pain with hop test, percussion, and palpation) and a greater time to return to sports in higher-grade injuries. 3 Subsequent systems incorporating MRI grading criteria for BSIs at other bone locations were introduced by Nattiv et al, 18 Arendt et al, 2 and Kaeding and Miller. 14 In a prospective study, Nattiv et al 18 demonstrated that the average return-to-sport time after high-grade BSIs was 23.1 weeks, whereas it was only 13.1 weeks for low-grade BSIs. High-grade BSIs include grade 3 to 4 BSIs on MRI studies. Low-grade BSIs include grades 1 to 2 on MRI studies.
Boden and Osbahr 5 and Boden et al 6 classified BSIs into low and high risk based on location. High-risk sites are those more prone to delayed healing or nonunion and include the femoral neck, anterior cortex of the tibia, medial malleolus, tarsal navicular, and fifth metatarsal. Low-risk sites, which typically heal without complications, include the femoral shaft, tibial shaft, calcaneus, and sacrum. 20 Dobrindt et al, 8 who classified BSIs using a combination of MRI and bone location, showed that higher MRI grades predicted longer return-to-sport times in low-risk bone locations but not in high-risk bone locations. Other factors associated with BSI recovery times include bone type, trabecular versus cortical bone, and aspects of the female athlete triad.12,15 Nattiv et al 18 demonstrated that BSIs at trabecular-rich sites took an average of 31.1 weeks to heal versus 14.9 weeks for BSIs at cortical-rich sites. A multiple linear regression analysis in this same study indicated that a higher MRI grade and lower total body bone mineral density emerged as significant independent predictors of time to full return to sport among collegiate distance runners, and disordered eating was also associated with a significant delay in return to sport. 18
The purpose of this study was to propose a modified BSI classification score incorporating clinical factors (cumulative risk assessment or CRA, which measures risk of the female athlete triad), bone location, Fredericson and Nattiv MRI grading systems, and bone type (cortical-rich vs trabecular-rich) and to test the correlation of this new modified BSI classification score with return-to-running times. We also explored whether the modified BSI score improved the prediction of return-to-running times compared with MRI grade alone.
Methods
Study Design
Data were collected as part of a larger 7-year prospective study of BSIs in cross-country and track runners from Stanford University and the University of California–Los Angeles. Institutional review board approval was obtained for this study. This secondary analysis used data from 83 athletes (both men and women) who collectively sustained 140 BSIs. For men, 23 had 1 BSI, 7 had 2 BSIs, and 2 had 3 BSIs. For women, 23 had 1 BSI, 16 had 2 BSIs, 8 had 3 BSIs, 3 had 4 BSIs, and 1 had 6 BSIs. Data on 14 BSIs that occurred during follow-up were omitted because we lacked data on return to running or had insufficient data to calculate a modified BSI classification score. All cross-country athletes and distance and middle-distance track athletes from 2 universities in California were invited to participate in the larger prospective study from September 2013 to March 2020. Inclusion criteria were age 18 years and older and designation as an athlete on the cross-country team or as a distance or middle-distance runner on the track team. Participants were followed until they graduated or otherwise left the team, or until March 2020. Exclusion criteria were as follows: participant was unable to complete the questionnaire or did not agree to sign the consent form. We did not exclude those with a history of BSI or other lower limb injuries. History of BSI was factored into the CRA score.
During the study, participants were asked annually to complete a baseline questionnaire to collect information related to known risk factors for injury or impaired bone health. The questionnaire included questions on demographic information, body composition, health history, bone health, previous athletic/training history, and sleep habits. A full menstrual history was obtained for each female athlete, including age of menarche, history of menstrual irregularities, and current menstrual status. Eating behaviors and subclinical eating disorders were evaluated using select questions from the Eating Disorders Examination Questionnaire, which has been validated, with published norms for our population. We obtained information from patients’ medical records on BSIs. Only injuries diagnosed by a physician and confirmed with imaging studies were included in the analysis. Return-to-running times were determined based on clinical notes documenting clearance for full competition. Return-to-running clearance was determined by the team physician. All athletes progressed in a nonimpact cross-training program using an antigravity treadmill. When they could run pain-free at 95% body weight, they were started on a return-to-ground running protocol, our marker for return to running. If the athlete experienced any pain in their return-to-run protocol, we had them return to a level at which they had no symptoms and, after a few days, try to progress again. Repeat imaging was performed for all high-risk injuries. They were not cleared to start a return-to-run protocol unless there were clear signs of bone healing.
Data were recorded on REDCap and accessed during this study from July 2021 through June 2022. The following versions of REDCap were used: Version 12.4.5 (released on June 27, 2022)—Stanford upgrade on June 30, 2022 Version 12.3.2 (released on May 6, 2022)—Stanford upgrade on May 10, 2022 Version 12.2.11 (released on April 15, 2022)—Stanford upgrade on April 15, 2022 Version 12.2.4 (released on February 21, 2022)—Stanford upgrade on February 23, 2022 Version 12.0.4 (released on December 10, 2021)—Stanford upgrade on December 13, 2021 Version 11.4.0 (released on October 11, 2021)—Stanford upgrade on October 15, 2021 Version 11.2.4 (released on August 6, 2021)—Stanford upgrade on August 6, 2021 Version 10.8.1 (released on February 5, 2021)—Stanford upgrade on February 8, 2021
Dependent Variable
We used return to running (specifically return to ground running) rather than return to competition as the dependent variable because some athletes sustained BSIs in the off-season, and thus return to running represents a more appropriate clinical measure to inform and counsel the athletes.
Independent Variables
The modified BSI score was calculated based on total CRA score (Table 1), bone location (low-, medium-, and high-risk locations), MRI grade (1-4), and type of bone (cortical vs trabecular) (Table 2). Anatomic regions that were considered include bone locations listed in Table 2.
Cumulative Risk Assessment Score From the 2014 Female Athlete Triad Coalition Consensus a

Incorporates clinical factors such as energy availability, BMI, menarche, menstrual function, BMD, and history of bone stress injury (BSI). Stress reaction/fracture indicates a history of a BSI or fracture. BMD, bone mineral density; BMI, body mass index; DE, disordered eating; DSM-5, Diagnostic and Statistical Manual of Mental Disorders, Fifth Edition; EA, energy availability; EW, estimated weight.
Modified Bone Stress Injury Scoring Rubric a

Maximum score = 7 for women and 5 for men. CRA, cumulative risk assessment; MRI, magnetic resonance imaging.
See Table 1 for a definition and description of the CRA score.
Bone location has previously been divided into low-, medium-, and high-risk sites. Low-risk sites include the posteromedial tibia, fibula/lateral malleolus, calcaneus, and diaphysis of the second to fourth metatarsals. 6 Medium-risk sites include the pelvis (sacrum and pubic rami), femoral shaft, proximal tibia, cuboid, and cuneiform. 19 High-risk sites include the femoral neck, patella, anterior tibial diaphysis, medial malleolus, and talus. 5 These were assigned 0, 1, and 2 points, respectively, in the modified bone stress injury classification system.
Refers to the entire bone that is trabecular-rich.
The CRA 7 uses a scoring system based on 6 symptoms relating to energy availability with or without disordered eating/eating disorder, bone health, and menstrual status, each scored from 0 to 2 (Table 1). The resulting score designates an athlete as high (restricted from training/competition), moderate (provisional/limited clearance), or low (full clearance) risk. These were scored, respectively, as 0, 1, or 2 points in the modified BSI classification system.
The Fredericson and Nattiv MRI grading systems are defined as the following
17
: Grade 1: Mild marrow or periosteal edema on T2, T1 normal Grade 2: Moderate marrow or periosteal edema plus positive T2; T1 normal Grade 3: Severe marrow or periosteal edema on T2 and T1 Grade 4: Severe marrow or periosteal edema on T2 and T1, plus fracture line on T1 or T2
Grades 1 and 2 were assigned a score of 0, grade 3 a score of 1, and grade 4 a score of 2 in the modified BSI classification system. We combined grades 1 and 2 for easy comparison with previous studies and also because MRI grades 1 and 2 were collapsed into 1 category for MRI points (MRI points = 0).
Bone location has previously been divided into low-, medium-, and high-risk sites. Low-risk sites include the posteromedial tibia, fibula/lateral malleolus, calcaneus, and diaphysis of the second to fourth metatarsals. 6 Medium-risk sites include the pelvis (sacrum and pubic rami), femoral shaft, proximal tibia, cuboid, and cuneiform. 19 High-risk sites include the femoral neck, patella, anterior tibial diaphysis, medial malleolus, and talus. 5 These were assigned 0, 1, and 2 points, respectively, in the modified BSI classification system.
Bone type was defined as either predominantly trabecular-rich bone (femoral neck, sacrum, and calcaneus sites) or cortical-rich bone (all other sites). Trabecular-rich bones were assigned 1 additional point in the modified BSI classification system.
The modified BSI classification system was applied to running athletes at 2 universities in California.
Statistical Analysis
Data analyses were performed in SAS version 9.4 (SAS Institute). We calculated descriptive statistics using both athlete and BSI as the unit of observation. To assess the relationship between modified BSI score and return to running, we used general estimating equations (GEEs) to account for the within-athlete correlation among athletes who sustained more than 1 BSI. We used linear GEE models when treating the return to running as continuous. As a secondary analysis, we also considered return to running as a binary variable: >8 weeks versus ≤8 weeks. This cutoff was chosen a priori as it corresponds roughly to the length of a full competitive season. This was evaluated to show that the results are similar whether we use a continuous outcome or dichotomize, as some previous authors have done. Logistic GEE models were used when treating return to running as a binary outcome. All models were adjusted for age, school, and sex or adjusted for age and school and stratified by sex. To evaluate model fit, we calculated marginal R2 values for the GEE models. 21
Results
Demographics
Data from 83 runners were included in this analysis, with 42 from institution 1 and 41 from institution 2. The average age at the year of the BSI was 20.0 years for men and 19.6 years for women (Table 3).
Athlete and BSI Characteristics a

Values are presented as number or mean (SD) unless otherwise indicated. All analyses accounted for multiple BSIs. BSI, bone stress injury; CRA, cumulative risk assessment; MRI, magnetic resonance imaging.
Total number of points from modified BSI risk score in Table 2.
Return-to-running time is defined as duration in days from the first clinical diagnosis to the first ground run.
This was an athlete with a grade 1 injury in a low-risk location who returned to pain-free running.
Characteristics of the BSIs
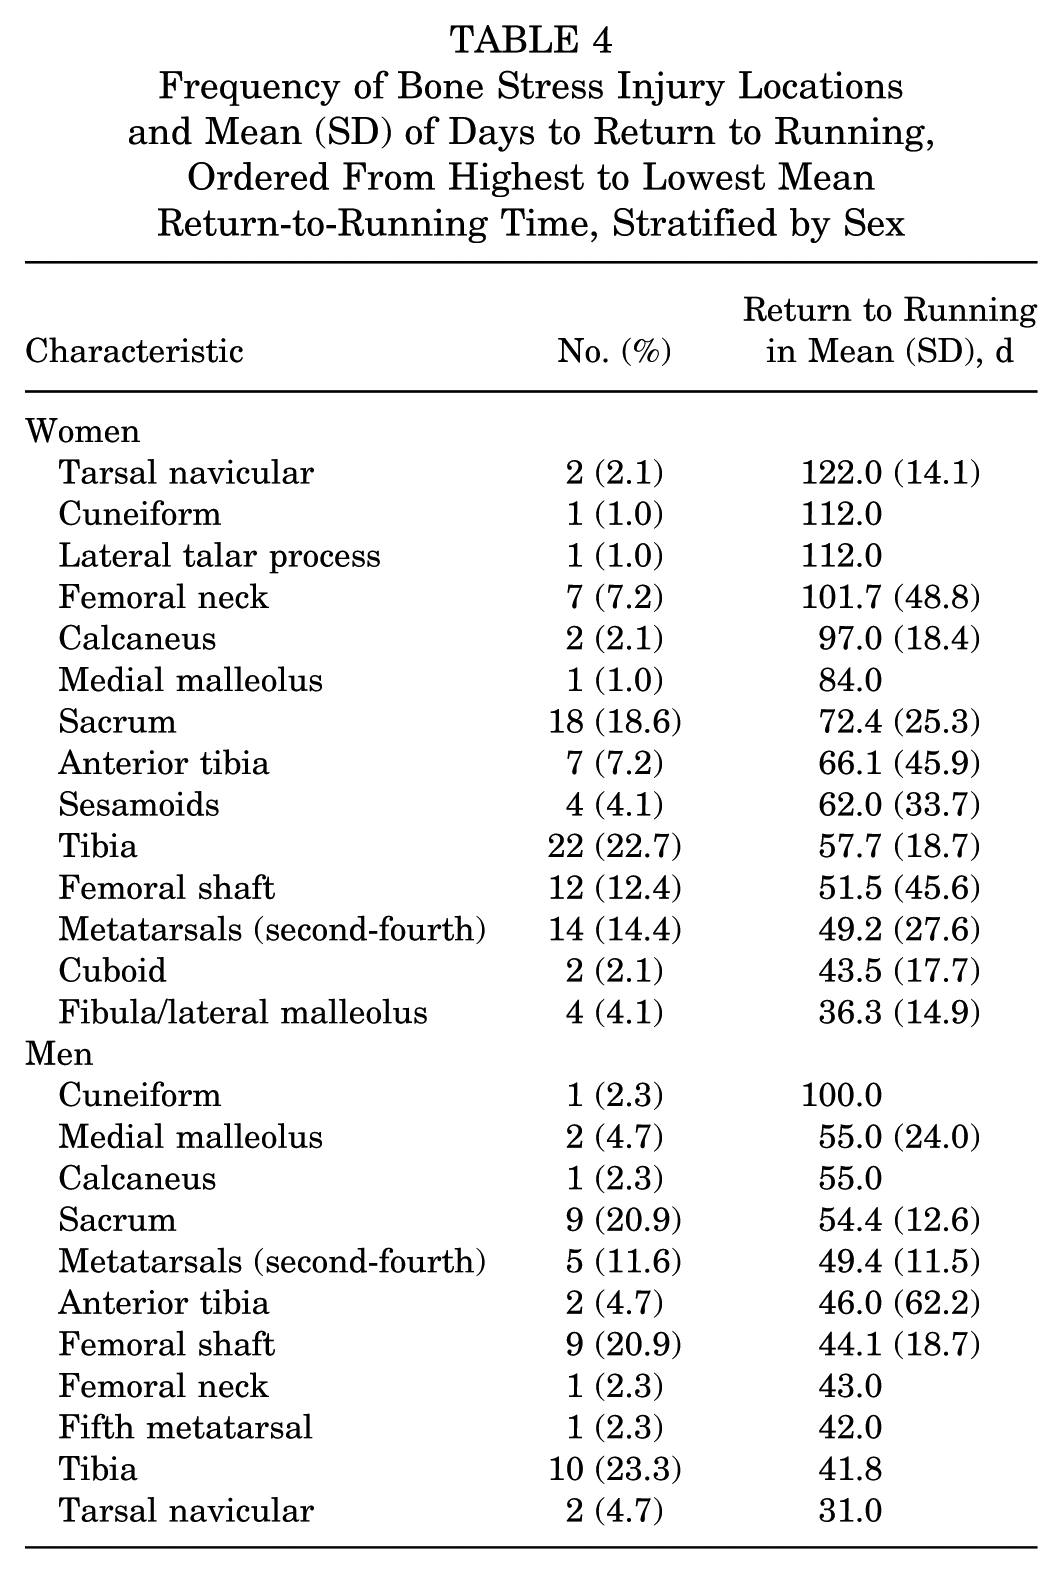
In total, 32 men sustained 43 BSIs (with 23 sustaining 1 BSI and 9 sustaining more than 1 BSI), and 51 women sustained 97 BSIs (with 23 sustaining 1 BSI and 28 sustaining more than 1 BSI) (Table 3). For both men and women, the most common location was the tibia (Table 4). Return-to-running times ranged from 2 to 100 days in men and 13 to 187 days in women. In women, BSIs of the tarsal navicular, lateral talar process, cuneiform, calcaneus, and femoral neck required the longest time off running. In men, the cuneiform, medial malleolus, calcaneus, and sacrum required the longest time off from running. The mean return-to-running time was 47.8 days in men and 64.8 days in women, with high variability (standard deviations of 21.3 days in men and 35.0 days in women).
Frequency of Bone Stress Injury Locations and Mean (SD) of Days to Return to Running, Ordered From Highest to Lowest Mean Return-to-Running Time, Stratified by Sex
Return to Running
Figures 1 and 2 show the relationship between the modified BSI score and return-to-running times in men (Figure 1) and women (Figure 2). These plots demonstrate high variability in return-to-running scores at all levels of the modified BSI score. For women and men, there was a small to moderate increase in the return-to-running times across increasing modified BSI scores. MRI grade alone was also only modestly associated with recovery: the mean (SD) return-to-running time was 54.9 (33.7) days for MRI grades 1 and 2 (n = 55), 58.7 (31.7) days for grade 3 (n = 54), and 69.3 (29.9) days for grade 4 (n = 31).

Scatterplot with standard linear regression line: return-to-running time (defined as duration in days from first clinical diagnosis to first ground run) stratified by modified bone stress injury (BSI) score in male athletes. Maximum score is 5 in men and 7 in women.
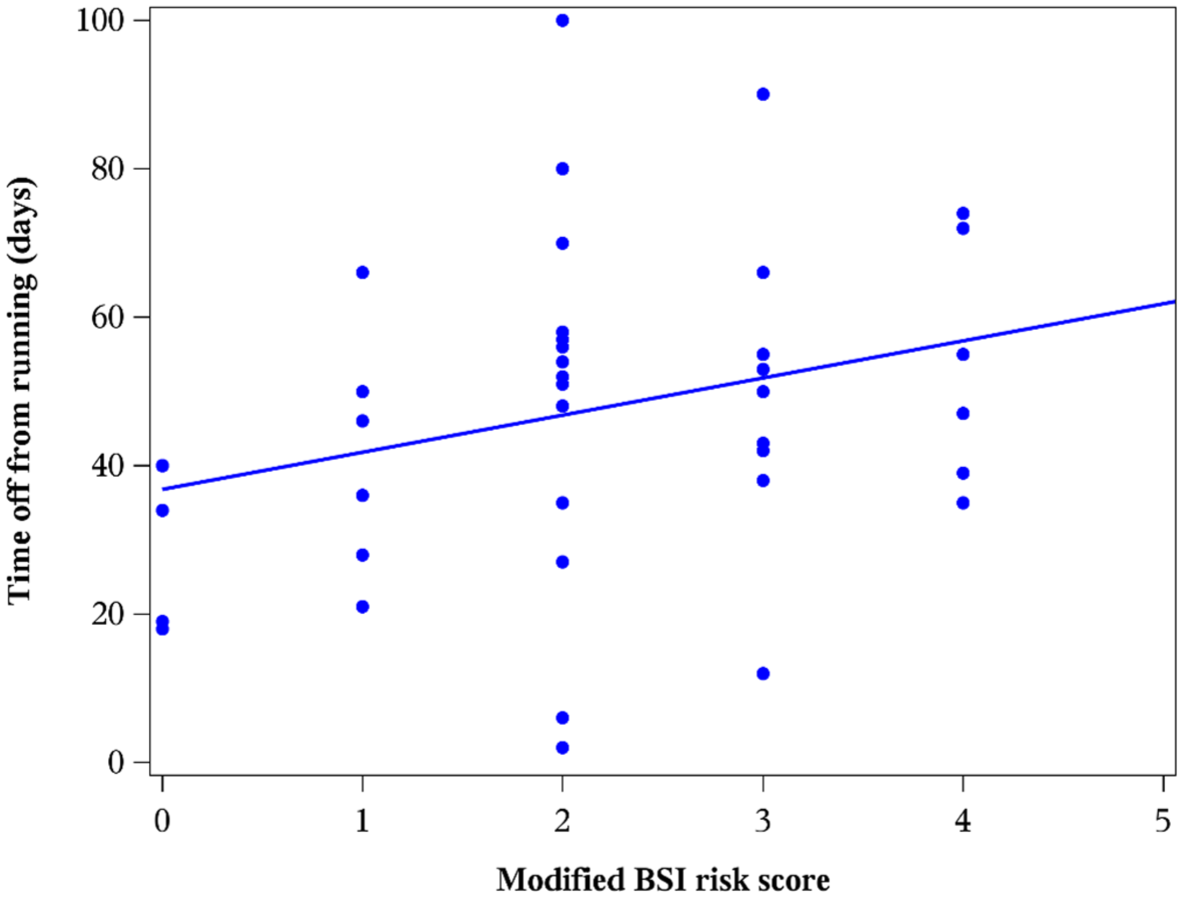
Scatterplot with standard linear regression line: return-to-running time (defined as duration in days from first clinical diagnosis to first ground run) stratified by modified bone stress injury (BSI) score in female athletes. Maximum score is 5 in men and 7 in women.
In regression models combining men and women, the modified BSI score was significantly associated with return-to-running times (Table 5). Every 1-point increase in the modified BSI score was associated with about an 8.5-day longer return-to-running time (P < .0001). In sex-stratified models, the effect was about 8.4 days (P < .0001) for women and 4.7 days (P = .0002) for men (Table 5). When considering the individual components of the modified risk score, bone type and bone location risk points had the strongest correlation with return-to-running times in women (Table 5), and MRI risk points and CRA risk points had the strongest correlation with return-to-running times in men (Table 5). A larger β-coefficient indicates a stronger correlation.
β-Coefficients From GEE Models With Time to Return to Running as the Dependent Variable a

All models include age, sex, and school as covariates or are stratified on sex. β-Coefficient units are in additional days of recovery per risk point. The general estimating equation (GEE) model accounts for the fact that multiple BSIs occurred in the same athletes. BSI, bone stress injury; CRA, cumulative risk assessment; MRI, magnetic resonance imaging.
However, the modified BSI score explained only a small fraction of the total variability in return-to-running times (Table 6). When combining men and women, the R2 value for a model containing just age, school, and sex was .076; this increased to .214 when the modified BSI score was added to the model. The modified BSI score also explained more of the variance in return-to-running times than MRI risk points alone for women but not for men (Table 6).
R 2 Values From GEE Models a

Time to return to running and C-statistics from general estimating equation (GEE) models, with return to running ≤8 weeks or >8 weeks, are the dependent variables. Base model contains age and school (and sex in the nonstratified model). The base model is compared with a model that additionally includes MRI risk points and with a model that includes the entire modified BSI risk score. BSI, bone stress injury; MRI, magnetic resonance imaging.
The results were similar when treating return-to-running times as a binary variable, ≤8 weeks versus >8 weeks (Table 6). Adding the modified BSI score to a model with only age, sex, and school moderately improved the C-statistic (discrimination ability), from .63 to .72. The modified BSI score also improved the C-statistic when compared with MRI risk points alone in women but not in men (Table 6).
Discussion
The modified BSI classification system is unique because it incorporates key factors related to BSIs: MRI grade, nutritional factors, anatomic bone location, and bone type (trabecular or cortical). Our modified BSI score was significantly associated with increased return-to-running times in both men and women. However, the modified BSI score explained only a small amount of the variance in time to return to running.
Compared with previous studies, we found a much smaller association between MRI grade and recovery times. In the study by Arendt et al, 2 the average time to return to full activity was 23.1 days for a grade 1 stress injury, 38.5 days for a grade 2 stress injury, 79.8 days for a grade 3 stress injury, and 100.1 days for a grade 4 stress injury. In the study by Nattiv et al, 18 for every 1-unit increase in MRI grade, time to full return to sport increased by approximately 48 days. In contrast, we found the average time to return to running increased just 4 days from grades 1/2 to grade 3 (7.8 weeks to 8.4 weeks) and just 10 days from grade 3 to grade 4 (8.4 weeks to 9.9 weeks).
It is unclear why MRI grade was a poorer predictor of recovery times in our study, but there may be several explanations. Our data suggest that MRI grade is only weakly related to return-to-running times. First, we had high variability in return-to-running times. High variability in running clearance times may also have reflected year-to-year variations in coaching staff, support staff, and training during the 7 years of this study. It is plausible that MRI grade explains only a fraction of this variability because many other variables played a role (including athlete and coach factors).9,10
Second, we used return-to-running times, whereas the other studies used return-to-sport times. Return to running was defined as the duration in days from the first clinical diagnosis to the first ground run. Return to sport in our population would be defined as return to competition-level activities.
Third, this study is larger than previous studies. Arendt et al 2 included 68 athletes who sustained 71 BSIs, and Nattiv et al 18 included 34 athletes with 61 BSIs, whereas our study included 83 athletes with 141 BSIs. The problem with small studies is that they are highly subject to random fluctuation. It is very easy to get an effect that is much larger than the true effect when you conduct a small study. These large effects tend to be published, and thus we expect that many large effects published from small studies are actually overestimates of the effect. Because this study was larger, it is less susceptible to random fluctuation and thus less likely to vastly overestimate the effect. Thus, what we are seeing here may be a more accurate estimate of the true effect of MRI grade on return-to-running times (ie, that effect may be smaller than previous studies suggested).
Fourth, the study populations were also different from previous studies: Arendt et al 2 included athletes from all different sports, and Nattiv et al 18 included both track and field and cross-country runners, whereas our study included only middle-distance and distance runners.
Adding CRA risk score, bone location, and bone type to MRI grade alone resulted in only a moderate improvement in predicting return-to-running times in women and no improvement in men. Additional studies will be needed to determine whether this system results in better prediction than MRI grade alone. The statistically significant value in Table 5 for CRA score in men indicates that the CRA score alone is predictive. However, it does not add anything once the MRI grade is already accounted for.
We found a longer return-to-running time in women than in men, with an average time of 65 days in women versus only 48 days in men. This finding may be related to men sustaining a decreased proportion of high-grade BSIs (18.6%) than women (23.7%). Men also had a lower proportion of high CRA risk scores. However, this finding has not been demonstrated in other studies. Nattiv et al 18 and Hoenig et al 13 did not find a significant sex difference in return-to-play times. Kunte et al 16 observed a higher incidence of stress fractures in female recruits, although recovery duration was not assessed.
In Table 6, the marginal R2 values were relatively low. However, there is no universally accepted threshold for what constitutes a “good” or “poor”R2 value, as interpretation is highly context dependent. R2 values can vary substantially across disciplines and model types. For example, in studies of human behavior, relatively low R2 values are common and may still be meaningful given the influence of numerous unmeasured factors. In contrast, studies conducted under tightly controlled laboratory conditions often report higher R2 values. Thus, the magnitude of R2 should be interpreted in relation to the research context, previous literature, and the inherent complexity of the outcome being modeled.
Limitations
The power of our study was limited by our sample size to determine differentiating factors of BSIs at specific anatomic locations. Our sample was also limited to collegiate middle-distance and distance runners and may not be applicable to other sports. Running is a more common mechanism of injury of BSIs compared with other activities such as jumping, kicking, and throwing a ball. 4
Conclusion
In evaluating our modified BSI classification system incorporating clinical factors (CRA), bone location, bone type, and MRI grade, the modified BSI classification score was associated with increased return-to-running times in both men and women, with female athletes taking longer to return to running. Among the individual components of the modified BSI classification system, MRI grade and CRA risk scores were most strongly associated with return to running in men, and bone location and bone type were most strongly associated in women. Adding CRA risk score, bone location, and bone type to MRI grade alone resulted in a moderate improvement in predicting return-to-running times in women, but adding these additional variables to MRI grade alone resulted in no improvement in men. Additional studies will be needed to determine whether this system results in better prediction than MRI grade alone. However, the variation in return-to-running times was high, and the modified BSI score explained only a small amount of this variance. Future research is needed to find a BSI classification system that includes clinical risk factors in combination with imaging and other factors that are more predictive of return-to-running times.
Footnotes
Acknowledgements
The authors thank Kristin Sainani, MS, PhD, Professor of Epidemiology and Population Health, Stanford University, Department of Epidemiology and Population Health, for performing the statistical analysis.
Final revision submitted September 15, 2025; accepted October 6, 2025.
The authors have declared that there are no conflicts of interest in the authorship and publication of this contribution. AOSSM checks author disclosures against the Open Payments Database (OPD). AOSSM has not conducted an independent investigation on the OPD and disclaims any liability or responsibility relating thereto.
Ethical approval for this study was obtained from Stanford University.