
Abstract
Background:
Golf-related lower extremity (LE) orthopaedic injuries are frequently seen in emergency departments (EDs) across the United States (US). This study analyzes trends in mechanisms and distribution of these injuries.
Hypotheses:
We hypothesized that (1) the LE injury incidence would increase from 2013 to 2022; (2) golf carts would be a significant injury mechanism; and (3) injury patterns would vary by age group.
Study Design:
Descriptive epidemiology study.
Methods:
The National Electronic Injury Surveillance System (NEISS) database was queried for all LE golf-related injuries presenting to US EDs from January 1, 2013, to December 31, 2022. National estimates (NE) were calculated utilizing the NEISS statistical sample weight for each hospital. Linear regressions were used to determine trends in injury patterns—including year, age group, body part, injury mechanism, diagnosis, and disposition.
Results:
There were 1949 golf-related LE injuries (NE = 97,492), with men accounting for 67.3% of cases. Injuries were highest among >60 years (49%) and 10 to 19-year-old golfers (11%). Most commonly involved LE body parts were the knee (n = 586; NE = 31,539; 32%), lower leg (n = 498; NE = 24,729; 25%), ankle (n = 453; NE = 21,860; 22%), and foot (n = 263; NE = 12,814; 13%). The most commonly identifiable mechanisms of injury were 38,889 cart-related (40%), 15,287 falls (16%), and 11,181 overuse injuries (11%). There was an increasing annual trend in LE injury involving golf carts (236 per year; P = .001). However, there was no statistically significant trend in overall golf-related LE injuries.
Conclusion:
Our study revealed that golf cart-related injuries accounted for a disproportionate percentage of LE golf injuries (40%). The lack of increase in overall LE injuries may reflect fewer non-golf cart-related injuries among an increasing pool of younger golfers. Preventive measures should target adolescents and those >60 years. Improved safety measures for golf cart use are also recommended.
Golf is enjoyed leisurely and competitively worldwide. The popularity of the sport has grown steadily over the past decade, and spiked with the onset of the coronavirus disease 2019 (COVID-19) pandemic in 2020. According to the National Golf Foundation, 2021 saw more rounds of golf played in the United States (US) than any previous year in history. 20 Similarly, the American Golf Industry Coalition claims 1 that 1 in 7 Americans played golf in 2022. Golf attracts players across all age groups, with a rapidly expanding cohort of younger participants. While more rigorous sports may preclude older players, studies have shown that enthusiasts tend to play golf more frequently with advancing age. 36
Although golf is considered a low-impact sport, it poses a significant lifetime risk of injury among amateurs.23,36 Lower extremity (LE) orthopaedic injuries are common and may account for up to 18% of all golf injuries. 43 The game involves a complex spectrum of biomechanics, repetitive motions, and is often played in unpredictable, if not inclement, weather conditions. Furthermore, undulating terrain, frequent on-course alcohol consumption, and a recent increase in novice players are contributing factors to increasing injury trends. 9
Despite the sport's continued popularity, a void exists in the literature regarding the incidence, characteristics, and mechanisms of LE orthopaedic injuries in the United States. Previous studies have utilized the National Electronic Injury Surveillance System (NEISS) to investigate golf-related orthopaedic injuries presenting to US emergency departments (EDs).4,10-12,15,16,19,22,25,32,34,40,42 Recent literature has primarily focused on injuries related to golf carts,4,11,15,19,22,25,35,41,42 or head injuries.25,35,41 In 2023, Twomey-Kozak et al 34 utilized the NEISS database to analyze upper extremity golf injuries from 2011 to 2020, but did not examine LE injuries. In 2017, Walsh et al 40 similarly used the NEISS database to analyze all golf-related injuries presenting to the ED from 1990 to 2011 at all body sites. However, the study did not include golf-cart-related injuries, which are an integral part of most modern golf courses. In the interest of injury prevention, a comprehensive assessment of golf injuries is necessary. The objective of this study was to strengthen the body of research by examining LE golf injuries presenting to the ED and their etiologies. We aimed to investigate factors associated with LE injuries, including sex, age, LE site, diagnoses, and mechanisms of injury. We hypothesized that the incidence of LE golf-related injuries presenting to US EDs would increase significantly from 2013 to 2022. We further hypothesized that injury patterns might differ across age groups, reflecting the wide demographic range of golf participants. We also postulated that golf-cart-related injury might represent a significant mechanism of LE injury.
Methods
The NEISS database, maintained by the Consumer Product Safety Commission, was utilized to analyze golf-related injuries. The NEISS is a statistically validated national public database containing ED visits from a representative 100 hospitals across the US, all of which have a minimum of 6 beds and 24-hour services. Each hospital is assigned a statistical sample weight to generate national estimates (NE) of injuries, which are calculated to represent injuries seen in over 5300 US hospital EDs.
The current dataset was constructed by querying all LE golf-related injuries presenting to US EDs from January 1, 2013, to December 31, 2022. The recorded data included diagnosis, body part, disposition, sex, age, and a brief narrative detailing the injury as described by the health care provider. Golf-related injuries were identified using the product code (1212). Golf-cart-related injuries were identified using their own product code (1213), and case narratives were utilized to exclude non-golf-related cart injuries (eg, golf-cart-related injuries occurring at home or at school). Other exclusions included mini-golf, insect bites, injury with golf equipment off the course, intentional acts of violence with golf equipment, and previous injuries that were exacerbated by golf.
Golf-related LE injuries included body part codes for the knee (35), lower leg (36), ankle (37), upper leg (81), foot (83), and toe (93). All available diagnoses and dispositions were included in the query. Age was collected in years, and all ages were included. Narratives were used to identify mechanisms of injury, which included cart-related injuries, trips, falls, walking, swinging, overuse, being hit by a club, being hit by a ball, or other causes, or unspecified. Overuse injuries were identified as LE injuries associated with multiple golf outings.
RStudio Software 2023.06.0+421 (Posit, PBC) was used for statistical analysis. Linear regression analysis was used to investigate trends across years and NE for overall injuries, diagnoses, and mechanisms of injury. Additional analyses, excluding data from 2020, allowed for the evaluation of the pandemic's influence. Statistical significance for linear regression was set at P < .05. The Fisher exact test with post-hoc Holm adjustment was utilized to compare injury incidence across different age groups. Statistical significance for the Fisher exact test was set at P < 0.01
Results
Between January 1, 2013, and December 31, 2022, a total of 1949 (NE = 97,492) ED-diagnosed golf-related LE injuries were reported. Among the cases included in our study, there were 1321 men (NE = 65,596; 67.3%) and 628 women (NE = 31,896; 32.7%). The mean age at presentation was 49.6 (± 25.8) years. There were 912 patients who did not specify race (NE = 48,321; 49.6%), 916 White patients (NE = 44,126; 45.3%), 85 Black patients (NE = 3324; 3.4%), 24 other race (NE = 1091; 1.1%), 9 Asian patients (NE = 404; 0.4%), 2 Native American/Alaskan Native (NE = 149; 0.2%), and 1 Native Hawaiian/Pacific Islander patient (NE = 78; 0.1%).
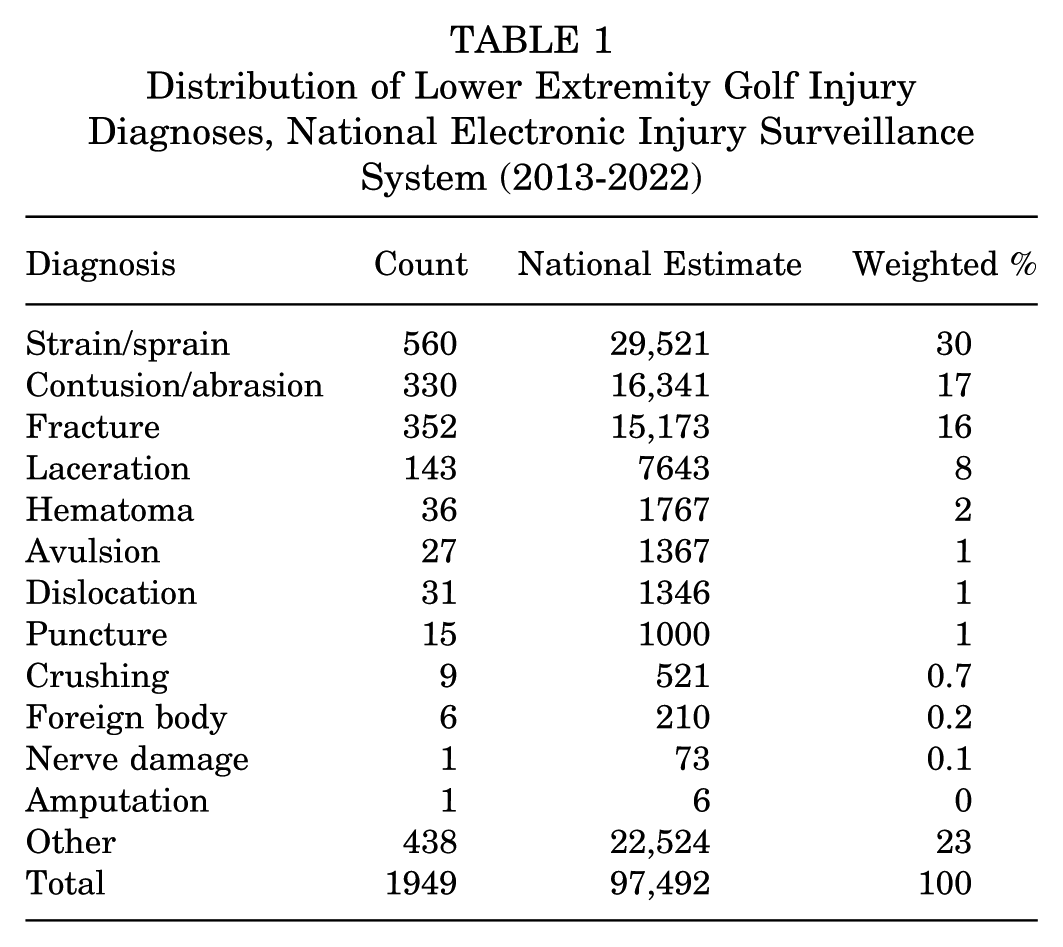
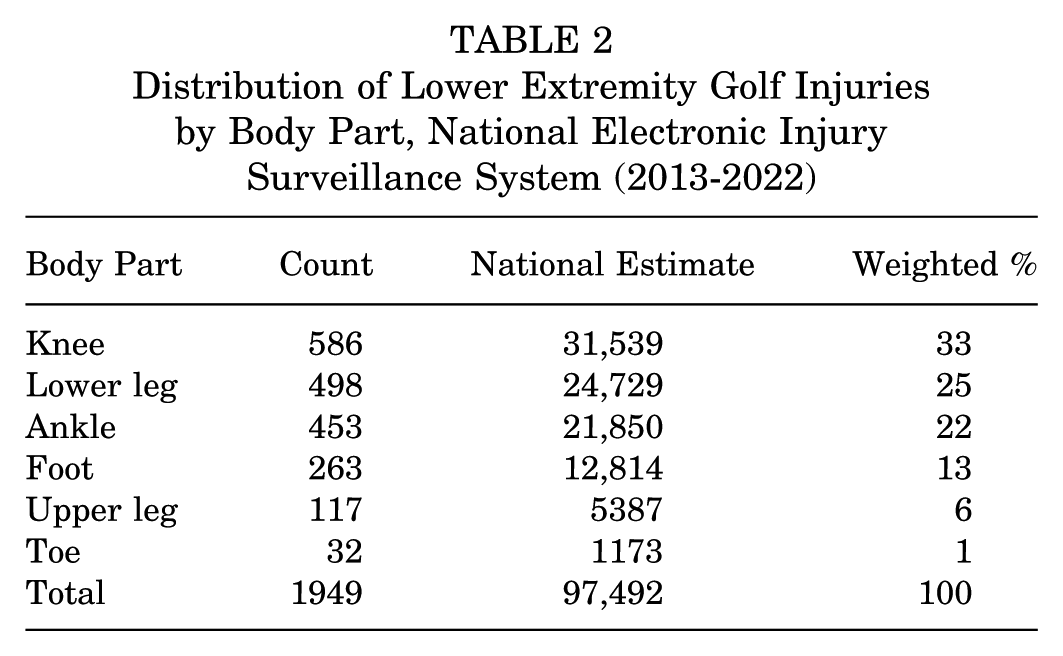
The most common identifiable LE diagnoses presenting to the ED were strains/sprains (NE = 29,521; 30%), contusions/abrasions (NE = 16,341; 17%), fractures (NE = 15,173; 16%), and lacerations (NE = 7643; 8%) (Table 1). The most common LE body parts involved were the knee (NE = 31,539; 33%), lower leg (NE = 24,729; 25%), ankle (NE = 21,850; 22%), and foot (NE = 12,814; 13%) (Table 2). Frequent knee injury diagnoses included strains/sprains (NE = 12,642; 40%), contusions/abrasions (NE = 5665; 18%), and lacerations (NE = 1342; 4%). Prevalent lower leg injury diagnoses included contusions/abrasions (NE = 4228; 17%), fractures (NE = 4185; 17%), and lacerations (NE = 4149; 17%). The most common identifiable ankle injury diagnoses included sprains/strains (NE = 9203; 42%), fractures (NE = 6278; 29%), and contusions/abrasions (NE = 1950; 9%). The most common sites of fracture were the ankle (NE 6278; 41%), lower leg (NE = 4185; 28%), and foot (NE = 2404; 16%) (Table 3).
Distribution of Lower Extremity Golf Injury Diagnoses, National Electronic Injury Surveillance System (2013-2022)
Distribution of Lower Extremity Golf Injuries by Body Part, National Electronic Injury Surveillance System (2013-2022)
Distribution of Lower Extremity Golf Fractures, National Electronic Injury Surveillance System (2013-2022)

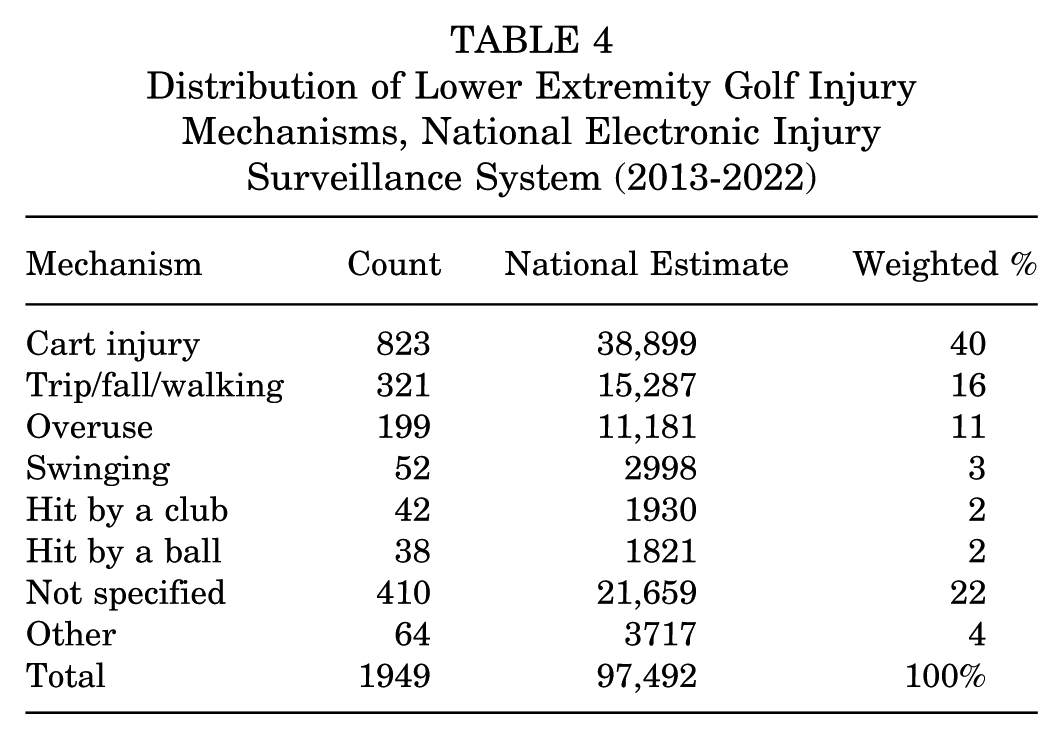
Mechanisms of injury were identified by reviewing narratives associated with each injury. The most common identifiable mechanisms of LE golf injury included cart injury (NE = 38,899; 40%), trip/fall/walking injury (NE = 15,287; 16%), overuse injury (NE = 11,181; 11%), and swinging injury (NE = 2998; 3%) (Table 4). The top 3 mechanisms of knee golf injury were cart injury (NE = 8049; 26%), overuse injury (NE = 5591; 18%), and trip/fall/walking injury (NE = 4542; 14%). The 3 most common identifiable mechanisms of lower leg injury were cart injury (NE = 11,648, 47%), trip/fall/walking injury (NE = 3047; 12%), and overuse injury (NE = 2648; 11%). Ankle injuries were most commonly associated with cart injury (NE = 9317; 43%), trip/fall/walking injury (NE = 4941; 23%), and overuse injury (NE = 947; 4%).
Distribution of Lower Extremity Golf Injury Mechanisms, National Electronic Injury Surveillance System (2013-2022)
Golf cart injuries were most commonly associated with diagnoses involving contusions/abrasions (NE = 11,835; 30%), fractures (NE = 8847; 23%), and strains/sprains (NE = 6268; 16%). Diagnoses identified to be commonly associated with trip/fall/walking injury included strains/sprains (NE = 5380; 35%), fractures (NE = 4370; 29%), and contusions/abrasions (NE = 1,621; 11%). Diagnoses commonly associated with overuse injury include strains/sprains (NE = 2694; 24%), fractures (NE = 146; 1%), and contusions/abrasions (NE = 138; 1%).
Among the reviewed injuries, 1760 patients (NE = 89,337; 92%) were not admitted to the hospital, while 189 (NE = 8156; 8%) were accepted. Of those who did not require admission, 1749 patients (NE = 88,935; 91%) were treated and released, or examined and released without treatment, and 11 (NE = 402; 0.5%) left without being seen. For patients requiring admission, 169 (NE = 7259; 7%) were treated and admitted, 16 (NE = 765; 1%) were treated and transferred to another hospital, and 4 (NE = 132; 0.5%) were held for observation.
Stratifying injuries by age, individuals >60 years (NE = 477,717; 49%), and individuals aged 10 to 19 years (n = 304; NE = 12,604; 13%) were the most frequently injured age groups (Figure 1). The 3 most common identifiable mechanisms of injury in patients >60 years were cart injuries (NE = 12,006, 25%), trip/fall/walking injuries (NE = 9708; 20%), and overuse injuries (NE = 7948; 17%). Similarly, the top 3 most common identifiable mechanisms of injury in patients 10 to 19 years were cart injuries (NE = 10,317; 82%), trip/fall/walking injuries (NE = 462; 4%), and swinging injuries (NE = 269; 2%) (Figure 2). Common diagnoses associated with the >60 years old age group were strain/sprain (NE = 16,209; 34%), fractures (NE = 6692; 14%), and contusion/abrasion (NE = 4357; 9%). Common diagnoses associated with the 10–19-year-old age group were contusions/abrasions (NE = 4635; 37%), strains/sprains (NE = 2349; 19%), and fractures (NE = 1851; 15%). Cart injuries made up a significantly greater percentage of total injuries in those 10 to 19 years (82%) compared with those >60 years (25%) (P < .01) (Figure 2). However, trip/fall/walk and overuse injuries made up a greater proportion of total injuries in those >60 years (20% and 17%, respectively) compared with those 10 to 19 years (4% and 1%, respectively) (P < .01) (Figure 2).

Total lower extremity golf injury national estimates by age group (2013-2022).
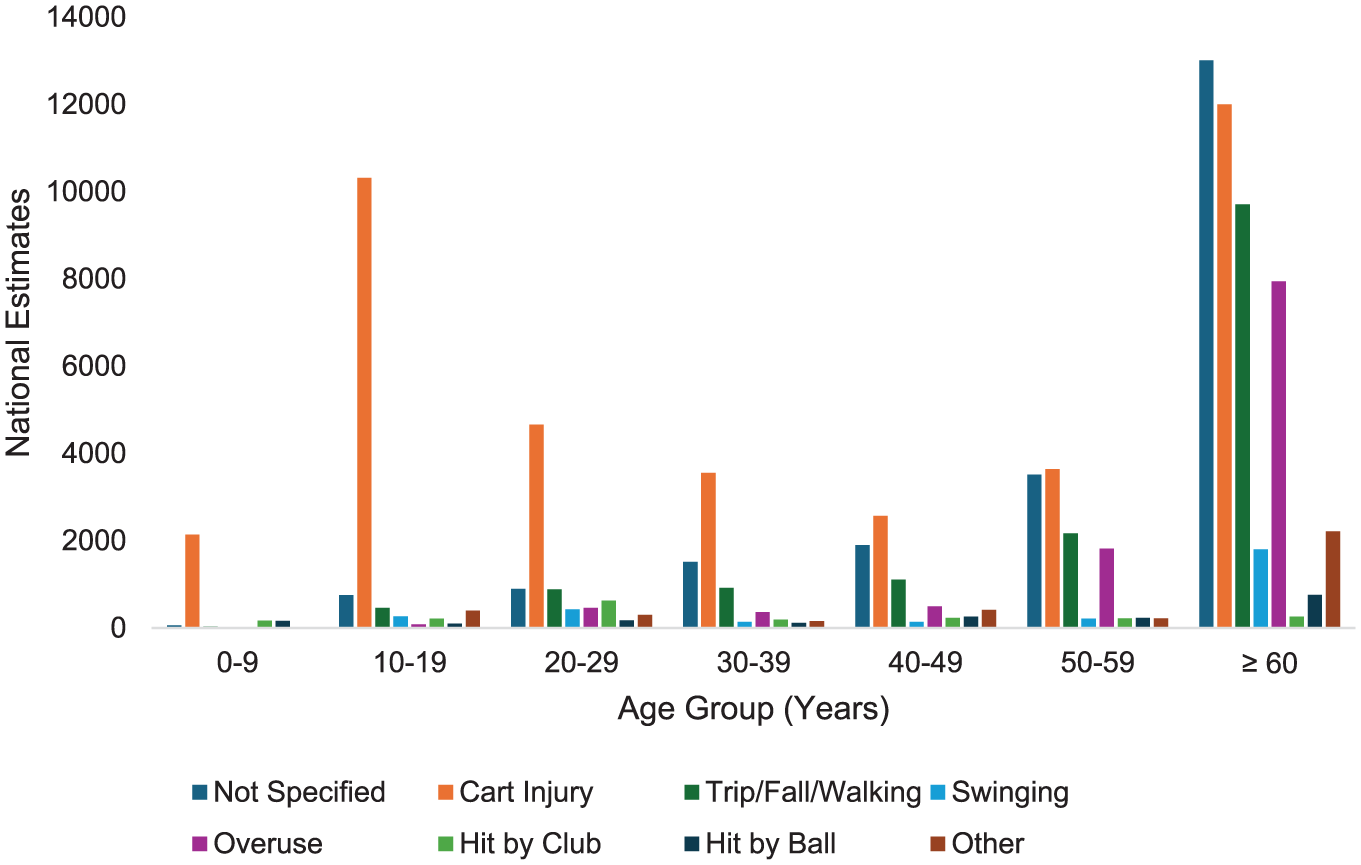
Lower extremity golf injury mechanism national estimates by age group (2013-2022).
The overall injury rate involving golf carts showed an increasing annual trend of 236 LE injuries per year (P = .001) (coefficient = 236 [95% CI, 126 to 345]) (Figure 3). However, there was no significant increase in overall injury rate (P = .076) (coefficient = 249 [95% CI, –32 to 530]) (Figure 4). Similarly, all other mechanisms of injury showed no significant increases in injury rate. Contusion showed an increasing annual trend of 83 LE injuries per year as demonstrated by linear regression (P = .029) (coefficient = 83 [95% CI, 11 to 115]). All other diagnoses showed no significant change over time.

Golf-cart-related lower extremity golf injury national estimates by year (2013-2022).

Total lower extremity golf injury national estimates by year (2013-2022).
Discussion
The major findings of our review demonstrated that LE golf-related injuries presenting to US EDs significantly increased from 2013 to 2022 (P < .001), despite fluctuations in annual injury incidence. A total of 67% and 33% of injuries were observed in men and women, respectively. The most common site of LE injury was the knee (35%), followed by the ankle (24%) and the foot (20%). Golf carts were the most frequent mechanism of LE injuries (40%), followed by trip/fall/walk injuries (16%) and overuse (11%). Adults aged 60 and older (49%) and individuals aged 10 to 19 years (13%) were the most frequently injured age groups, with 25% and 82% of their injuries, respectively, ascribed to golf cart incidents.
The National Golf Foundation reported 20 that golf's overall participation base in the US increased from 32 million in 2016 to 41.1 million in 2023. Predictably, previous research revealed a steady increase in golf-related injuries over time. 40 The investigation was the first study to report the incidence of golf-related LE diagnoses and mechanisms of injury presenting to US EDs. While the increase in golfers may portend an increased LE injury rate, this study did not demonstrate a significant increase in overall LE injuries; furthermore, only 8% of patients seen required admission.
Male golfers experienced a higher incidence of LE injuries compared with female golfers seeking treatment at the ED. The National Golf Foundation reported 12 an increase in the number of women who are participating in golf from 23% in 2018 to 26% in 2023. Women represented 33% of the population in the present study. Previous literature has similarly found men to be injured disproportionately more frequently compared with women in golf-related contexts.2,3,6,7,9,20,40
The most common golf-related LE injuries were sprains/strains, contusions/abrasions, and fractures, primarily affecting the knee, lower leg, and ankle. Golf cart incidents, trip/fall/walking injuries, and overuse were the leading mechanisms of injuries. These LE findings from the present study align with the upper extremity results from Twomey-Kozak et al, 34 who also found golf cart injuries and trip/fall/walking injuries to be the most common mechanisms of upper extremity golf injuries. However, the data differ in that overuse injury was a prevalent mechanism of lower extremity injury (11%), while it was uncommon in cases of upper extremity injury 34 (1.93%).
Consistent with results from previous studies,2,3,6,7,9,19,39 the present study found a bimodal age distribution of injury patterns, with 2 predominant peaks observed among individuals aged 10 to 19 years and those >60 years (Figure 1). Twomey-Kozak et al 34 explain this bimodal distribution as an increase in injury incidence due to increased free time to participate in golf at both younger and older ages. Furthermore, older participants are more fragile and prone to injury. 19
While previous literature has studied general golf-cart-related injuries, our study is the first to report the incidence of golf-cart-related LE injuries over time on the golf course.4,11,15,19,22,25,35,42 Our study revealed that although there was no significant change in overall golf LE injuries from 2013 to 2022, there was a significant increase of an estimated 236 LE golf-cart related injuries per year presenting to US EDs over the same study period.
The increase in golf-cart-related injuries is consistent with the increase in golfers over the study period. While the present study showed no significant increase in overall LE injuries, given the recent increase in golfers, the lack of an increase in overall LE injuries may reflect a decrease in the incidence of non-golf cart-related injuries per capita. One explanation for this potential decrease in LE injuries per capita is the increase in younger golfers. In fact, our study found that nongolf cart-related injuries occurred in only 18% of cases among golfers aged 10 to 19 years old, compared with 68% in all golfers >20 years old. The National Golf Foundation reported a decrease in the mean age of golf participants between 2018 and 2023, from 44.6 to 43.5 years old, which includes >1 million new golfers aged ≤18 years. 12 Younger golfers may be less susceptible to injury due to their increased agility and athleticism.
Injuries related to golf carts emerged as the predominant identifiable cause of injury across all age groups. Golf carts have become an indispensable feature of most golf courses nationwide, enabling older people or those with mobility issues to play the game expeditiously. While applauded for their convenience and ease of use, golf carts often lack essential safety features, such as seatbelts. They are frequently loaned to golfers with minimal regulations and safety education. The rules of the road, such as no alcohol consumption, age restrictions, or texting while driving, are not enforced on the golf course. Coupled with variable weather and course conditions, golf cart usage, especially in the hands of inexperienced or impaired drivers, may be unacceptably dangerous. McGwin et al 22 attribute an increased injury incidence in younger golf-cart users due to a lack of driving experience, in addition to immaturity associated with adolescence. Older golf cart users may be at increased risk of injury due to physical or cognitive limitations that impair the safe operation of the vehicle. 22 As the sport gains in popularity among younger golfers and retirees, further interventions to ensure proper golf cart use on the course should be implemented.
The present study found that trip/fall/walking injuries comprised 16% of LE golf injuries. Similarly, a 2005 study found that 10.8% of golf injuries occurred while walking. 38 Including golf-cart related injuries, which comprise 40% of injuries, a cumulative 56% of LE golf injuries from the current study were found to occur between shots, while maneuvering around the course. This suggests that the greatest risk for LE injury in golf is not through impact with the ball or club, but rather from navigating the course itself. Trip/fall/walking injuries comprised 20% of LE injuries in those >60 years old, whereas they only comprised 4% in those 10 to 19 years old. In addition to a higher injury risk due to weaker musculature, the elderly may be more inclined to walk the golf course for exercise rather than riding a golf cart as a form of physical activity.5,6 This age group may benefit from proper footwear while golfing to prevent falls.
Overuse injury is most commonly seen in professional golfers due to excessive play.8,21,26,27,33,38 Overuse injury was the third most common mechanism of LE injury and comprised 11% of the data in the present study. Overuse injury comprised 17% of LE injuries in those >60 years old and only 1% in those 10 to 19 years old. The repetitive actions involved in golf may increase the risk of injury for amateurs, especially those new to the sport who suddenly engage in extensive play.18,39 This risk appears to be increased in older individuals, possibly due to a lack of athleticism and weaker musculature. Amateurs who have deficiencies in their mechanics are more likely to try to compensate with brute force, often leading to the musculoskeletal system being placed in compromised positions.2,8,21,24,28,33,38 While less common, acute traumatic LE injuries related to the swing still impact many golfers. The least common mechanisms of injury include impact with a ball or club. These findings are consistent with those of Walsh et al, 40 who describe the effects of a club as most likely to affect the head/neck region, rather than the lower extremity. 17
Limitations
This study has multiple limitations. First, the usage of the NEISS database is limited to ED data, which does not entirely represent the total incidence range of golf injuries. While the present study likely gives a trauma-informed representation of golf injuries in the US, many nontraumatic golf injuries may not present to the ED. Many patients may opt to consult their primary care provider, an outpatient orthopedist, or seek urgent care, or they may not seek medical care at all. The missing data from the study makes it difficult to assess the overall incidence and nature of LE golf injuries. Second, while our study identifies golf carts as the most common mechanism of LE injury, we were unable to assess changes in golf cart usage over time, as the NEISS database does not capture this information. It is plausible that golf cart use has increased over the past decade, which may partly explain the rising incidence of cart-related injuries. However, in the absence of this information, we cannot determine whether this reflects a true increase in injury risk or widespread cart usage; therefore, further research on this topic may be necessary. Third, many of the mechanisms were not specified (22%), which may have influenced the overall findings of the study. However, the proportion of mechanisms not specified is similar to that of NEISS studies across various sports.13,14,17,26,27,29-31,37 Surgical intervention, time away from play, and long-term outcomes were not able to be evaluated, which limited the ability to gauge injury severity. Additionally, information such as golfing frequency, skill level, fitness level, equipment used, and other comorbidities that may increase the risk of injury was not available. Furthermore, alcohol consumption and its correlation with injury also require assessment. Golf is one of the few recreational sports where the consumption of alcohol is regularly seen. 9 Lastly, while NEISS did collect data on alcohol consumption, the data were deemed incomplete and were not included in this analysis.
In the future, it is important to continue tracking the incidence of golf injuries over time. As the sport continues to grow and courses become more crowded, golf injuries should be closely monitored to maintain a safe environment for all golfers. Analysis of the effect of alcohol consumption on golf-related injuries is an important variable to investigate. Furthermore, studies quantitatively and qualitatively evaluating chronic overuse golf-related injuries incurred while practicing are needed to guide physician and patient expectations.
Conclusion
The present study found a statistically significant increasing trend in annual golf-cart-related LE golf injuries, comprising 40% of all such LE injuries presenting to US EDs. This is primarily attributed to the increased popularity of the sport, particularly among younger people. These findings underscore the importance of targeted injury prevention efforts, particularly among adolescents and older adults. Nationwide implementation of improved safety protocols for golf cart use on courses should also be considered.
Footnotes
Final revision submitted July 3, 2025; accepted August 11, 2025.
One or more of the authors has declared the following potential conflict of interest or source of funding: D.P.T. has received a grant from Arthrex, hospitality payments from Arthrex and Gotham Surgical Solutions and Devices, Inc; and support for education from Arthrex and Smith & Nephew. AOSSM checks author disclosures against the Open Payments Database (OPD). AOSSM has not conducted an independent investigation on the OPD and disclaims any liability or responsibility relating thereto.
Ethical approval was not sought for the present study.