
Abstract
Background:
About 7% of injuries in the Major League Baseball (MLB) involve the hand. Fractures of the hand are not uncommon in professional baseball players while fielding or from being hit by a pitch while batting; however, the outcomes of professional baseball players treated both operatively and nonoperatively are unclear.
Purpose/Hypothesis:
The purpose of this study was to report the return-to-sport (RTS) rate, RTS time, and performance outcomes in professional baseball position players who sustained a hand fracture. The secondary purpose was to compare outcomes between positions and between operatively versus nonoperatively treated players. It was hypothesized that there would be a high RTS rate (>80%) after hand fractures, with no significant decline in offensive performance after RTS.
Study Design:
Cohort study; Level of evidence, 3.
Methods:
The MLB Health and Injury Tracking System database was queried for all Major League and Minor League position players who sustained a metacarpal fracture or phalangeal fracture of any digit from 2011 to 2022. The primary outcomes of interest were RTS rate, RTS time from injury, and offensive performance statistics such as batting average and on-base percentage up to 1 year after injury. RTS outcomes were compared based on player position and operative versus nonoperative treatment.
Results:
There were 801 professional baseball position players included, with 156 (19.5%) players treated operatively. Overall, 654 of 801 (81.6%) players were able to RTS at a mean of 58 ± 47 days from injury. Outfielders, infielders, and catchers were able to RTS at similar rates (84% vs 81% vs 80%; P = .440) and in a similar amount of time (58 vs 58 vs 56 days; P = .893). Players treated operatively versus nonoperatively were able to RTS at similar rates (83% vs 82%; P = .740); however, players treated operatively required more time to RTS (86 vs 51 days; P < .001). No significant differences in performance were observed when comparing preinjury to 1 year after injury.
Conclusion:
Players treated operatively did require more time to RTS (86 vs 51 days); however, RTS rate did not differ between operatively versus nonoperatively treated players. At 1 year after injury, players performed similarly compared to preinjury baseline regardless of player position or type of treatment.
The Major League Baseball (MLB) season is rigorous, with 162 regular-season games extending over half of the year, placing players at risk for both acute and chronic injuries. 8 Professional baseball players are at risk of hand fractures throughout the season due to hit-by-pitches while batting as well as from contact with the ground, wall, another player, or ball while base running or fielding. While many hand fractures can be treated nonoperatively, a minority of hand fractures require surgery. 1 The optimal treatment of hand fractures in athletes and especially professional baseball players is currently unclear,2,5 and is of utmost importance to baseball players due to the importance of hand mobility and strength throughout throwing and hitting.
About 7% of total injuries in the MLB from 2010 to 2016 involved the hand. 4 In a recent analysis of hand injuries in the MLB and Minor League Baseball across a 6-year period, there were 4478 hand injuries reported, resulting in 67,036 days missed. 10 The frequency of required surgery for these hand injuries was low at only 4.5%. 10 However, this included all hand injuries, from fracture dislocations to superficial blisters, highlighting the importance of better isolating specific hand injuries.
Using data from press releases, injury reports, and player profiles, Pagani et al 7 identified 24 MLB players who experienced a metacarpal fracture. They then analyzed and reported on treatment modalities and postinjury performance metrics. Patients treated nonoperatively did experience a significant decline in the wins above replacement 2 seasons after injury compared with the control cohort; however, all other performance metrics did not differ between patients treated operatively compared to a cohort of players treated nonoperatively who were matched by player position, age, body mass index (BMI), career experience, and preinjury performance statistics. 7 To better clarify the effect of hand fractures in MLB players and how these injuries affect return to sport (RTS) and performance, a larger study is warranted.
Therefore, the purpose of this study was to report the RTS rate, RTS time, and performance outcomes in professional baseball position players who sustained a hand fracture. The secondary purpose was to compare the outcomes between positions and between operatively versus nonoperatively treated players. The authors hypothesized that there would be a high RTS rate after hand fractures, with no significant decline in offensive performance after RTS.
Methods
Inclusion and Exclusion Criteria
This retrospective cohort study was deemed exempt from approval by our institutional review board (Thomas Jefferson University No. 2023-1798) before data collection. The MLB Health and Injury Tracking System (HITS) database was queried for all Major League and Minor League position players who sustained a metacarpal fracture or phalangeal fracture of any digit from 2011 to 2022. Position players were excluded if the mechanism of injury was non–work related, or if the injury occurred within 1 year of data collection. Designated hitters were also excluded from the study due to lack of sample size (n = 3).
Data Collection
The demographics collected on each player were age, BMI, player position, mechanism and location of injury, operative versus nonoperative treatment, and level of play. The primary outcomes of interest were ability to RTS, time until RTS after injury, and the following performance outcomes: batting average (AVG), on-base percentage (OBP), slugging percentage (SLG), and on-base plus slugging percentage (OPS). Performance outcomes were pooled at preinjury as well as the following postinjury time points: 1 week, 2 weeks, 1 month, 3 months, and 1 year. Preinjury performance was determined based on 1 year before injury.
Statistical Analysis
Outcomes were reported across the full study cohort, and subanalyses comparing outfielders versus infielders versus catchers, as well as operative versus nonoperative treatment, were also included. Data analysis of qualitative variables (demographics and RTS rate) was performed using chi-square analyses, and analysis of quantitative variables (BMI and RTS time) was performed using the Student t test. Performance outcomes were initially compared throughout the 1-year postinjury timeline using analysis of variance (ANOVA). Statistically significant findings from the initial ANOVA were then followed up with Student t test to directly compare the preinjury and 1-year postinjury time points. P values <.05 were deemed significant. All statistical analyses were done using RStudio (Version 3.6.3; Posit).
Results
There were 981 professional baseball players considered for inclusion, with 20 excluded due to non–work-related fractures and 160 pitchers excluded. Overall, 801 professional baseball position players were included from 2011 to 2022 with 263 outfielders, 352 infielders, and 186 catchers. The most common injury mechanisms were batting (49%) and fielding (29%), while the metacarpal (50%) and distal phalanx (19%) were the most common locations of fracture (Table 1).
Demographics of Professional Position Players With Hand Fractures, as Well as Those Treated Operatively Versus Nonoperatively a
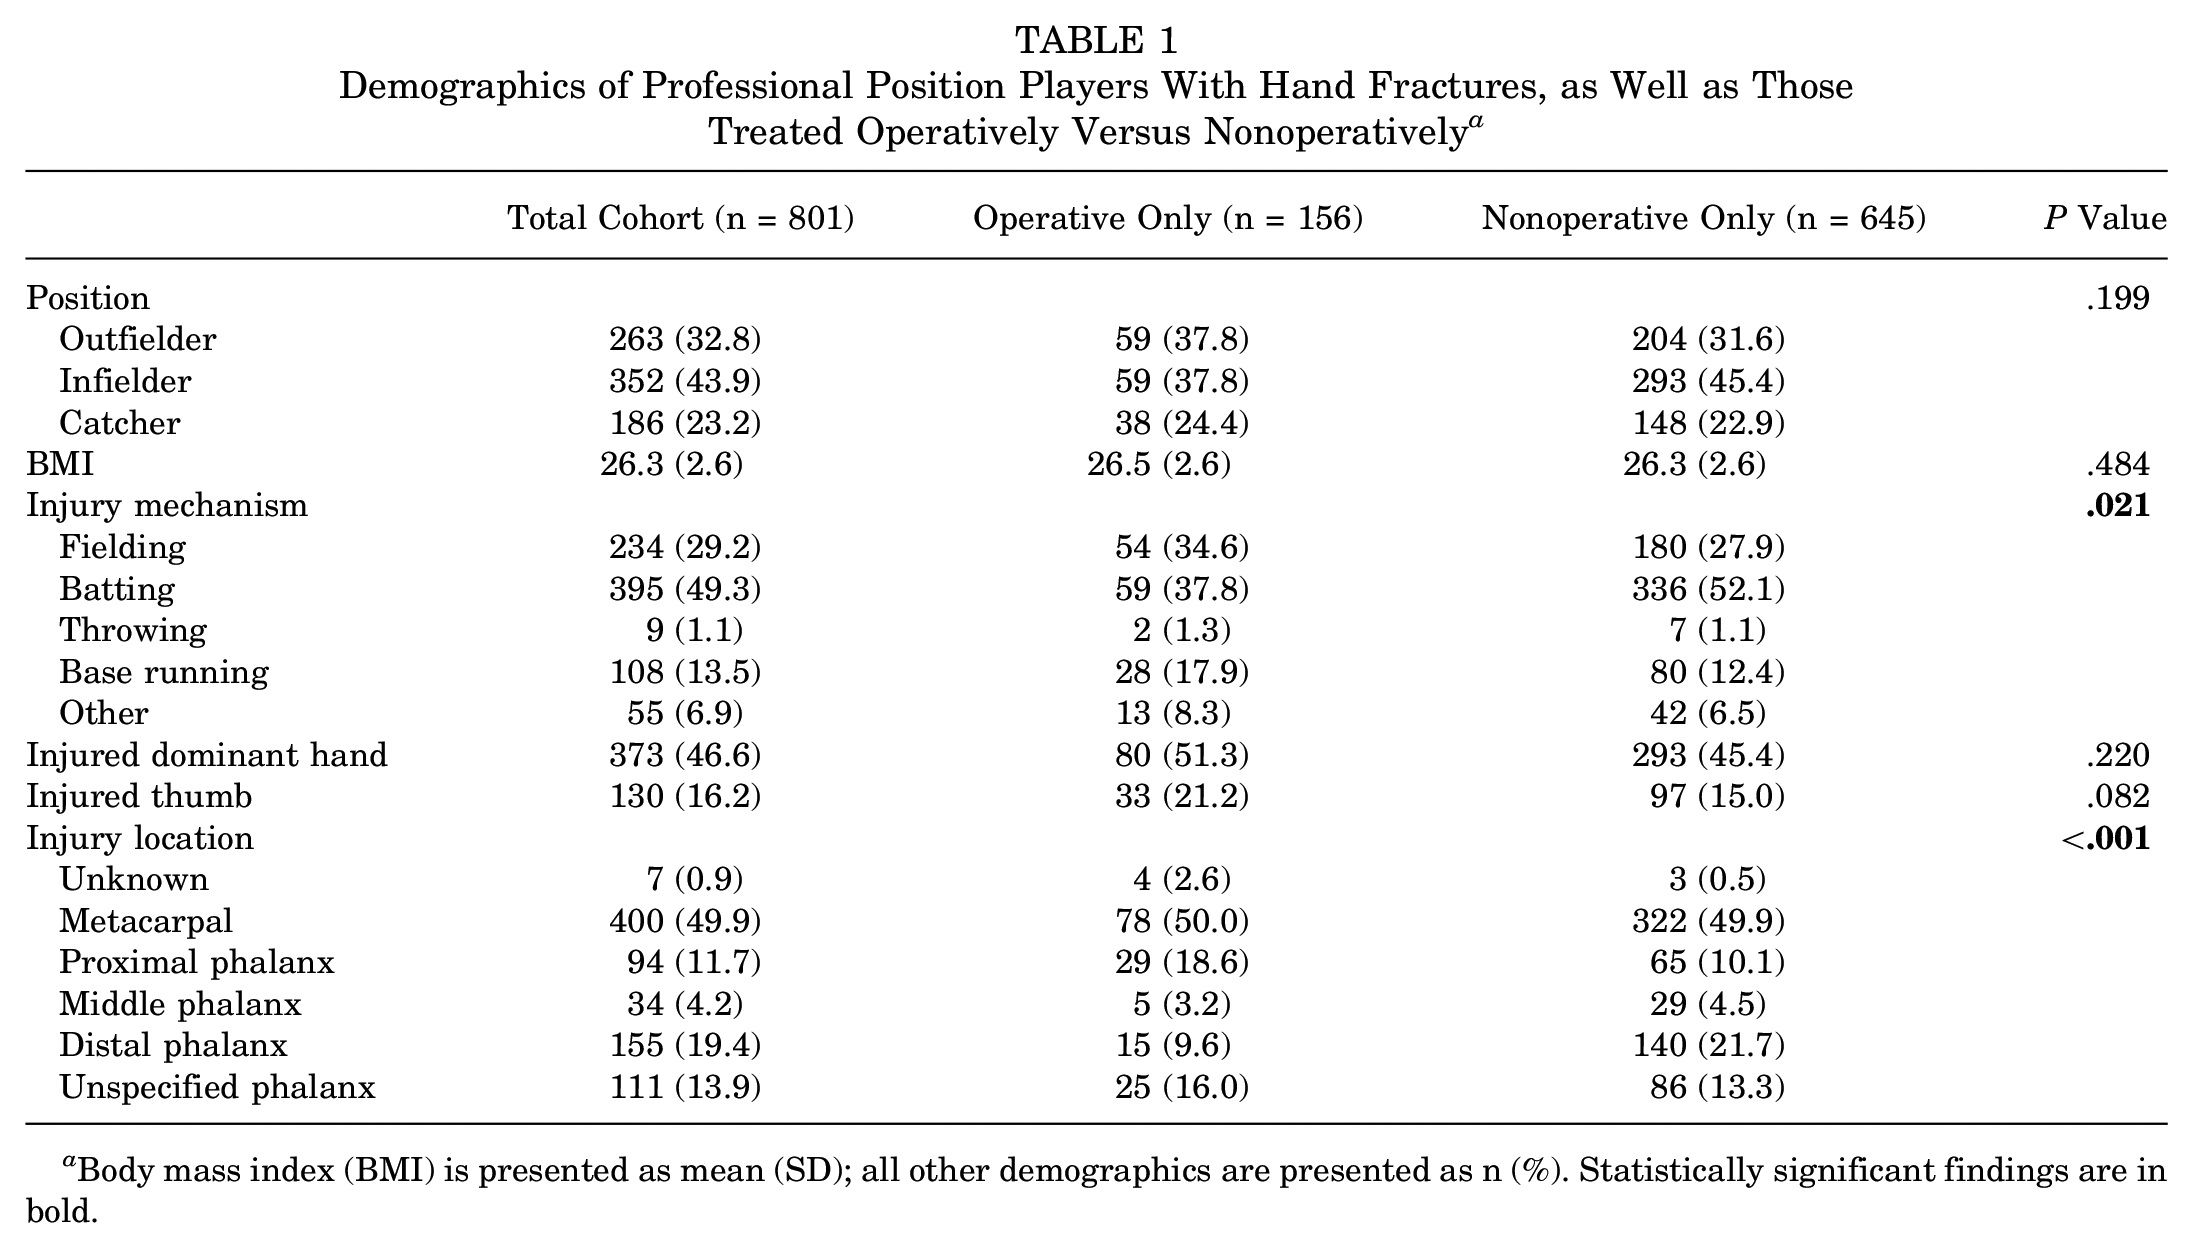
Body mass index (BMI) is presented as mean (SD); all other demographics are presented as n (%). Statistically significant findings are in bold.
There were 156 (19.5%) players who were treated operatively and 645 treated nonoperatively (Table 1). Players who underwent operative treatment were more likely to experience fracture while fielding (35% vs 28%) and less likely while batting (38% vs 52%) (P = .021). Also, players who underwent operative treatment were more likely to fracture their proximal phalanx (19% vs 10%) and less likely to fracture their distal phalanx (10% vs 22%) (P < .001).
Overall, 654 of 801 (81.6%) players were able to RTS at a mean of 57.7 ± 46.7 days after injury. Performance outcomes were found to differ throughout 1 year after injury (Table 2); however, AVG (P = .447), OBP (P = .132), SLG (P = .820), and OPS (P = .460) did not differ when directly comparing preinjury to 1-year postinjury performance.
Performance Outcomes Throughout 1 Year After Fracture a

Data are presented as mean (SD). Statistically significant findings are in bold. AVG, batting average; OBP, on-base percentage; OPS, on-base plus slugging percentage; SLG, slugging percentage.
Outfielder Versus Infielder Versus Catcher
Outfielders, infielders, and catchers were able to RTS at similar rates (84% vs 81% vs 80%; P = .440) and in a similar amount of time (58 vs 58 vs 56 days; P = .893) (Table 3).
Return-to-Sport Rate and Time Between Outfielders Versus Infielders Versus Catchers a

Return-to-sport time is presented as mean (SD).
For outfielders, all performance outcomes were found to differ throughout 1 year after injury (Table 4); however, AVG (P = .367), OBP (P = .248), SLG (P = .819), and OPS (P = .545) did not differ when directly comparing preinjury to 1-year postinjury performance. For infielders only, OBP was found to differ throughout 1 year after injury (P = .027), but OBP did not differ when directly comparing preinjury to 1-year postinjury performance (P = .589). No significant differences in performance were seen for catchers throughout 1 year after injury.
Performance Outcomes Throughout 1 Year After Fracture in Outfielders Versus Infielders Versus Catchers a

Data are presented as mean (SD). Statistically significant findings are in bold. AVG, batting average; OBP, on-base percentage; OPS, on-base plus slugging percentage; SLG, slugging percentage.
Operative Versus Nonoperative
Players treated operatively versus nonoperatively were able to RTS at similar rates (83% vs 82%; P = .740); however, players treated operatively required more time to RTS (86 vs 51 days; P < .001) (Table 5).
Return-to-Sport Rate and Time Between Players Treated Operatively Versus Nonoperatively a

Return-to-sport time is presented as mean (SD). Statistically significant differences are in bold.
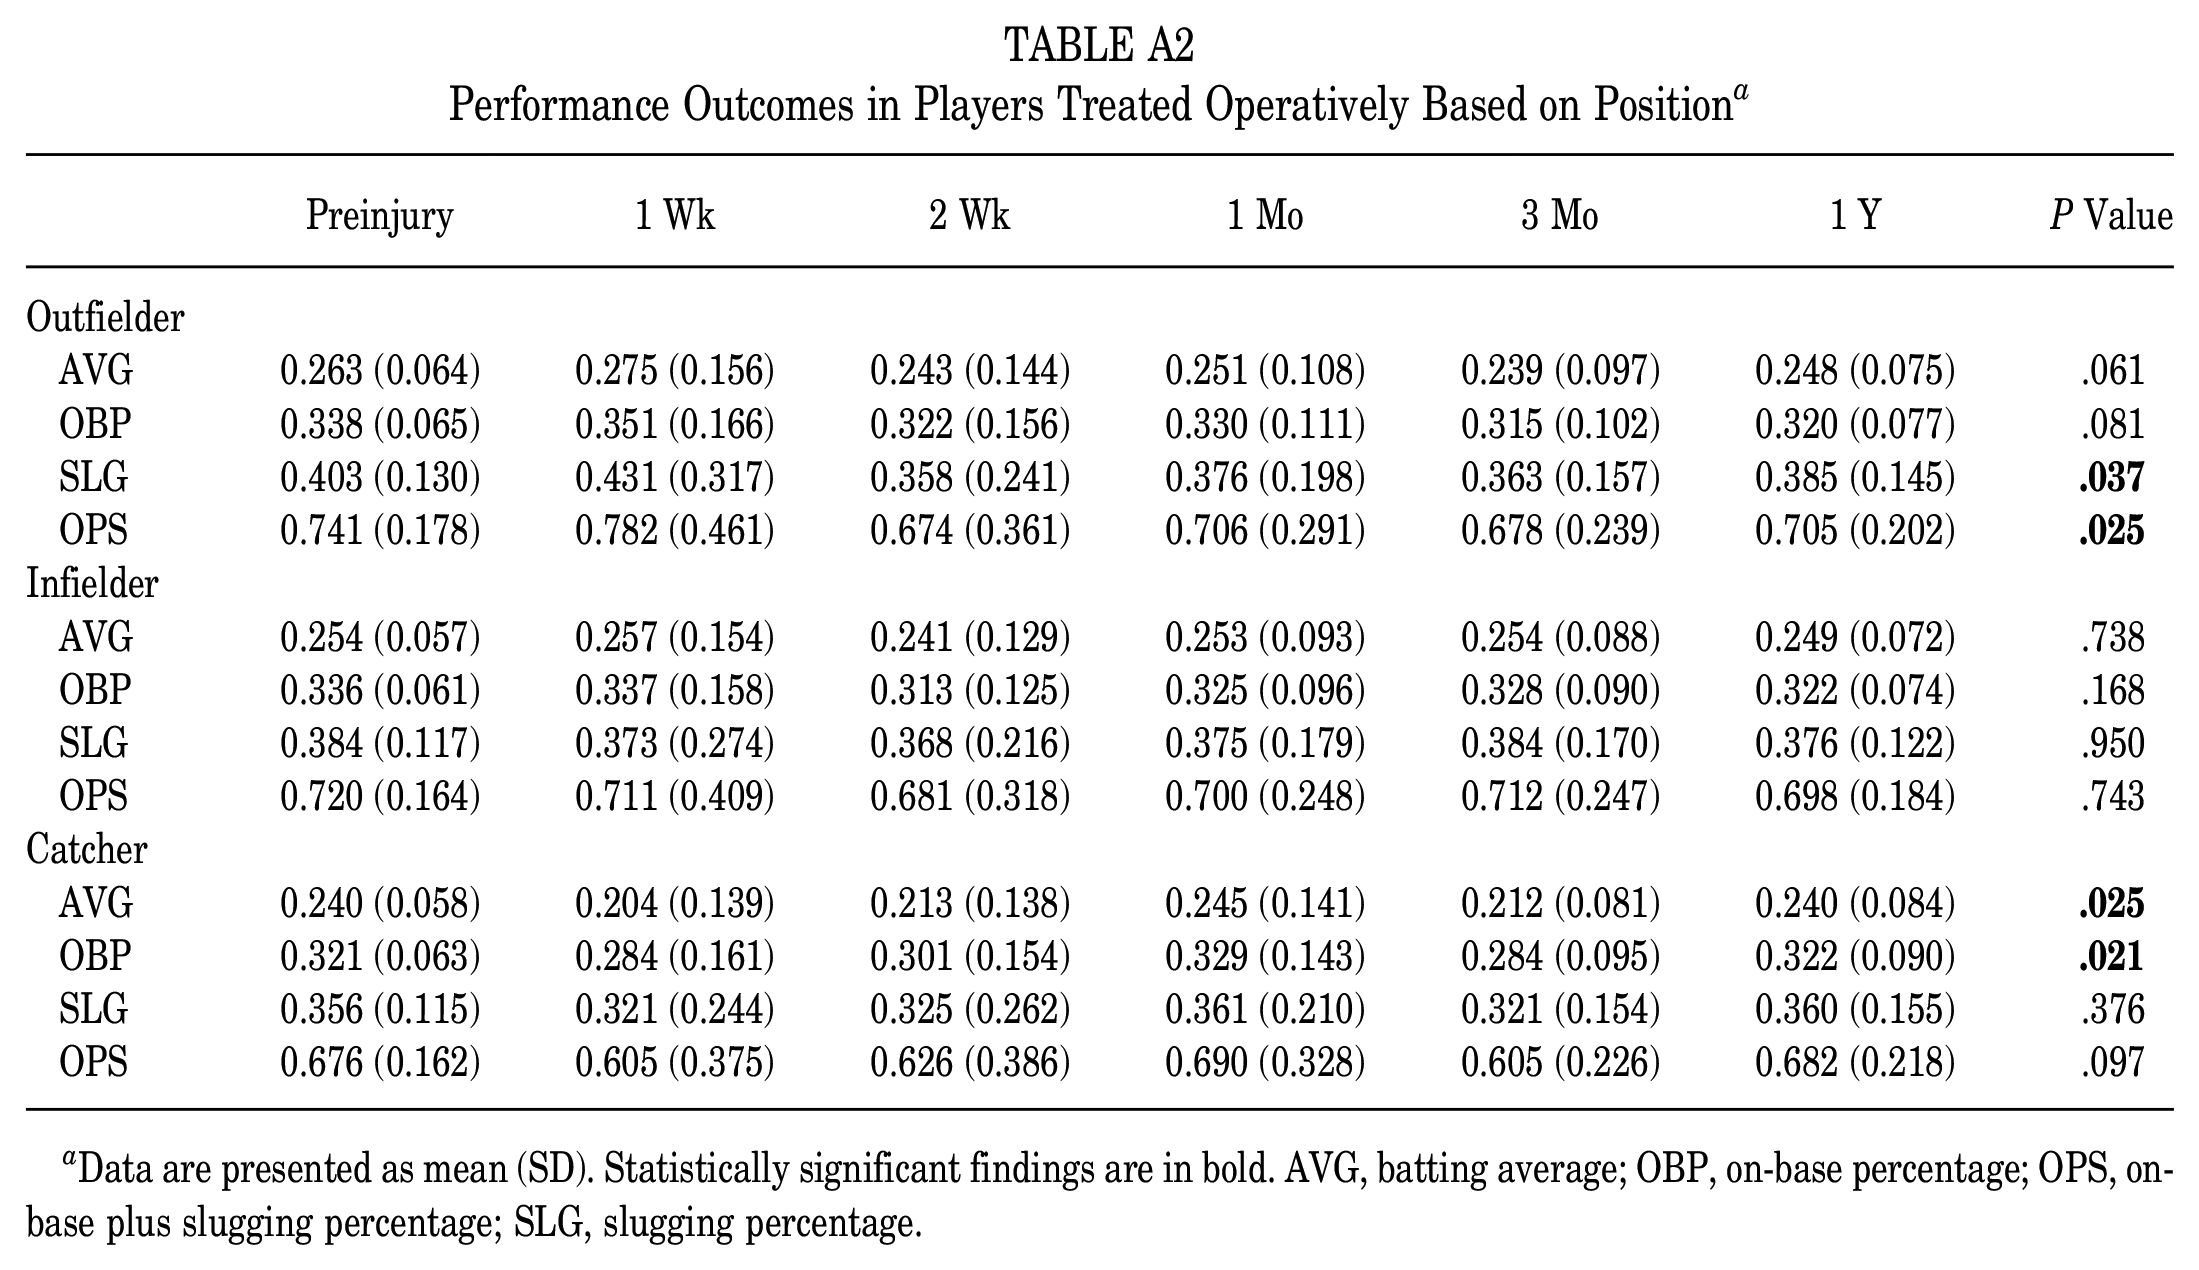
For players treated operatively all performance outcomes were found to differ throughout 1 year after injury (Table 6); however, AVG (P = .671), OBP (P = .610), SLG (P = .882), and OPS (P = .756) did not differ when directly comparing preinjury to 1-year postinjury performance. For players treated nonoperatively, only OBP was found to differ throughout 1 year after injury (P = .023), but OBP did not differ when directly comparing preinjury to 1-year postinjury performance (P = .351). The performance outcomes of each position type (catchers, infielders, and outfielders) treated operatively versus nonoperatively are available in Appendix Tables A1 and A2 (in the online version of this article).
Performance Outcomes Throughout 1 Year After Fracture in Players Treated Operatively Versus Nonoperatively a

Data are presented as mean (SD). Statistically significant findings are in bold. AVG, batting average; OBP, on-base percentage; OPS, on-base plus slugging percentage; SLG, slugging percentage.
Discussion
The primary purpose of this study was to report the RTS rate, RTS time, and performance outcomes in professional baseball position players after hand fractures from 2011 to 2022. The secondary purpose was to compare the outcomes between positions and between operatively versus nonoperatively treated players. The findings align with the initial hypothesis, confirming a high RTS rate (81.6%) after hand fractures among professional baseball players. This high rate of RTS supports the notion that hand fractures, despite being significant injuries in baseball, generally allow athletes to return to their previous level of play within a relatively short period (mean, 58 days in this study).
The observation that player position (outfielders, infielders, and catchers) did not significantly affect RTS rates or times (P = .440 and P = .893, respectively) suggests that the physical demands associated with different positions in baseball may not drastically influence the recovery process from hand fractures. This finding aligns with previous research by Rao et al 9 regarding elbow surgery in baseball players indicating that RTS rates after ulnar collateral ligament reconstruction and ulnar nerve transposition are similar across various baseball positions. Clinicians should know that despite the different responsibilities of each position, especially with catchers’ nondominant hand potentially being at risk for a more difficult RTS after hand fractures due to the force of catching every pitch, this ultimately did not affect their RTS outcomes.
Although RTS rates were similar between players treated operatively versus nonoperatively (83% vs 82%; P = .740), operatively treated players required significantly more time to return to play (86 vs 51 days; P < .001). This suggests that while surgical intervention may prolong the recovery period, it does not hinder the likelihood of a successful RTS. The extended recovery time in the operative group may be attributable to the surgical procedure and/or the increased severity of fractures that necessitate surgical intervention compared with those that are treated nonoperatively. These findings are similar to those observed in National Hockey League (NHL) athletes after hand fracture. Gotlin et al 6 found that RTS rates after hand, wrist, and forearm fractures in NHL players were similar between players who underwent operative versus nonoperative treatment. However, NHL athletes returned to sport at a rate of 98% and thus were able to RTS more frequently than MLB players, with players with hand fractures returning to sport 16 days after operative treatment and 13 days after nonoperative treatment. 6 Another study revealed that 39% of metacarpal fractures in National Football League (NFL) athletes required surgery, with time until RTS similar between athletes treated operatively (20 days) versus nonoperatively (16 days). 11 The authors also performed a regression analysis to determine whether player or injury characteristics affected RTS, finding that age, experience, injury mechanism, and player position did not affect RTS in NFL athletes. 11
A previous study utilizing the HITS database evaluated professional baseball players who fractured specifically their hook of the hamate and their ability to RTS after excision of the hook of the hamate. 3 The study included 261 players over an 8-year period and showed that 84% of players returned to any level of sport and 81% returned to the same or higher level of sport. 3 Players were able to RTS at a median of 48 days (range, 16-246 days). 3 The RTS rate after operative treatment was similar in the current study (83%); however, the time until RTS was longer in the current study (mean, 86 days) compared with the median (48 days) when isolating hook of the hamate fractures. This may be due to the hook of the hamate surgery being an excision, while phalanx and metacarpal fractures instead involve reduction and fixation.
Interestingly, despite these differences in RTS time, the long-term performance outcomes did not significantly differ between preinjury and 1 year after injury, regardless of whether the player was treated operatively or nonoperatively. This finding is critical for team physicians, players, coaches, and management when considering treatment options, as it suggests that while surgery may extend the time away from sport, it does not compromise the player’s ability to perform at their preinjury level in the long term.
This study is not without limitations. First, this study only evaluated professional baseball players and thus our results may not be extrapolated beyond this patient population. Also, injury characteristics, imaging, and treatment indications were not able to be assessed and compared between operatively and nonoperatively treated players, which could have a significant effect on outcomes. Additionally, while the study focused on key performance metrics such as AVG, OBP, SLG, and OPS, other performance metrics, particularly those related to defensive capabilities and advanced statistics such as wins above replacement, were not included. Another potential limitation is variability in rehabilitation protocols across different teams and medical staff within professional baseball. Differences in postinjury care could influence RTS times and performance outcomes. Future research should consider standardizing rehabilitation protocols across different organizations to minimize these confounding variables. Finally, timing of injury throughout the season could affect time until RTS, as players who are ready to RTS during the off-season can be forced to wait up to several months before officially returning to sport once the next season begins.
Conclusion
Overall, 82% of professional baseball position players were able to RTS at a mean of 58 days after hand fracture, with player position not affecting RTS rate or time. Players treated operatively did require more time to RTS (86 vs 51 days); however, the RTS rate did not differ between operatively versus nonoperatively treated players. At 1 year after injury, players performed similarly compared to preinjury baseline regardless of player position or type of treatment.
Footnotes
Appendix
Performance Outcomes in Players Treated Operatively Based on Position a
| Preinjury | 1 Wk | 2 Wk | 1 Mo | 3 Mo | 1 Y | P Value | |
|---|---|---|---|---|---|---|---|
| Outfielder | |||||||
| AVG | 0.263 (0.064) | 0.275 (0.156) | 0.243 (0.144) | 0.251 (0.108) | 0.239 (0.097) | 0.248 (0.075) | .061 |
| OBP | 0.338 (0.065) | 0.351 (0.166) | 0.322 (0.156) | 0.330 (0.111) | 0.315 (0.102) | 0.320 (0.077) | .081 |
| SLG | 0.403 (0.130) | 0.431 (0.317) | 0.358 (0.241) | 0.376 (0.198) | 0.363 (0.157) | 0.385 (0.145) | . |
| OPS | 0.741 (0.178) | 0.782 (0.461) | 0.674 (0.361) | 0.706 (0.291) | 0.678 (0.239) | 0.705 (0.202) | . |
| Infielder | |||||||
| AVG | 0.254 (0.057) | 0.257 (0.154) | 0.241 (0.129) | 0.253 (0.093) | 0.254 (0.088) | 0.249 (0.072) | .738 |
| OBP | 0.336 (0.061) | 0.337 (0.158) | 0.313 (0.125) | 0.325 (0.096) | 0.328 (0.090) | 0.322 (0.074) | .168 |
| SLG | 0.384 (0.117) | 0.373 (0.274) | 0.368 (0.216) | 0.375 (0.179) | 0.384 (0.170) | 0.376 (0.122) | .950 |
| OPS | 0.720 (0.164) | 0.711 (0.409) | 0.681 (0.318) | 0.700 (0.248) | 0.712 (0.247) | 0.698 (0.184) | .743 |
| Catcher | |||||||
| AVG | 0.240 (0.058) | 0.204 (0.139) | 0.213 (0.138) | 0.245 (0.141) | 0.212 (0.081) | 0.240 (0.084) | . |
| OBP | 0.321 (0.063) | 0.284 (0.161) | 0.301 (0.154) | 0.329 (0.143) | 0.284 (0.095) | 0.322 (0.090) | . |
| SLG | 0.356 (0.115) | 0.321 (0.244) | 0.325 (0.262) | 0.361 (0.210) | 0.321 (0.154) | 0.360 (0.155) | .376 |
| OPS | 0.676 (0.162) | 0.605 (0.375) | 0.626 (0.386) | 0.690 (0.328) | 0.605 (0.226) | 0.682 (0.218) | .097 |
Data are presented as mean (SD). Statistically significant findings are in bold. AVG, batting average; OBP, on-base percentage; OPS, on-base plus slugging percentage; SLG, slugging percentage.
Final revision submitted May 2, 2025; accepted June 13, 2025.
One or more of the authors has declared the following potential conflict of interest or source of funding: S.B.C. has received research support from Arthrex and Major League Baseball, consulting fees from CONMED Linvatec and Zimmer, publishing royalties from Slack, and IP royalties from Zimmer. AOSSM checks author disclosures against the Open Payments Database (OPD). AOSSM has not conducted an independent investigation on the OPD and disclaims any liability or responsibility relating thereto.
Ethical approval for this study was waived by the Thomas Jefferson University institutional review board (No. 2023-1798).