
Abstract
Background:
There is a lack of consensus regarding the optimal identification of motion-based subgroups (biokinetic profiles) of patients with patellofemoral pain (PFP) to guide effective management strategies.
Purpose:
To investigate different biokinetic profiles among patients with PFP during a step-down task and compare their clinical and physical characteristics.
Study Design:
Descriptive laboratory study.
Methods:
A total of 49 patients with PFP had their 3-dimensional kinematics assessed during a step-down task using an optoelectronic system. The variables analyzed were trunk and lower limb joint angles. Self-organizing maps and K-means clustering techniques were used to identify distinct biokinetic profiles. Clinical characteristics compared among profiles were hip/knee isometric strength and passive range of motion, descriptive characteristics, and patient-reported outcome measures.
Results:
Four biokinetic profiles were identified for the step-down task in patients with PFP. Profile 1 (Balanced Alignment Profile) exhibited a trunk-hip-knee aligned movement pattern, with increased knee flexion (P < .05). This profile presented the highest International Knee Documentation Committee (IKDC) Subjective Form and the lowest visual analog scale (VAS)-Pain scores (P < .05). Profile 2 (Trunk-hip-knee Compensation Profile) and Profile 3 (Pelvic-Hip Interactor Profile) exhibited increased dynamic knee valgus during the step-down task. However, Profile 2 presented limited trunk (P < .05) and knee flexion, while Profile 3 presented increased anterior pelvic tilt (P < .05) and trunk flexion. Profile 2 had excessive passive hip internal rotation (P < .05) and a majority of women (P < .05), while Profile 3 exhibited increased isometric hip and knee strength (P < .05) and lower levels of pain. Profile 4 (Protective Movement Profile) exhibited a possibly protective adaptation, showing decreased hip, knee, and pelvis peak angles and decreased ipsilateral trunk tilt (P < .05), as well as the lowest IKDC scores and the highest VAS-Pain scores (P < .05).
Conclusion:
This study identified 4 clinically relevant biokinetic profiles of patients with PFP based on their kinematics during a step-down task. The principal clinical value of this study is the development of a functional classification for patients with PFP. Each profile exhibits characteristics that may provide valuable insights for clinicians to implement targeted interventions and improve patient care. Acknowledging the variability in movement profiles and their implications in PFP underscores the importance of moving beyond one-size-fits-all treatment strategies.
Clinical Relevance:
This study uncovers previously unknown movement-based biokinetic profiles in patellofemoral pain and identifies several modifiable clinical characteristics associated with each profile, which could be addressed through targeted interventions.
Patellofemoral pain (PFP) represents one of the most predominant and intricate conditions encountered in orthopaedic practice of the knee. The treatment for PFP can be challenging, with long-standing symptoms and recurrence rates as high as 70% to 90% throughout.18,29,54 This condition is characterized by anterior knee pain, frequently attributed to increased contact pressures within the patellofemoral joint.18,19,28
Kinematic risk factors for PFP have primarily been investigated by focusing on isolated kinematic variables, without considering the combination of movements and the complexity of human motion. Numerous isolated kinematic variables—such as dynamic knee valgus, trunk flexion, pelvic tilt, and knee flexion—have been implicated in the mechanical overload of the patellofemoral joint.4,41 However, it is unrealistic to dissociate isolated movements from daily living activities. Even the simplest tasks require a combination of synchronous movements across multiple joints and segments mediated by a complex neuromotor strategy to share forces, minimize loads, and improve efficiency. 50 As a result, the body of literature remains inconclusive concerning isolated biomechanical differences between patients with PFP and healthy individuals during everyday activities.7,24
One criticism of previous studies is that the tasks chosen to assess biokinetic differences in patients with PFP may not be sufficiently demanding to uncover the underlying biomechanical adaptations. Recent research has employed tasks with greater functional demand and found increased sensitivity to differentiate patients with PFP. 7 The step-down task, in particular, has emerged as a pivotal assessment tool, proving its efficacy in distinguishing patients with PFP from asymptomatic individuals.35,51 Its appeal lies in its simplicity, minimal equipment requirements, and clear instructions. Consequently, it has been broadly used in clinical practice and research spanning from elderly populations to professional athletes.26,35,51
The varied clinical presentation of PFP may account for the inconsistent findings in biomechanical research. Recognizing biokinetic profiles in patients with PFP offers a practical approach to address this heterogeneity and guide treatment decisions more effectively. 14 A consensus from the International Patellofemoral Pain Research Retreat highlights the critical importance of profile identification, deeming it the primary direction for PFP research. 64 Such emphasis stems from the observation that diverse clinical profiles might present similar symptoms but require vastly different treatment approaches for addressing their symptoms.12,13
Defining the optimal parameters for clinically significant profile classification remains a work in progress. The application of kinematic parameters to classify patients with PFP offers a promising avenue to refine clinical management, given that different movement patterns have been linked to the onset of PFP. 52 Previous studies have utilized 3-dimensional (3D) motion capture to pinpoint kinematic-based subgroups, although with a focus exclusively on runners with PFP.17,42 In a different approach, Leporace et al 33 harnessed artificial intelligence for subgroup classification, which effectively minimizes biases intrinsic to human judgment. 33 This method successfully determined distinct gait profiles in patients with knee osteoarthritis, although similar methodologies remain relatively uncharted in PFP research.
The primary objective of this study was to identify possible movement-based subgroups (biokinetic profiles) among patients with PFP during the step-down task by employing machine learning algorithms. Moreover, we aimed to compare the clinical and functional characteristics of these subgroups, culminating in a comprehensive biokinetic assessment that integrates 3D motion analysis, strength and flexibility tests, and patient-reported outcome measures (PROMs). 39 This combined analysis presents valuable information for more personalized treatment strategies. We hypothesized that distinct biokinetic profiles in PFP would emerge, each associated with unique clinical characteristics.
Methods
Study Design and Participants
The present study adopted a retrospective cross-sectional design, utilizing a database sourced from a private motion analysis laboratory (Rio de Janeiro, Brazil). The laboratory is accessible to the general public, with patients referred either by their attending physicians or through self-referral. Each individual’s evaluation was completed on a single visit, in strict adherence to the laboratory’s standard protocol. Ethical approval for the study was granted by the institutional ethics committee of Hospital Universitário Pedro Ernesto da Universidade do Estado do Rio de Janeiro (7.238.695).
Patients were included if they had been diagnosed with PFP by a physician, in accordance with the consensus definition of PFP: presence of pain around or behind the patella, which was aggravated by at least 1 activity that loads the patellofemoral joint during weightbearing on a flexed knee (eg, squatting, stair ambulation, jogging/ running, or hopping/jumping). 13 The exclusion criteria were the presence of patellar instability and ipsilateral knee surgeries. Participants with any clinical condition that could impair their ability to perform the step-down task, complete self-assessment questionnaires, or undergo a physical examination were excluded. No limitations were imposed on the time elapsed since the onset of symptoms, age, sex, previous surgeries, or activity level. If a patient presented bilateral PFP, the most symptomatic side (self-selected) was utilized in the analysis. Healthy contralateral limbs or healthy controls were not included in this study, because the objective was to identify and compare subgroups of patients with PFP.
Step-Down Task
Utilizing 8 high-speed infrared cameras (Bonita B10, Nexus 2.0; Vicon Motion Systems), 3D kinematic data were captured at a sample frequency of 100 Hz. Reflective anatomic markers were bilaterally affixed to the skin over the following anatomic landmarks: the spinous processes of the C7 and T10 vertebrae, jugular notch of the clavicle, xiphoid process of the sternum, anterior and posterior superior iliac spines, iliac crest, lateral mid-thigh, medial and lateral femoral epicondyles, lateral mid-shank, medial and lateral malleoli, second metatarsal head, and calcaneus. A standing trial in a static posture was executed for each participant to individualize marker positioning and deduce joint centers and segmental positions during the lateral step-down task. After the initial static trial, markers on the medial femoral epicondyle and medial malleolus were removed.
For the step-down task, participants started from a standing position atop a 30-cm-high box. The tested limb was centrally positioned on the box, while the contralateral foot rested on the box's edge. Participants were then instructed to cross their arms over their chest, elevate one foot from the box, execute a single-leg squat using the supporting limb, lower themselves to the lowest achievable position with the opposing limb, and subsequently return to the initial stance. Guidance was given to move the contralateral limb laterally, refraining from anterior or posterior movement. Four valid repetitions were executed for each lower limb, with a 30-second resting interval between repetitions. Valid trials were averaged and included in the statistical analysis.
Questionnaires, Strength, and Range of Motion Tests
Tests were conducted on the affected limb. A handheld dynamometer was used to measure the isometric strength of hip abductors, hip external rotators, knee extensors, and knee flexors (Lafayette Instrument). Fixed straps were used to stabilize both the patient and the dynamometer, minimizing potential bias from the examiner’s strength. The “make” technique was employed, as Stratford and Balsor 55 found it to have greater reliability compared with the “break” test when using dynamometers. Participants were instructed to exert maximal force against the dynamometer for 5 seconds. An initial trial was conducted for familiarization, followed by 2 recorded trials, each interspersed with 15-second rest intervals. If there was a difference of >10% between trials, a third trial was conducted. The trial with the highest value was used in the analysis. The peak force (N) from the experimental trials was documented and normalized to body weight (%BW) to mitigate the influence of varying body mass on strength measurements. To ensure maximal performance, a standardized verbal prompt was consistently delivered to all participants during the testing. Strength measurements for the hip abductors and external rotators, as well as the knee extensors and flexors, were obtained in accordance with the positions delineated by Zeitoune et al 67 (Supplementary Material).
Range of motion (ROM) assessments were conducted using an inclinometer (Acumar Digital Inclinometer, Model ACU 360; Lafayette Instruments). The evaluations included hip internal rotation (prone position), weightbearing ankle dorsiflexion, knee flexion (prone position), the modified Ober Test (iliotibial band flexibility), 63 and the modified Thomas test (iliopsoas flexibility). 59 Detailed descriptions for the strength and ROM testing procedures are available in the Supplementary Material. For each test, 2 trials were conducted, ensuring no more than a 10% difference between them. The greatest value was used for analysis. To maintain blinding during the tests, one evaluator was responsible for measurements, while the second evaluator read the values without informing the other evaluator.
Patients’ function, pain, and movement apprehension levels were evaluated using the following self-reported questionnaires: International Knee Documentation Committee–Subjective Form (IKDC); Lower Extremity Functional Scale (LEFS); visual analog scale for pain (VAS)–Pain; and Tampa Scale for Kinesiophobia (TSK).
Biomechanical Data Processing
Segment definitions adhered to the previously established recommendations of Kadaba et al. 27 The pelvis, trunk, femur, tibia, and foot were modeled as a mobile rigid body segment, with angular displacements calculated relative to the laboratory coordinate system (global frame). Pelvic motion in the frontal plane (eg, pelvic drop) was assessed as movement of the iliac crests relative to horizontal alignment, independent of trunk or femur motion. In contrast, joint angles, including hip angles, were calculated as relative rotations between the rigid segments. This approach aligns with standard 3D motion analysis conventions and allows differentiation between segmental and intersegmental contributions to overall movement.22,27,65
Data were filtered through a fourth-order zero-lag low-pass Butterworth filter with a 6 Hz cutoff frequency. Lower limb angles were computed using the Nexus software (Vicon), based on the joint coordinate system proposed by Grood & Suntay. 22 Skin movement artifacts were minimized through modern algorithms, the use of rigid clusters, a trained team, patient selection, and repeated trials. During the descending phase of the step-down, the following biomechanical parameters were recorded: peak trunk flexion, peak trunk lateral tilt, peak anterior pelvic tilt, peak contralateral pelvic drop, peak hip adduction, peak hip internal rotation, and peak knee flexion. The descending phase was defined as the period beginning with the contralateral foot leaving the box and ending at the point of maximal knee flexion in the limb under study. These were chosen based on previous research showing differences between men and women with and without PFP. 8
Statistical Analysis
Kinematic variables were assessed through a self-organizing map (SOM) analysis for dimensionality reduction and the identification of similar motion patterns.1,33 To ascertain the optimal SOM size, a series of maps, with neuron counts ranging from 10 to 200, were generated. Both topographical and quantization errors were used to determine the optimal map configuration. 33 The percentage of inactive neurons was also recorded for each SOM size. The unified distances matrix was employed to visualize the 2D map post-network training, which highlighted topological relationships between the neurons and elucidated the structure of the input data. 33
The k-means clustering technique was used to determine the optimal number of groups, segmenting the dataset into more homogeneous intragroup observations and ensuring more diverse intergroup configurations. 29 Because of its sensitivity to initial centroids, the algorithm was run 1000 times for each proposed group value. Configurations varied from 2 to 6 groups. The Davies-Bouldin and Silhouette indices assisted in selecting the number of groups that best segmented the database. 33 To avoid human influence and potential bias, we relied exclusively on the objective output of these indices.
Although there is no standard method for calculating sample size in clustering analysis, the power of the analysis increases with a clear separation between profiles (large effect size). 15 A study with a similar methodology but in a different population identified 4 distinct profiles with a relatively small sample size of 42 patients. 33 Because this study analyzed more variables and included a larger sample size, this sample size was considered sufficient to detect profiles.
Biokinetic profiles for the step-down were delineated based on the clusters from the combined SOM/k-means algorithm. Descriptive statistics, such as the median and interquartile ranges (IQRs) (IQR, 25%-75%), were used for step-down patterns for the 7 kinematic variables. The Kruskal-Wallis 1-way analysis of variance compared the groups with respect to the 7 kinematic variables of interest. Multiple group comparisons were performed using the Dunn test with Bonferroni correction. All machine learning techniques and biomechanical outcome analyses were conducted using custom-written routines in the Matlab environment (R2021a, The MathWorks).
Clinical characteristics across biokinetic profiles were compared. Self-reported questionnaire scores, strength metrics, ROM, age, body mass, height, and body mass index (BMI) were treated as continuous variables and compared among profiles using the Kruskal-Wallis test.20,21 The Dunn test with Bonferroni correction was also used for multiple group comparisons. Differences in sex distribution among profiles were assessed using the chi-square test. Data normality was tested using the Shapiro-Wilk test. The significance level was set at 5%.
Results
Participants and Descriptive Data
A total of 49 patients participated in this study. The mean age of the participants was 41.6 ± 13.5 years, with a BMI of 24.3 ± 4.3 kg/m2. Among them, 61.2% were women (n = 30) (Table 1).
Demographic and Biomechanical Characteristics of Patients With PFP by Biokinetic Profile a

Data are presented as median (first – third quartiles). Positive trunk flexion values indicate flexion, and negative trunk flexion values indicate extension. Positive trunk lateral tilt values indicate contralateral trunk leans, and negative trunk lateral tilt values indicate ipsilateral trunk leans. Positive anterior pelvic tilt values indicate anterior pelvic inclination, and negative anterior pelvic tilt values indicate posterior pelvic inclination. Positive contralateral pelvic drop (downward displacement of the opposite iliac crest) values indicate contralateral pelvic drop, and negative contralateral pelvic drop values indicate ipsilateral pelvic drop. Positive hip adduction values indicate hip adduction, and negative hip adduction values indicate hip abduction. Positive hip internal rotation values indicate hip internal rotation, and negative hip internal rotation values indicate hip external rotation. Positive knee flexion values indicate flexion, and negative knee flexion values indicate extension. BMI, body mass index; F, female; M, male; NA, not applicable; PFP, patellofemoral pain; 3D, 3-dimensional.
symbols indicate statistically significant differences between the groups.
Self-organizing Maps
The neural network identified an optimal configuration of 36 neurons for the self-organizing maps, resulting in a quantization error of 0.34 and a topographic error of 0.02. During the analysis, 19.4% of the neurons remained inactive. The machine learning algorithms suggested that the optimal segmentation divided patients into 4 distinct biokinetic profiles, hereafter referred to as profiles 1 through 4.
Statistically significant sex differences were observed between Profiles 1 and 2 (P = .003). Profile 1 contained fewer women than expected, whereas Profile 2 had fewer men. There were no significant differences in age (P = .45), body mass (P = .166), height (P = .07), or BMI (P = .321) across profiles. A detailed overview of descriptive and biomechanical data and PROMs for each profile is presented in Table 1.
Biomechanical Characterization of Step-Down Profiles
Trunk flexion in Profile 1 was greater than in Profiles 2 and 4. In addition, trunk flexion was more pronounced in Profile 3 (median, 34.2° [range, 22.8 to 40.8]) than in Profile 4 (median, 8.4 [range, 1.7 to 17.9]) (P < .001). Profile 4 had a decreased ipsilateral trunk tilt (median, –2.5° [range, –5.9 to −1]) compared with Profile 1 (median, –10.4° [range, –15.5 to −6.6]) (P = .01). Profile 3 displayed a higher anterior pelvic tilt (median, 22.4° [range, 18.6 to 26.5]) than Profile 4 (median, 8.7° [range, 3.3 to 16.4]) (P = .03). Both contralateral pelvic drop and hip adduction were significantly more pronounced in Profile 2 (contralateral pelvic drop median, 4° [range, 3.2 to 6.3]; hip adduction median, 17.5° [range, 14.6 to 22.8]) and Profile 3 (contralateral pelvic drop median, 3.5° [range, 1.4 to 5.5]; hip adduction median, 16.5° [range, 12.7 to 20.9]) than in Profile 1 (contralateral pelvic drop median, –4.6° [range, –6.1 to −0.6]; hip adduction median, 6.6° [range, 4.9 to 12.2]) and Profile 4 (contralateral pelvic drop median, –3.2° [range, –4.1 to 0.4]; hip adduction median, 8.5° [range, 4.4 to 9.8]) (P < .0001). Differences in hip internal rotation across the groups were not significant (P = .051). Profiles 2 and 4 had decreased knee flexion (P2 median, 69.2° [range, 61.4 to 74.1]; P4 median, 64.7° [range, 59.5 to 73.3]) compared with Profile 1 (P1 median, 87.6° [range, 74.3 to 96.1]) (P = .001).
Video 1 offers a clear representation of the profiles, highlighting the reduced ROM observed in Profile 4. In contrast, Profiles 2 and 3 mainly exhibited a hip imbalance component, while Profile 1 showed an aligned movement pattern in terms of knee, hip, pelvis, and trunk kinematics. Profile 3 is further characterized by a significant anterior pelvic tilt.
Strength and ROM
Profile 3 demonstrated higher hip abductor (median, 43.3 [range, 36.1 to 47.8]) and knee extensor strength (median, 53.1 [range, 43.1 to 62.5]) compared with Profile 4 (hip abductors median, 27.9 [range, 26.2 to 34.9]; knee extensors median, 37.4 [range, 33.5 to 42.8]) (P = .03; P = .03, respectively). There were no significant differences in hip external rotator (P = .09) and knee flexor strength among the groups (P = .09; P = .13, respectively). In terms of ROM, a significant difference was observed in hip internal rotation. Profile 2 (median, 46° [range, 39 to 53) showed increased values compared with Profile 3 (median, 35.5° [range, 21.5 to 43]) (P = .048). Other ROM comparisons did not indicate significant differences (Table 2).
Clinical Characteristics of Patients With PFP by Biokinetic Profile a

Data are presented as median (first – third quartiles). BW, body weight;
Ext, extension; IKDC, International Knee Documentation Committee; LEFS, Lower Extremity Functional Scale; PFP, patellofemoral pain; PROM, patient-reported outcome measures; ROM, range of motion; Rot, rotation; VAS, visual analog scale.
symbols indicate statistically significant differences between groups.
Clinical Outcome Scores
Profile 4 recorded the lowest scores on the IKDC Subjective Form (median, 48.3 [range, 40.2 to 57.5]), showing a statistically significant difference when compared with Profile 1 (median, 67.8 [range, 61.8 to 76.7]) (P = .01). Profiles 1 and 3 exhibited lower VAS-Pain scores (P1 median, 0.5 [range, 0.2 to 2.7]; P3 median, 1.3 [range, 0.1 to 2.3]) compared with Profile 4 (median, 4.8 [range, 2.5 to 6.4]) (P = .02). No significant differences were detected for the LEFS (P = .28) or the TSK (P = .62). All results are presented in Tables 1 to 3.
Biokinetic Profiles in PFP Summary: Key Characteristics, Strength and Flexibility Features, and Suggestions for Profile-Specific Interventions a
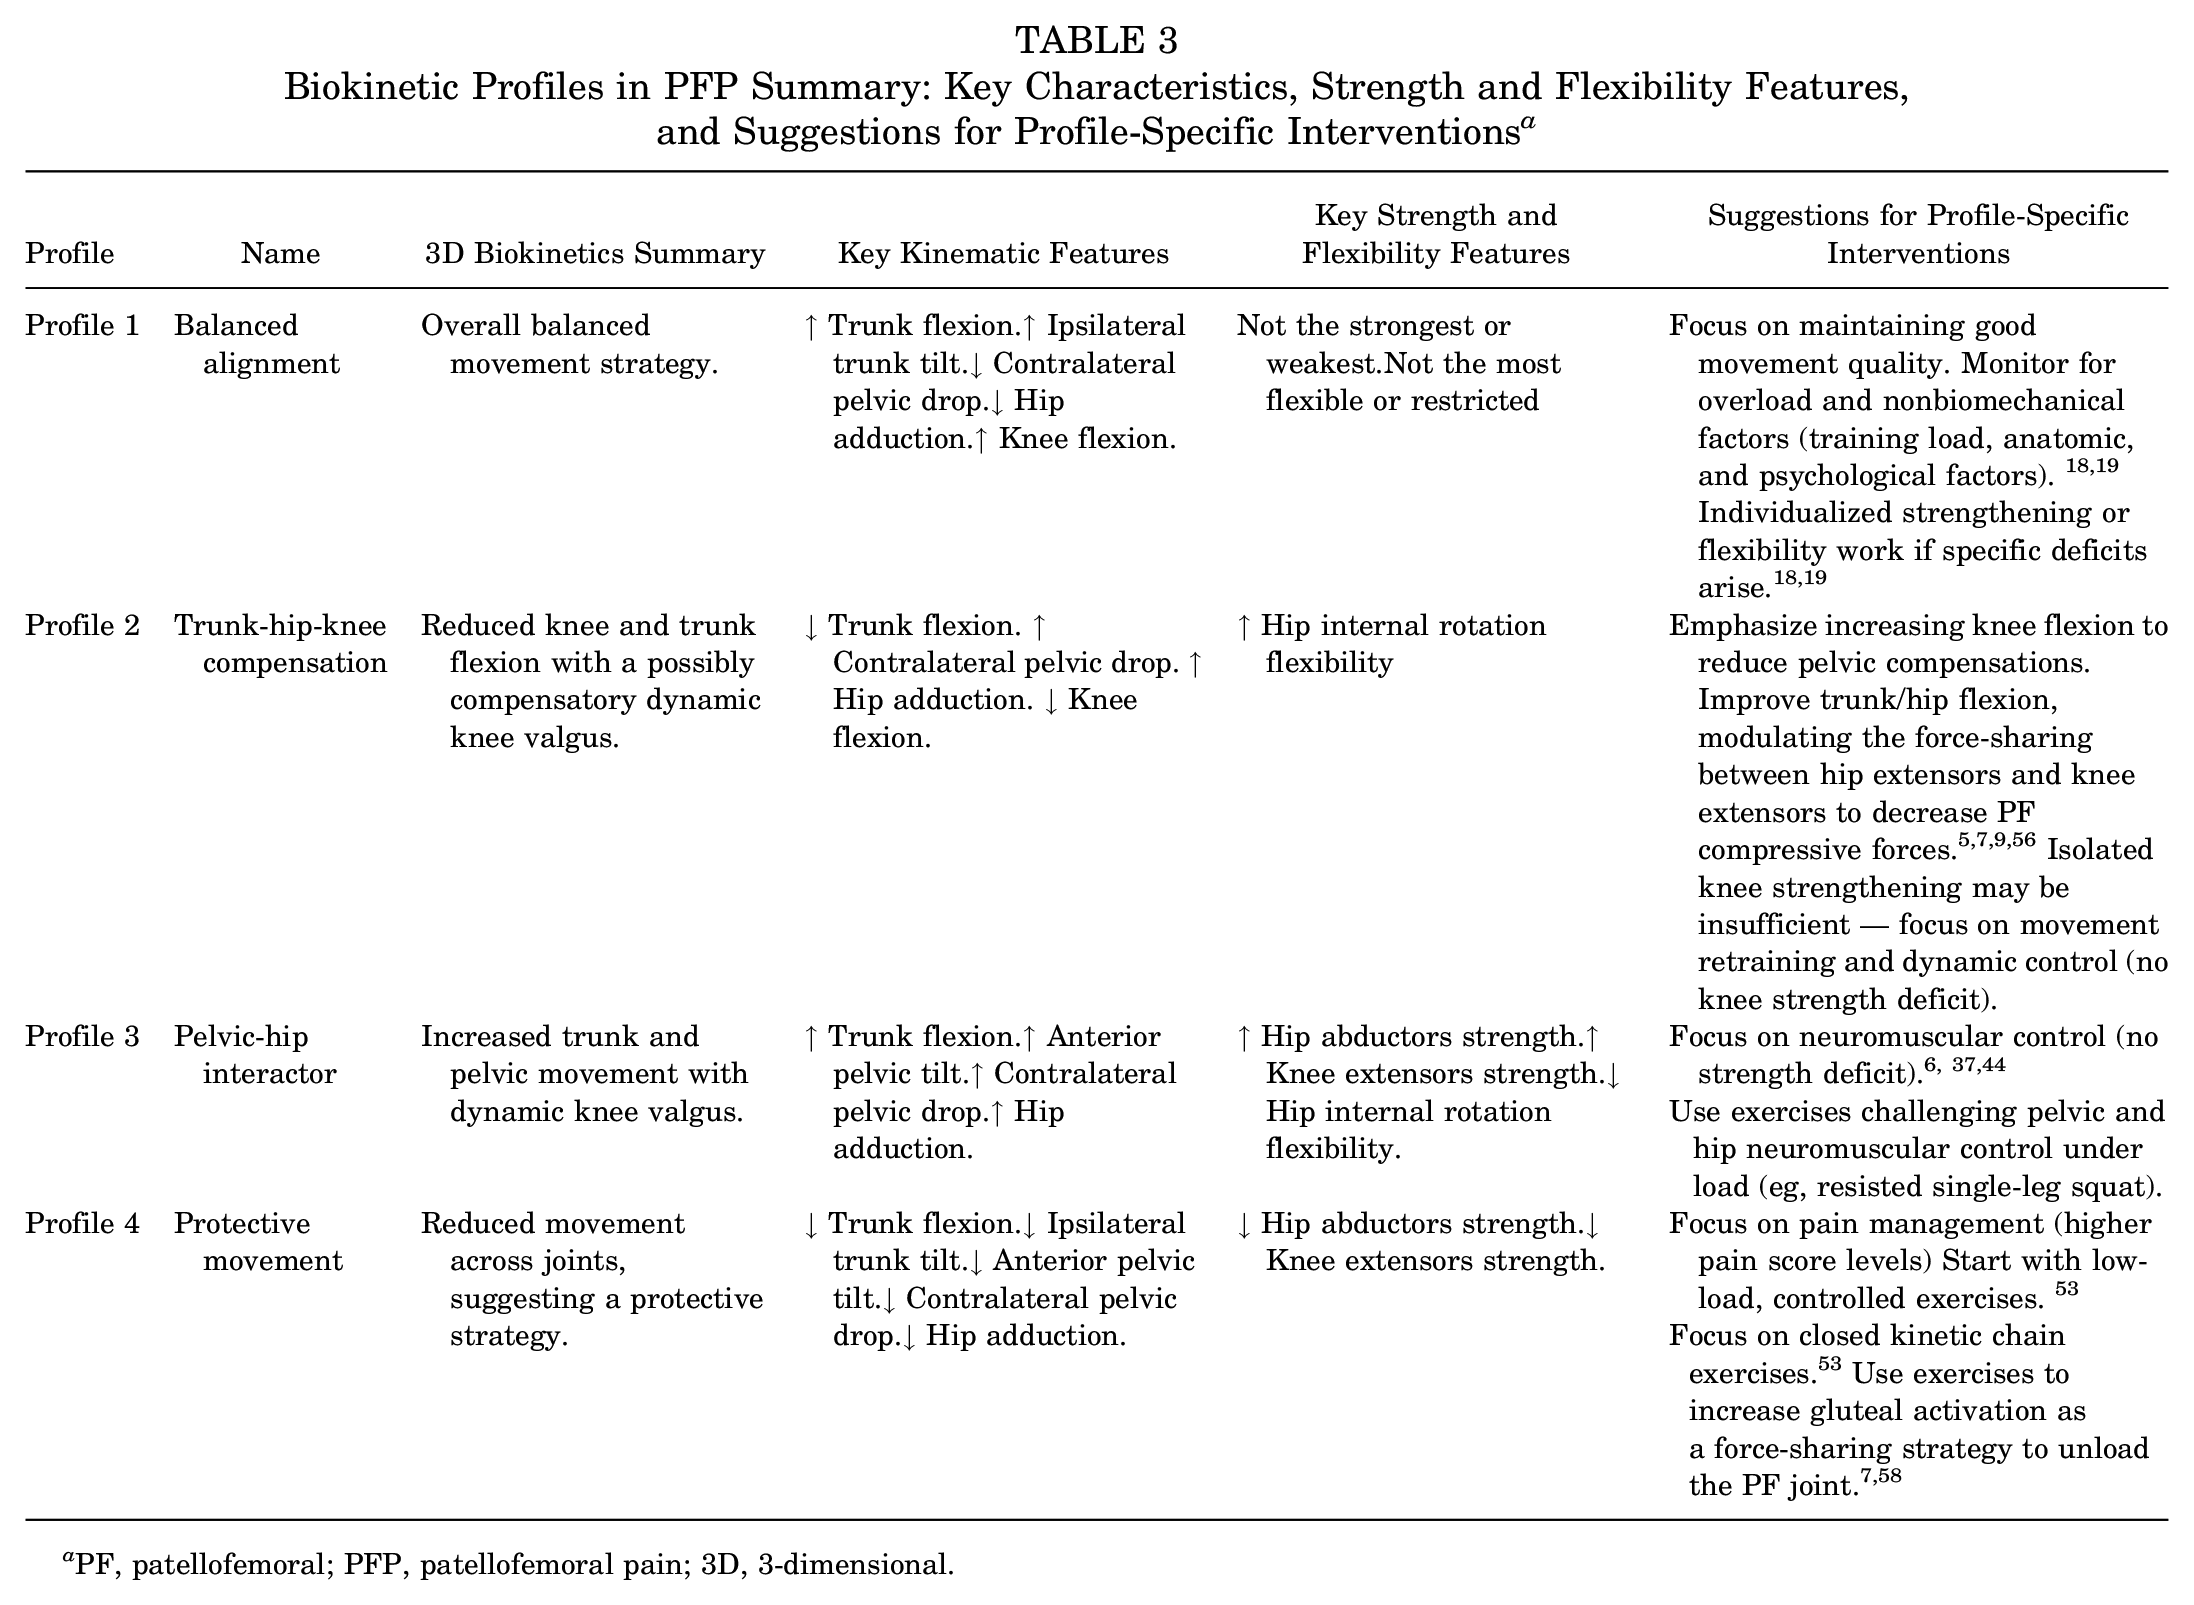
PF, patellofemoral; PFP, patellofemoral pain; 3D, 3-dimensional.
Discussion
Four distinct biokinetic profiles were identified in patients with PFP during a step-down task using a machine learning algorithm. Each profile was linked to specific biomechanical patterns and characteristics.4,25,41 Given the uncertainty with long-term results under either nonsurgical10,18,30,38,54 or surgical treatments11,16,48,60,61 in this patient population, this study offers valuable insights into functional status, pain, and clinical characteristics associated with each profile. Significant differences emerged across profiles concerning sex, self-reported function, pain, hip and knee strength, and ROM. These findings may provide a foundation for developing more targeted clinical and surgical treatment strategies for PFP, focusing on the specific biokinetic profile of each patient.
Profile 1 (Balanced Alignment Group) demonstrated notable trunk flexion (median P1: 43.9°; P2: 15.6°; P3: 32.2°; and P4: 8.4°) (P < .05), aligned hip and pelvis, and significant knee flexion (P1: 87.6°; P2: 69.2°, P3: 77.8°, and P4: 64.7°) (P < .05). The literature suggests that combining excessive trunk flexion with an aligned hip and pelvis may serve as an adequate strategy to reduce stress on the patellofemoral joint.2,7 Teng and Powers 56 reported similar adaptive mechanisms in patients with PFP. Adequate knee flexion may correlate with sufficient knee extensor strength, which aligns with improved function and reduced symptoms.41,49 Consequently, in our sample, Profile 1 reported fewer symptoms, as evidenced by superior IKDC scores (P1: 67.8; P2: 64.4; P3: 54; and P4: 48.3) (P < .05) and lower VAS–Pain scores (P1: 0.5; P2: 2.9; P3: 1.3; and P4: 4.8) (P < .05). Interestingly, hip and knee strength, as well as the ROM in Profile 1, did not significantly differ from other profiles. These findings suggest that Profile 1 encompasses a viable biomechanical strategy to manage PFP. Thus, interventions for this profile should potentially focus on modulating other risk factors such as excessive training loads, anatomic variations, and psychological influences.18,52
Profile 2 (Trunk-Hip-Knee Compensation) underscores the critical interplay between hip and knee, exhibiting pronounced dynamic valgus movement—marked by increased contralateral pelvic drop (ie, downward displacement of the opposite iliac crest; P1: –4.6°; P2: –4; P3: 3.5°; and P4: –3.2°) (P < .05) and ipsilateral hip adduction (P1: 6.6°; P2: 17.5°; P3: 16.5°; and P4: 8.5°). There is ample evidence highlighting the hip-knee relationship as a vital component in modulating PFP and function.9,43 Previous reports suggest that dynamic valgus is more prevalent among women, potentially because of decreased hip stiffness.31,40 This is reflected in our findings, as Profile 2 is characterized by a predominantly female composition (P1: 27.3% women; P2: 92.9%; P3: 41.7%; and P4: 75%) (P < .05) who exhibited signs of diminished hip stiffness evidenced by increased passive hip internal rotation ROM (P1: 33°; P2: 46°; P3: 35.5°; and P4: 36°) (P < .05). Surprisingly, this profile did not exhibit increased hip rotation during the step-down task. This finding highlights the complex interplay between sex, hip stiffness, and task-specific hip kinematics, challenging existing assumptions about hip function. Furthermore, because this profile did not present significant deficits in hip abductor and hip extensor strength, it is plausible that the observed dynamic valgus in this profile is a compensatory mechanism to increase the descent depth during the step-down test due to the lower knee flexion. This compensatory mechanism has been previously demonstrated in those with restricted ankle dorsiflexion ROM. 34 In this article, we propose a new mechanism inducing dynamic valgus, related to the lack of knee flexion, which is possibly a protective strategy against pain. According to the Latash theory of motor control, 32 this represents a synergy where the body compensates for reduced mobility in 1 joint (in this case, knee flexion in the sagittal plane) by increasing the mobility of another (in this case, pelvis and hip in the coronal plane) to maintain overall functionality and task performance.
Similar to Profile 2, Profile 3 (Pelvic-Hip Interactor) also exhibited dynamic valgus during the step-down task. However, this profile had a balanced sex distribution (41.7% of women) and normal passive hip internal rotation ROM (35.5° [range, 21.5-43]; P > .05), as opposed to Profile 2 (46° [range, 39-53). These findings highlight that 1 single motion impairment can have multiple causes and associated characteristics. We would argue that 1 explanation for the conflicting results from previous studies trying to associate dynamic knee valgus and PFP may lie in potentially unbalanced proportions of these 2 profiles among the patients included in those studies.
Consequently, strategies for targeted interventions for motion Profiles 2 and 3 may differ, despite presenting the same kinematic risk factor of increased dynamic knee valgus. While Profile 3 has a more pelvic-hip isolated component, Profile 2 has a coupled trunk, hip, and knee strategy for the step-down. Interventions for Profile 2 should possibly focus on improving the ability to flex the knee with better control of the pelvis in the coronal plane to avoid compensation. In addition, interventions aiming to increase hip stiffness, as well as neuromuscular interventions aimed at increasing trunk/hip flexion, would be advised for Profile 2. The latter would be a strategy to modulate the force-sharing between hip extensors and knee extensors to decrease PF compressive forces, as demonstrated in previous studies.5,9,56 On the other hand, Profile 3 would probably benefit from strategies to improve hip neuromotor control. This pelvic-hip interactor movement profile could be compared with the “strong” subgroup described by Selfe et al, 49 who reported a similar subgroup with the highest hip abductor, quadriceps strength, and lowest pain scores. As opposed to the other characteristics reported for the Selfe “strong” subgroup, however, our findings did not include more male patients, better function, better quality of life, and older age in Movement Profile 3. The absence of significant hip and knee strength deficits reignites the debate on the actual importance of maximum isometric gluteal strength for dynamic valgus motor control. 67 Neuromuscular strategies to improve hip-knee motor control could be more valuable for this profile than single-joint strengthening exercises, as shown in previous clinical studies.6,37,44
Profile 4 (Protective Movement) exhibited distinctive motion characteristics, suggesting a potential adaptive response to pain. Key motion characteristics included decreased knee flexion and decreased ipsilateral trunk inclination.46,62 These patients exhibited reduced knee flexion amplitude during step descent, which may have limited task intensity and insufficiently challenged the hip and pelvic muscles to elicit compensatory movements such as contralateral pelvic drop or hip adduction. Of note, patients in movement Profile 4 exhibited the highest pain (P1: 0.5; P2: 2.9; P3 1.3; and P4: 4.8) (P < .05) and lowest scores in PROMs (P1: 67.8; P2: 64.4; P3: 54; and P4: 48.3) (P < .05). Although avoidance patterns of motion are often linked to kinesiophobia, no significant differences were found for the TSK in our study, reinforcing recent findings suggesting that this questionnaire might lack the sensitivity to accurately detect the influence of psychosocial components on movement.23,57 Previous studies suggest that treatment strategies for this profile could be centered on pain management, such as with the use of oral analgesics and anti-inflammatories or intra-articular injections, as well as targeted exercises to improve trunk flexion as a force-sharing strategy to unload the PF joint.7,37,45,62 However, these interventions should be evaluated in future studies involving this biokinetic profile. In addition, it is essential to consider targeted interventions for nociceptive muscle inhibition in the management plan.36,66 Increased pain in the patellofemoral joint associated with decreased knee flexion in the step-down task is highly suggestive of this process, which is fundamentally a quadriceps activation failure promoted by neural inhibition. 47 Effective interventions for this condition involve neuromotor reprogramming exercises, 3 closed kinetic chain exercises, and cryotherapy. 53
Although sex differences were observed between profiles, we do not recommend sex-specific interventions. Profile 1 was predominantly men and Profile 2 predominantly women, while Profiles 3 and 4 showed a more balanced distribution. The characteristics observed in Profile 2 align with the literature, as discussed earlier, showing increased prevalence of dynamic knee valgus and greater hip flexibility. However, women can fall into any of the identified biokinetic profiles, and focusing treatment on characteristics that are not present in the individual may not be effective. Therefore, instead of sex-specific interventions, we advocate for case-by-case investigation of individual characteristics, using a comprehensive biokinetic analysis that includes motion, strength, ROM, and anatomic factors to understand individual needs and personalize treatment according to the identified impairments. Table 3 provides profile-specific intervention suggestions and summarizes key findings across strength, flexibility, and clinical characteristics.
We acknowledge the limitations of the present study, which are largely inherent to retrospective designs and motion analysis studies. Considering that a motion analysis examination is not yet routinely prescribed for the majority of PFP patients in clinical practice, this limits the sample size and may introduce potential selection bias. Specifically, our study may have omitted mild cases that responded well to initial treatment. Additionally, kinetic outcome measures were not assessed. As we did not have access to patient imaging, no correlations were conducted between each movement profile and any anatomic findings pertinent to PFP, such as patella alta, joint space narrowing, and lower limb alignment. Moreover, there is a concern that the present sample size could have impaired the identification of all existing profiles. Recent studies 15 indicate that relatively small sample sizes (n = 20 per subgroup) can provide stable clusters when separation between groups is significant (Delta = 4). The clear magnitude of the differences between profiles in the present study, combined with balanced subgroup sizes (11 to 12 participants each), supports the robustness of the identified clusters. Larger samples may reveal additional profiles; nonetheless, the substantial biomechanical diversity observed reinforces the importance of individualized assessment and treatment in patients with PFP. Last, our study was a cross-sectional analysis, precluding definitive conclusions on causal relationships or longitudinal effects of PFP or treatment. Interventions targeting the described biokinetic profiles were not investigated in this study; they are suggested based on the literature to provide a clinical context and require validation in future prospective studies. These limitations could be addressed in future investigations, possibly by incorporating a broader range of biomechanical variables and expanding the sample size.
Conclusion
Four distinct biokinetic profiles were identified in patients with PFP through a machine learning approach. The primary clinical significance of this research lies in the establishment of a clinically pertinent functional classification for patients with PFP, recognizing singularities that may allow more efficient interventions and improve long-term results. Given the ability of a complete biokinetic analysis to capture the complex interplay between movement patterns, strength, and flexibility, we advocate for its use to fully characterize each patient’s functional profile. Acknowledging the variability in biokinetic profiles and their implications in PFP underscores the importance of moving beyond one-size-fits-all treatment strategies. The prognosis of each biokinetic profile and its response to targeted interventions should be investigated in future studies.
Supplemental Material
sj-docx-1-ojs-10.1177_23259671251371238 – Supplemental material for Biokinetic Profiles in Patellofemoral Pain Patients During a Step-Down Task: An Unsupervised Machine Learning Approach
Supplemental material, sj-docx-1-ojs-10.1177_23259671251371238 for Biokinetic Profiles in Patellofemoral Pain Patients During a Step-Down Task: An Unsupervised Machine Learning Approach by Leonardo Metsavaht, Gustavo Leporace, Felipe F. Gonzalez, Eliane C. Guadagnin, Enzo Mameri, Jonathan A. Gustafson, Adam Yanke, Jorge Chahla and Marcus Luzo in Orthopaedic Journal of Sports Medicine
Supplemental Material
sj-docx-2-ojs-10.1177_23259671251371238 – Supplemental material for Biokinetic Profiles in Patellofemoral Pain Patients During a Step-Down Task: An Unsupervised Machine Learning Approach
Supplemental material, sj-docx-2-ojs-10.1177_23259671251371238 for Biokinetic Profiles in Patellofemoral Pain Patients During a Step-Down Task: An Unsupervised Machine Learning Approach by Leonardo Metsavaht, Gustavo Leporace, Felipe F. Gonzalez, Eliane C. Guadagnin, Enzo Mameri, Jonathan A. Gustafson, Adam Yanke, Jorge Chahla and Marcus Luzo in Orthopaedic Journal of Sports Medicine
Footnotes
Final revision submitted May 13, 2025; accepted June 9, 2025.
One or more of the authors has declared the following potential conflict of interest or source of funding: L.M. is an unpaid volunteer with Chief of Science Officer for Instituto Brasil e Tecnologias da Saude; is an unpaid research volunteer with the Department of Imaging Diagnostics of Federal University of São Paulo (DDI-UNIFESP); has stock or stock options in Biocinetica Laboratorio do Movimento, Ltda; and is a paid consultant and paid presenter or speaker for Aptíssen Inc. A.Y. is a paid consultant for AlloSource, JRF Ortho, and Stryker; an unpaid consultant for Patient IQ and Sparta Biomedical; has stock or stock options in Patient IQ, Sparta Biomedical, and Icarus. J.C. is a board or committee member of the American Orthopaedic Society for Sports Medicine, Arthroscopy Association of North America, and the International Society of Arthroscopy, Knee Surgery, and Orthopaedic Sports Medicine; is a paid consultant for Arthrex Inc, CONMED Linvatec, Ossur, and Smith & Nephew; and is a paid presenter or speaker for Smith & Nephew. AOSSM checks author disclosures against the Open Payments Database (OPD). AOSSM has not conducted an independent investigation on the OPD and disclaims any liability or responsibility relating thereto.
Ethical approval for this study was obtained from the institutional ethics committee of Hospital Universitário Pedro Ernesto da Universidade do Estado do Rio de Janeiro (7.238.695).
ORCID iDs
References
Supplementary Material
Please find the following supplemental material available below.
For Open Access articles published under a Creative Commons License, all supplemental material carries the same license as the article it is associated with.
For non-Open Access articles published, all supplemental material carries a non-exclusive license, and permission requests for re-use of supplemental material or any part of supplemental material shall be sent directly to the copyright owner as specified in the copyright notice associated with the article.