
Abstract
Background:
The hoop function of the meniscus plays a crucial role in stress distribution across the knee joint. While medial meniscal extrusion is known to contribute to the progression of medial knee osteoarthritis (OA) by altering load distribution within the knee joint, its exact effect on living humans remains unclear.
Purpose:
To investigate the influence of meniscal extrusion on subchondral bone density distribution in patients with medial knee OA.
Study Design:
Cross-sectional study; Level of evidence, 3.
Methods:
This retrospective study included 59 patients with medial knee OA (OA group) and 19 control participants (non-OA group). Radiographic parameters, including the hip-knee-ankle angle (HKA) and meniscal extrusion ratio (MER), were assessed. The subchondral bone density was evaluated using computed tomography–osteoabsorptiometry to analyze the high-density area (HDA) in the medial and lateral compartments on the articular surface of the proximal tibia. Correlations between these parameters were assessed using single and multiple regression analyses, with subgroup analysis conducted in OA patients with and without meniscal tears.
Results:
In the OA group, the HKA, medial MER (MMER), and the ratio of the medial compartment HDA to the total HDA (medial ratio) were −7.4°, 64.8%, and 81.8%, respectively. In the non-OA group, these values were −2.1°, 12.5%, and 62.0%. Simple regression analysis showed that, in the OA group, the medial ratio was correlated with HKA (R2 = 0.216; P < .001) and MMER (R2 = 0.307; P < .001). Among non-OA participants, only MMER was correlated with the medial ratio (R2 = 0.217; P = .045). The multivariable regression analysis demonstrated an adjusted R2 value of 0.38 (P < .001) in the OA group. The standardized coefficients were 0.465 for MMER and −0.340 for HKA. Subgroup analysis further indicated that meniscal injury in OA patients amplified the effect of extrusion on subchondral bone density distribution, with an adjusted R2 of 0.54 in the meniscal tear group.
Conclusion:
MMER had a greater influence on the mediolateral distribution of subchondral bone density in patients with medial knee OA than lower limb alignment, suggesting that the hoop function of the meniscus plays a more important role in altering stress distribution than leg alignment.
Keywords
The meniscus plays a crucial role in shock absorption, load transmission, and motion stability of the knee joint. 30 It distributes loads within the joint, converting axial compression into circumferential hoop stresses, which protect the articular cartilage.30,41 Meniscal injury disrupts this structural integrity, reducing hoop function and altering stress distribution in the knee joint.5,14,44 Consequently, meniscal injury increases focal stresses on the articular cartilage, contributing to the initiation and progression of osteoarthritis (OA) in the knee joint.4,10,36
Meniscal extrusion is defined as the displacement of the meniscus beyond the edge of the tibial plateau.13,29 This occurs due to degeneration or injury to the meniscus. 7 Recent studies have shown that meniscal extrusion exacerbates pain and accelerates articular cartilage loss in the knee joint, contributing to the progression of OA by impairing its load distribution function.3,6,14,16,19,39 Moreover, in vivo biomechanical studies have demonstrated that as meniscal extrusion increases, stress on the tibial articular surface also rises.9,25 However, while the influence of lower leg alignment on knee joint stress distribution has been extensively studied, the exact effect of meniscal extrusion on stress distribution within the knee joint in living humans has not been fully elucidated.
Direct measurement of stress distribution in the joints of living patients is challenging. Therefore, cadaveric biomechanical studies and finite element analyses are used as substitutes. Bone density, following the Wolff law—which states that bone strength increases in highly stressed areas, leading to mineralization—serves as a proxy for direct stress measurement. 11 Studies have indicated a relationship between bone density on the medial and lateral sides of the knee joint and the knee adduction moment, suggesting that bone density may adjust in response to joint surface stress. 45 Computed tomography (CT)–osteoabsorptiometry estimates stress distribution on living joint surfaces by analyzing the distribution of subchondral bone density across the articular cartilage. 32 This method has proven useful for evaluating in vivo stress distribution patterns in various joints.12,21,31,35,42 Previous studies have demonstrated that leg alignment influences stress distribution patterns across the proximal tibial joint surface in OA patients. 20 Additionally, this study has shown that high tibial osteotomy (HTO) shifts the high-density area (HDA) from the medial compartment of the proximal tibial articular surface to the lateral compartment, thereby supporting the efficacy of this procedure. 20
Although lower leg alignment has been widely recognized as a key factor influencing stress distribution in knee OA, the specific role of meniscal extrusion remains poorly understood. While previous studies have explored the biomechanical consequences of meniscal extrusion, few have quantitatively assessed its effect on stress distribution using CT–osteoabsorptiometry. We hypothesized that meniscal extrusion affects the stress distribution across the knee joint in patients with medial knee OA. This study aims to investigate the influence of meniscal extrusion on the distribution pattern of subchondral bone density across the proximal tibia in patients with medial knee OA using CT–osteoabsorptiometry. Additionally, we aim to compare the effects of meniscal extrusion between patients with and without medial knee OA.
Methods
Study Design
This study protocol was approved by the institutional review board of Hokaaido University Hospital. We conducted a retrospective analysis of preoperative CT and magnetic resonance imaging (MRI) scans of patients who underwent HTO from 2016 to 2021 at our hospital. The inclusion criteria were radiographic medial knee OA (Kellgren-Lawrence [K-L] grade ≥2), varus leg alignment, and availability of preoperative CT and MRI scans. Exclusion criteria included HTO performed for other diagnoses such as spontaneous osteonecrosis of the medial knee compartment or cartilage injury and previous surgery on the affected knee. Out of 83 patients who underwent HTO for medial knee OA during the study period, 24 were excluded. The remaining 59 patients, all with medial knee OA, were included in this study (OA group).
Additionally, data from 19 patients who underwent simultaneous radiographic, CT, and MRI examination of both knees for comparison of ipsilateral knee trauma between 2021 and 2023 were collected. The contralateral knees of these patients were used as control patients (non-OA group). Exclusion criteria for the non-OA group were radiographic OA (K-L grade ≥2), current pain, and previous surgery on the contralateral knee (Figure 1).

Flowchart of study enrollment. CT, computed tomography; HTO, high tibial osteotomy; KL, Kellgren-Lawrence; MRI, magnetic resonance imaging; OA, osteoarthritis.
Radiological Analysis
Bilateral standing full-length anteroposterior radiographs of the entire lower limb in full extension, along with lateral views of the knee, were used for evaluation. The following radiological parameters were assessed preoperatively. The degree of OA at the tibiofemoral joints was classified using the K-L classification of the weightbearing anteroposterior radiographs of the femorotibial joint. 23 Additionally, the hip-knee-ankle angle (HKA), percentage of mechanical axis (%MA), mechanical lateral distal tibial angle (mLDFA), and medial proximal tibial angle (MPTA) were measured from an anteroposterior radiograph of the whole lower limb taken with a long cassette in the 1-leg standing position.
Meniscal Status Evaluation
MRI examination was performed to assess meniscal extrusion and status. Coronal images were taken at 3.0-mm intervals using a 1.5-Tesla MRI scanner. The location of the medial meniscus (MM) on the joint line was quantified as previously described. 48 Briefly, an examiner (T.E.) drew a vertical line intersecting the peripheral margin of the medial tibial plateau on the coronal MRI image, which was sectioned at the midpoint of the superficial layer of the medial collateral ligament (Figure 2). Two additional lines were drawn parallel to this reference line: the second line at the outer (periarticular) margins of the meniscus and the third line at the inner (intra-articular) margin (Figure 2). The distance between the first and second lines was defined as extrusion width (EW), while the distance between the second and third lines was defined as total width (TW) (Figure 2).

Measurement of the medial meniscal location on coronal magnetic resonance imaging of the left knee. A vertical solid line intersecting the peripheral margin of the medial tibial plateau (MTP) was drawn. The second (dotted) and third (dashed) lines, parallel to the first, were drawn at the outer and inner margins of the meniscus, respectively. The distance between the first and second lines, defined as extrusion width (EW), and the distance between the second and third lines, defined as total width (TW), were measured. Both measurements were quantified in mm.
The meniscal extrusion ratio (MER) was defined as the ratio of EW to TW. This method was similarly applied to the lateral joint space to quantify the location of the lateral meniscus (LM). In each group, the locations of the MM and the LM on the joint line were independently measured by 2 orthopaedic surgeons (T.E., T.S.). Additionally, an examiner (T.E.) evaluated the MRI images to detect meniscal tears using the Lotysch and Mink MRI grading system.8,28,43 A subanalysis was performed by dividing the OA group based on the presence or absence of meniscal tears as per this grading system.8,28,43 Meniscal tears were classified as grade 3, while grades ≤2 were considered not to be tears. According to this classification, 35 patients had meniscal tears (group T) and 24 patients had no meniscal tears (group N) within the OA group. In addition, the types of MM tears were classified into posterior root tears of the MM (MMPRT) and non-MMPRT including horizontal tear and radial tear and assessed in group T. Among them, 27 patients had non-MMPRT including 17 with horizontal tears and 10 with radial tears, and 8 patients had MMPRT.
CT–Osteoabsorptiometry
A high-resolution helical CT scanner (Aquilion One/ViSION Edition; Toshiba Medical Systems) was used to acquire axial images of the knee, with patients positioned supine and their knees extended. The slice thickness and interval were set at 0.5 mm. The acquired CT data were transferred to a personal computer, and sagittal and coronal slices at 1.0-mm intervals, along with 3-dimensional (3D) bone models, were generated from the axial CT data using commercial software (Ziocube; Ziosoft, Inc). The sagittal and coronal axes were determined by referencing the epicondylar axis of the distal femoral condyle on the axial slices.
Using sagittal and coronal CT images, as well as a 3D CT model of the articular surface of the proximal tibial articular surface, the medial and lateral compartments of the proximal tibial articular surface were manually outlined to include the entire subchondral bone layer across all slices.12,20 The subchondral bone density of each generated sagittal slice was then analyzed using noncommercial software (OsteoDens 4.0). The software automatically identified the maximal increment point in Hounsfield units from the joint surface as the starting point of the region of interest, and the maximal value in Hounsfield units was selected within the 2.5-mm region of interest from this point.
The radiodensity of the identified subchondral bone region was determined at each coordinate point at 1-mm intervals. A 2-dimensional image mapping the distribution of subchondral bone density was then created by stacking the sagittal slices (Figure 3, A and B).

Identification of subchondral bone regions in the proximal tibia using customized software. (A, B) The subchondral bone density of the selected region was automatically measured at each coordinate point in each 1.0-mm sagittal slice. (C) Quantitative analysis of the mapping data was performed to calculate the medial ratio. The high-density area (HDA) was defined as the region containing the coordinate points representing the top 20% of Hounsfield unit values from the total area of the medial and lateral compartments. The medial ratio was calculated as the ratio of the medial compartment HDA to the total HDA of both compartments.12,20
Quantitative analysis of the mapping data focused on identifying the location of the HDA on the articular surface. The HDA was defined as the region containing the top 20% of Hounsfield unit values from the medial and lateral compartments (Figure 3C). The medial ratio was calculated as the proportion of the HDA in the medial compartment relative to the total HDA of both compartments. 20
The subchondral bone density of the selected region was automatically measured at each coordinate point in each 1.0-mm sagittal slice (Figure 3, A and B). Quantitative analysis of the mapping data was performed to calculate the medial ratio (Figure 3, C). The HDA was defined as the region containing the coordinate points representing the top 20% of Hounsfield unit values from the total area of the medial and lateral compartments. The medial ratio was calculated as the ratio of the medial compartment HDA to the total HDA of both compartments.
Two observers (T.E. and T.S.) conducted the examination to assess the percentage of HDA using the noncommercial software. Intra- and interobserver reliability were evaluated on 5 randomly selected knees from both the non-OA and the OA groups. The intraobserver reproducibility of the medial ratio measured by CT–osteoabsorptiometry showed the following interclass correlation coefficients (ICCs) for intraobserver agreement 0.916 for one observer (T.E.) and 0.910 for the other observer (T.S.). The ICC for interobserver reproducibility of the medial ratio was 0.904.
Statistical Analysis
Statistical analyses were performed using JMP Pro 17.0 (SAS Institute Inc). An unpaired Student t test and chi-square test were used to compare patients with and without OA. To examine the relationship between the medial ratio and various explanatory variables such as meniscal EW, the ratio of meniscal extrusion, and lower limb alignment, both simple linear regression and multiple regression analyses were conducted.
First, simple linear regression analyses were performed for each explanatory variable individually to assess its separate effects on the medial ratio. Subsequently, multiple regression analysis was conducted to evaluate the combined effects of all explanatory variables on the medial ratio. The initial regression model included all explanatory variables, and multicollinearity was assessed using the variance inflation factor (VIF). Variables with VIF values >5 were excluded from the final model to ensure reliable coefficient estimates. For both simple and multiple regression analyses, the coefficient of determination (R2), P values, and standardized coefficients were used to assess the models. A P value of .05 was set as the significance level.
Results
There were 59 patients in the OA group and 19 participants in the non-OA group (Table 1). The OA group was older, with a mean age of 56.9 years (95% CI, 54.6-59.2), compared with 35.7 years (95% CI, 30.1-41.4) in the non-OA group (P < .001). HKA and %MA were −7.4° and 15.9%, respectively, in the OA group, compared with −2.1° and 36.5% in the non-OA group (P < .001). The MPTA was also lower in the OA group (P < .001). The mean EW of the MM was 5.4 mm (95% CI, 5.0-5.8) in the OA group and 1.0 mm (95% CI, 0.8-1.3) in the non-OA group (P < .001). Similarly, the medial MER (MMER) was higher in the OA group (64.8%) compared with the non-OA group (12.5%) (P < .001). The medial ratio in the OA group (81.8%, 95% CI, 79.5-84.2) was also higher than that in the non-OA group (62.0%; 95% CI, 57.7-66.3) (P < .001) (Figure 4).
Patient Characteristics, Lower Limb Alignment, Meniscal Status, and Medial Ratio in the OA and Non-OA Groups a

Data are presented as mean (95% CI) unless otherwise indicated. EW, extrusion width of the meniscus; F, female; HKA, hip-knee-ankle angle; M, male; mLDFA, mechanical lateral distal femoral angle; MPTA, medial proximal tibial angle; OA, osteoarthritis; TW, total width of the meniscus.

Representative images showing high-density areas in the subchondral bone in osteoarthritis (OA) and non-OA groups. (A) Non-OA patients; the medial ratio was 57.3%. (B) OA patients without meniscal tears; the medial ratio was 85.7%. (C) OA patients with medial meniscus posterior root tear; the medial ratio was 90.1%.
Simple regression analysis revealed correlations between the medial ratio and HKA (R2 = 0.216; P < .001), MPTA (R2 = 0.109; P = .01), and the MMER (R2 = 0.307; P < .001) in the OA group (Table 2). In contrast, no correlations were observed between the medial ratio and lower limb alignment parameters in the non-OA group; however, a correlation was found between the medial ratio and MMER (R2 = 0.217; P = .045) (Table 2).
Simple Regression Analysis Exploring the Correlation Between Lower Limb Alignment, Meniscal Extrusion, and Medial Ratio a

%MA, percentage of mechanical axis; BMI, body mass index; EW, extrusion width of the meniscus; HKA, hip-knee-ankle angle; LM, lateral meniscus; LMER, lateral meniscal extrusion ratio; mLDFA, mechanical lateral distal femoral angle; MM, medial meniscus; MMER, medial meniscal extrusion ratio; MPTA, medial proximal tibial angle; OA, osteoarthritis.
Multiple regression analysis identified MMER and HKA as significant variables in the OA group, and MMER a significant variable in the non-OA group, after excluding variables with VIF values >5. The overall model demonstrated an adjusted R2 value of 0.38 (P < .001) in the OA group and 0.26 (P < .001) in the non-OA group. The standardized coefficient for MMER (0.465 in the OA group and 0.549 in the non-OA group) was greater than that for HKA (−0.340 in the OA group and −0.010 in the non-OA group) (Table 3).
Multivariable Regression Analysis of Factors Influencing the Medial Ratio a

The overall model had an adjusted R2 of 0.38 (P < .001) in the medial OA group and 0.26 (P < .001) in the non-OA group. HKA, hip-knee-ankle angle; LMER, lateral meniscal extrusion ratio; mLDFA, mechanical lateral distal femoral angle; MMER, medial meniscal extrusion ratio; OA, osteoarthritis.
In the subsequent subanalysis, the OA group was divided into those with and without meniscal tears (Table 4). The subanalysis showed that the mean EW of both the MM and the LM was greater in group T compared with group N (MM, 6.0 mm; 95% CI, 5.5-6.6; vs 4.5 mm; 95% CI, 3.9-5.1; P < .001), (LM, 1.8 mm; 95% CI, 1.4-2.0; vs 1.3 mm; 95% CI, 1.0-1.5; P < .001). The MMER was higher in group T (70.1%; 95% CI, 64.7-75.5) than in group N (57.3%; 95% CI, 49.0-65.5) (P = .007). The ratio of lateral meniscal extrusion (LMER) was also higher in group T (15.7%; 95% CI, 12.7-18.7) compared with group N (10.9%; 95% CI, 8.9-13.0) (P = .02).
Patient Characteristics, Lower Leg Alignment, Meniscal Status, and Medial Ratio in the OA Group With and Without Meniscal Injury a

Data are presented as mean (95% CI) unless otherwise indicated. EW, extrusion width of the meniscus; F, female; K-L, Kellgren-Lawrence; M, male; mLDFA, mechanical lateral distal femoral angle; MPTA, medial proximal tibial angle; TW, total width of the meniscus.
In simple regression analysis, HKA and MMER were correlated with the medial ratio in both groups (Table 5). Multivariable regression analysis revealed that the overall model had an adjusted R2 value of 0.54 in group T and 0.21 in group N. The standardized coefficient for MMER was greater than that for HKA in group T (0.554 vs −0.329). The prediction equation obtained from multiple regression analysis was as follows: medial ratio = −0.622 + 0.335 × MMER – 0.203 × LMER – 0.008 × HKA + 0.014 × mLDFA. In group N, no correlations were found between any explanatory variables and the medial ratio (Table 6).
Simple Regression Analysis Exploring the Correlation Between Lower Limb Alignment, Meniscal Extrusion, and the Medial Ratio in Patients With and Without Medial Meniscal Injury a
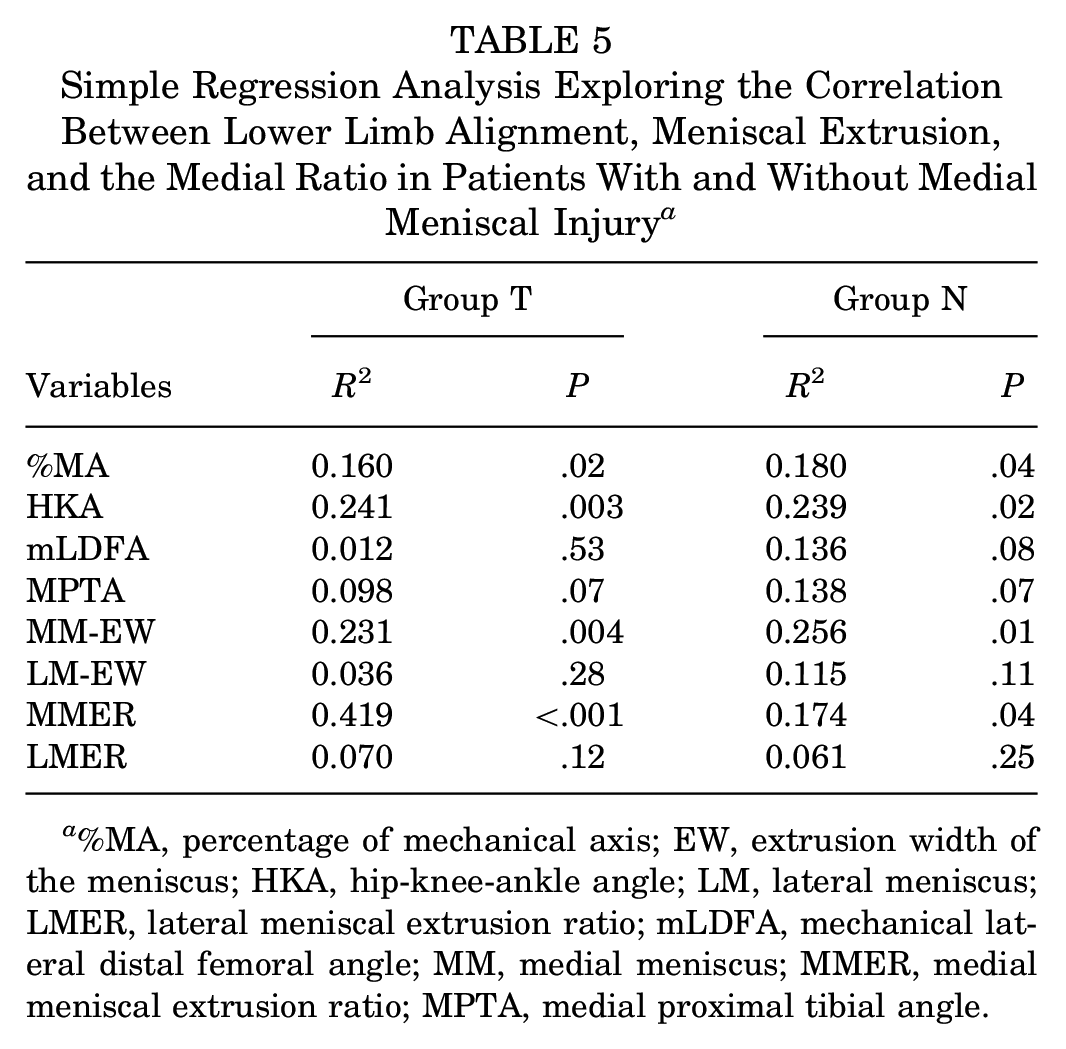
%MA, percentage of mechanical axis; EW, extrusion width of the meniscus; HKA, hip-knee-ankle angle; LM, lateral meniscus; LMER, lateral meniscal extrusion ratio; mLDFA, mechanical lateral distal femoral angle; MM, medial meniscus; MMER, medial meniscal extrusion ratio; MPTA, medial proximal tibial angle.
Multivariable Regression Analysis Assessing the Influence on the Medial Ratio in Osteoarthritic Patients With and Without Meniscal Injury a
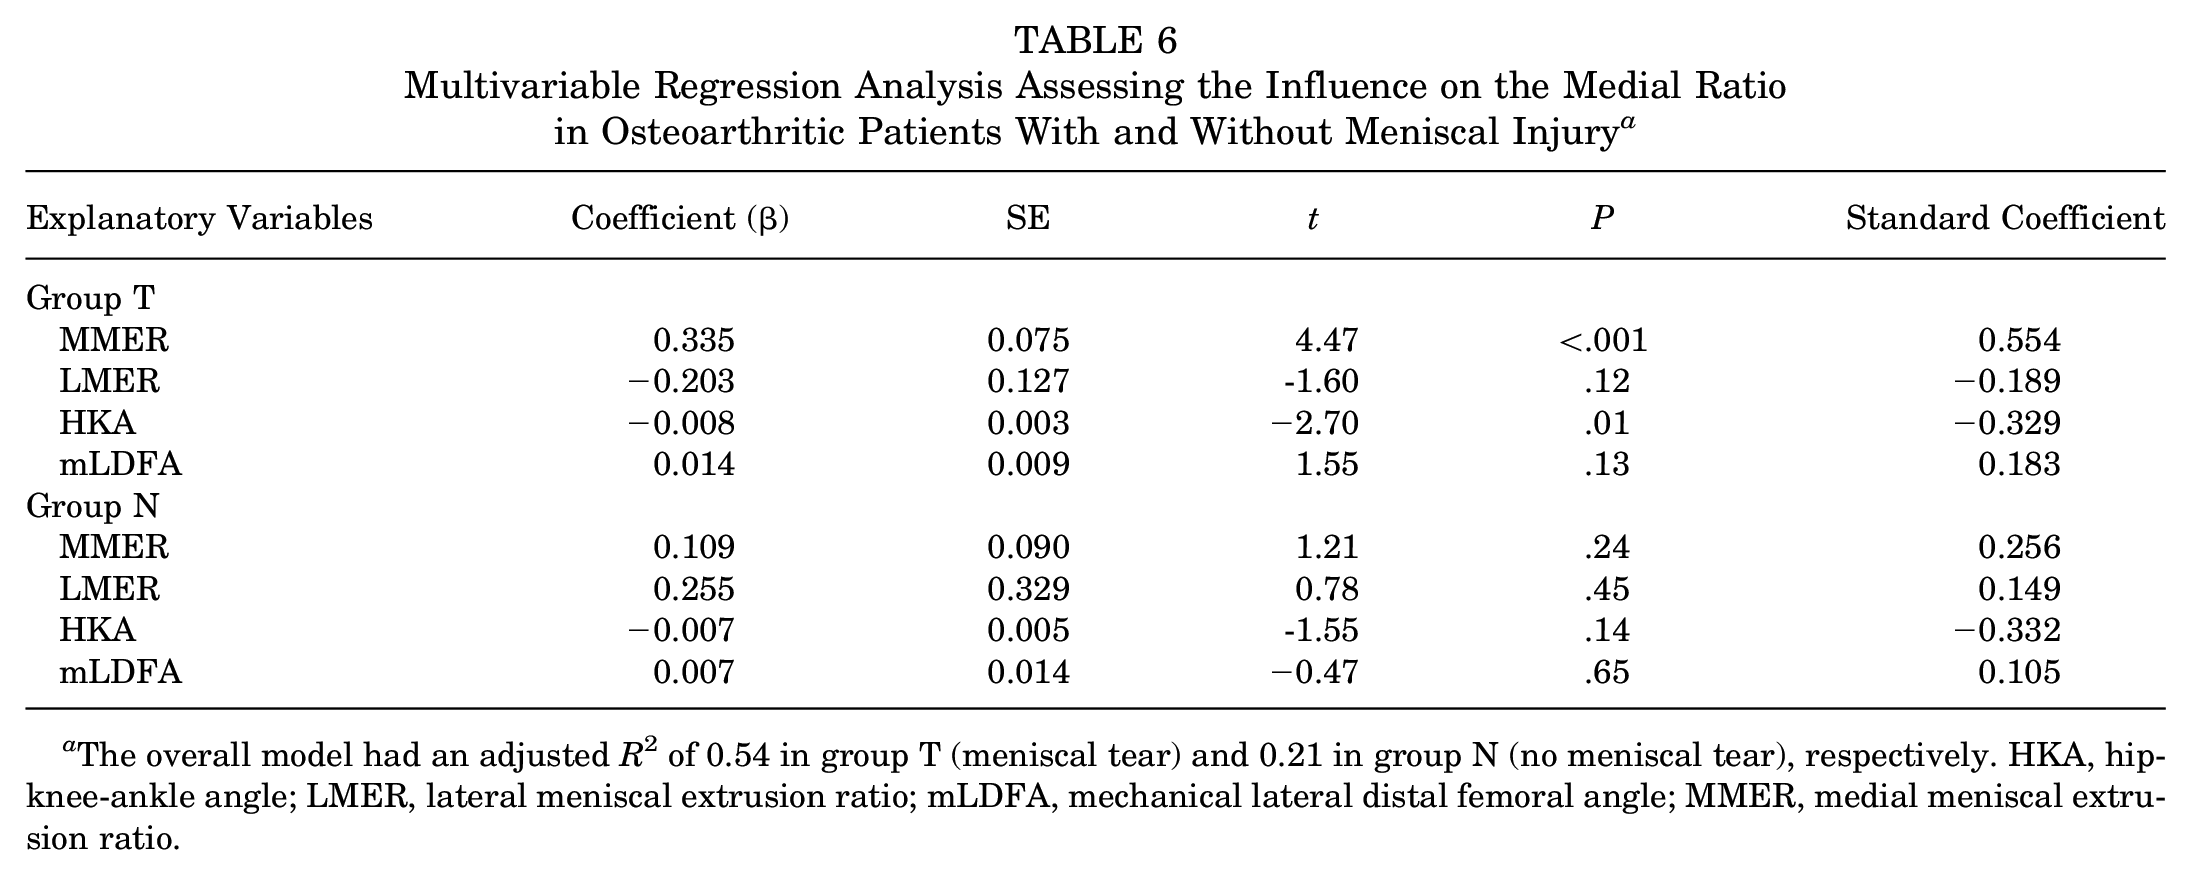
The overall model had an adjusted R2 of 0.54 in group T (meniscal tear) and 0.21 in group N (no meniscal tear), respectively. HKA, hip-knee-ankle angle; LMER, lateral meniscal extrusion ratio; mLDFA, mechanical lateral distal femoral angle; MMER, medial meniscal extrusion ratio.
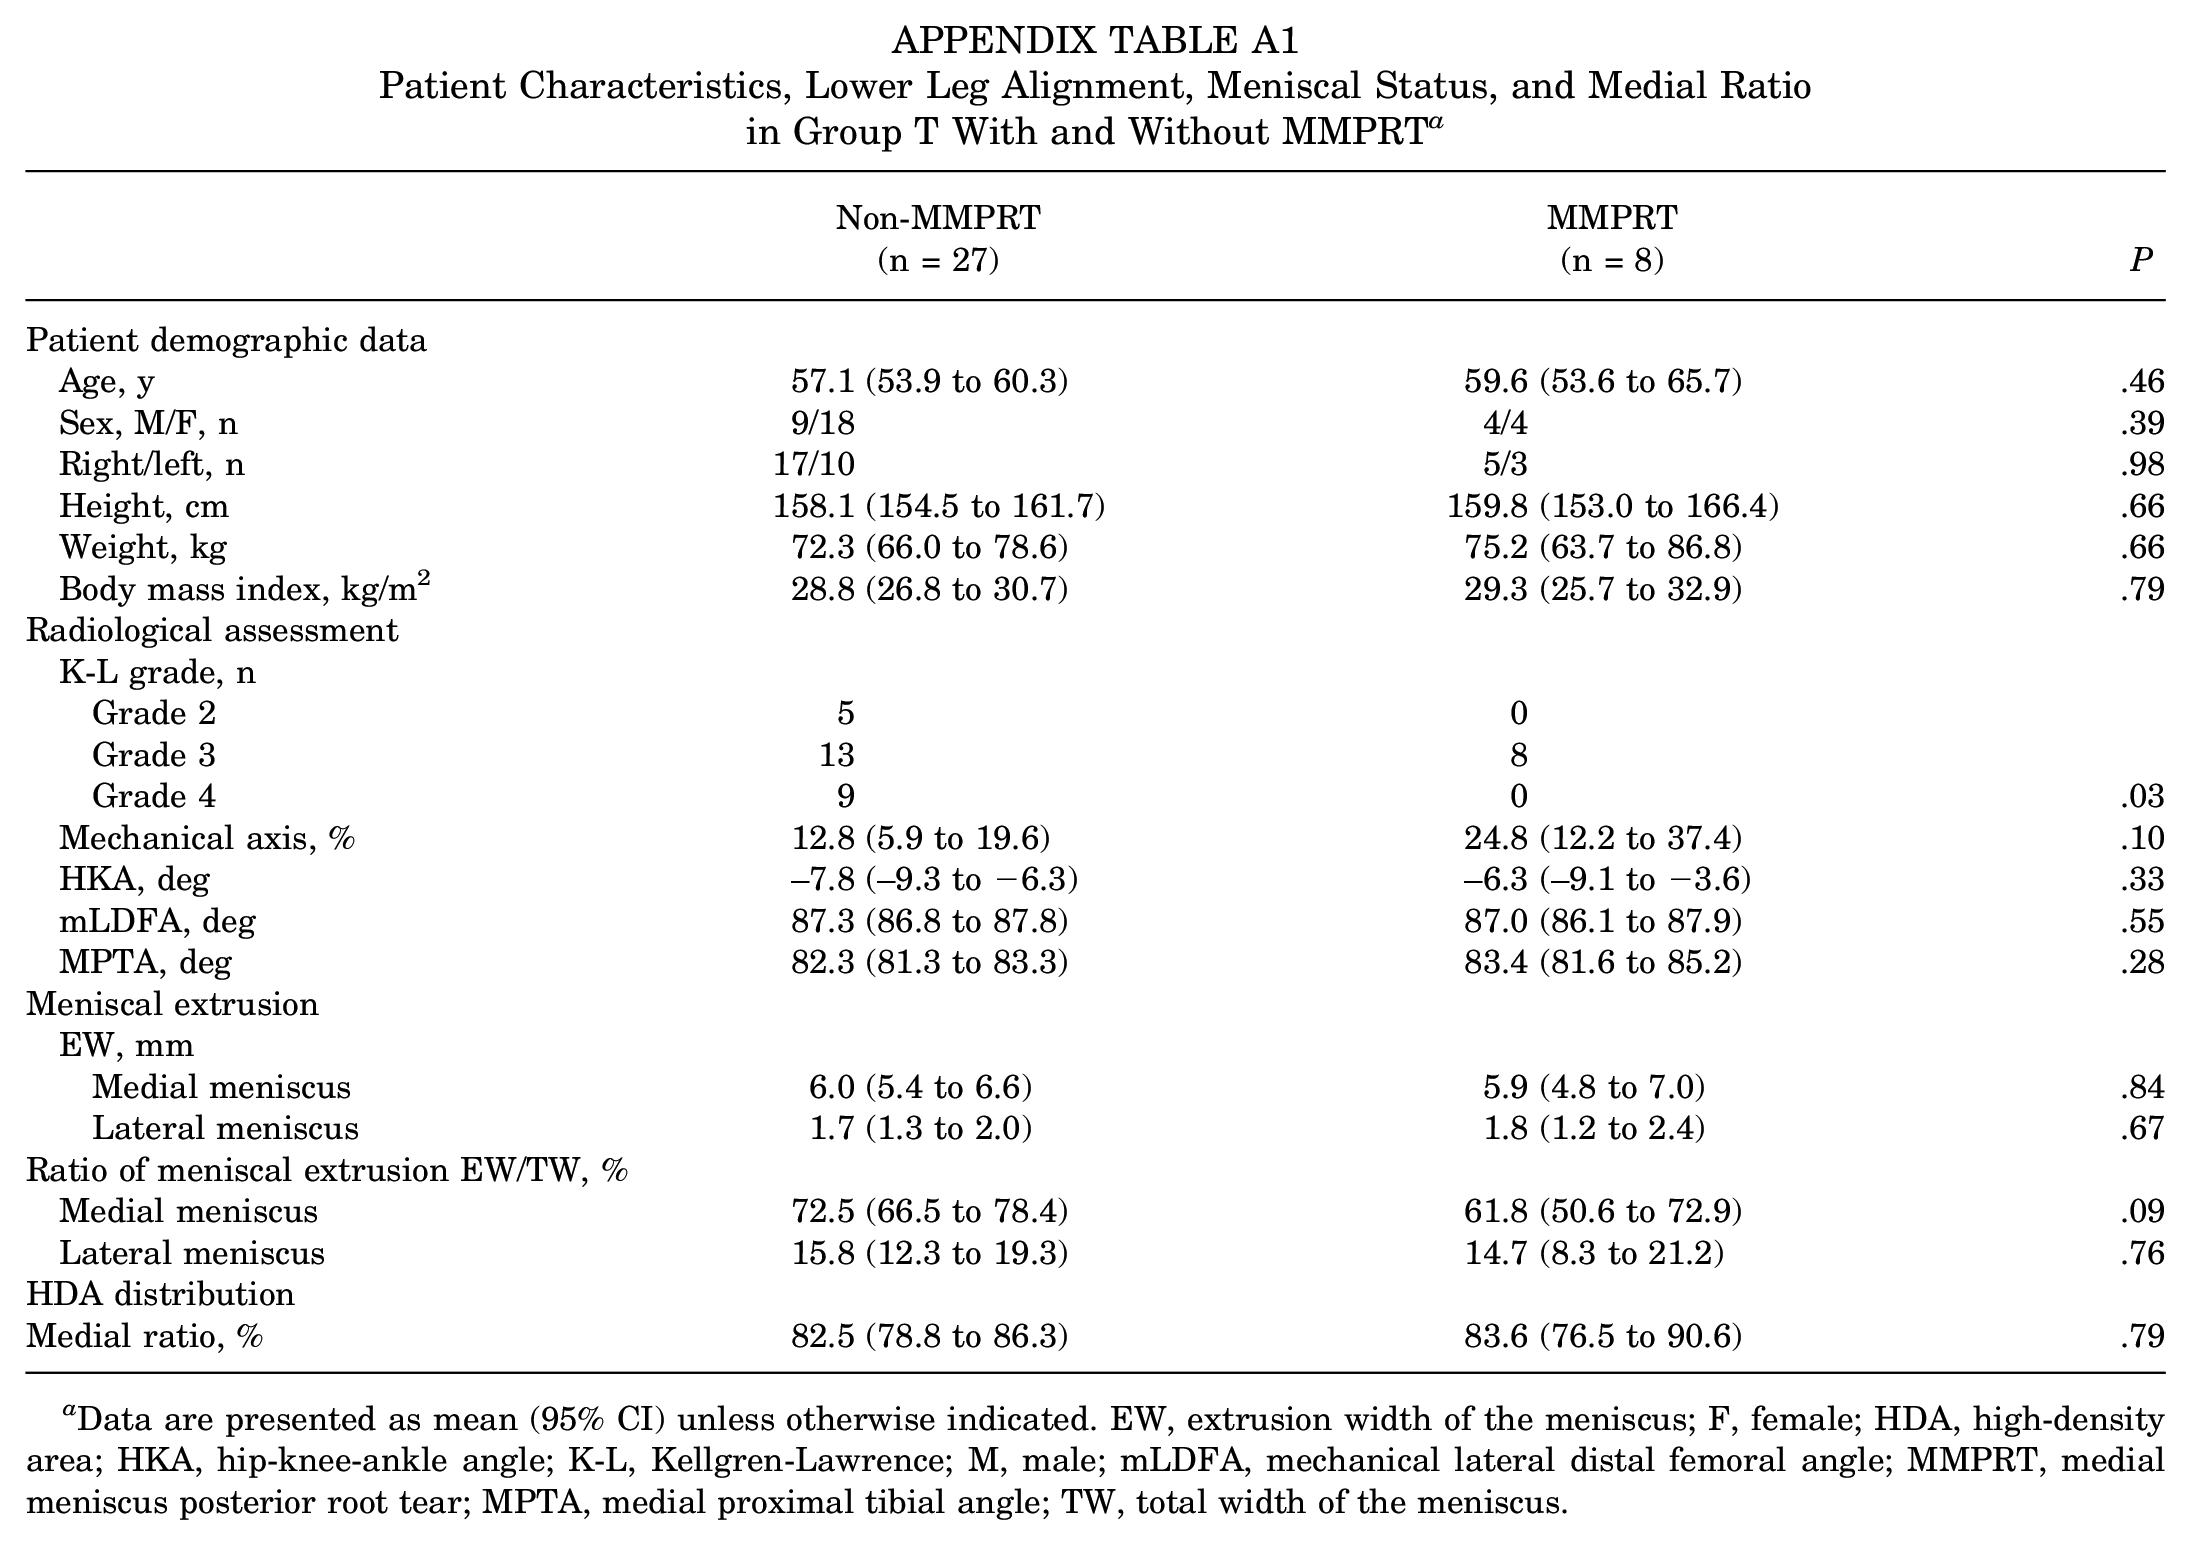
In addition, 35 patients in Group T were categorized into MMPRT and non-MMPRT groups for assessment. Among them, 27 patients had non-MMPRT tears, including 17 with horizontal tears and 10 with radial tears, while 8 patients had MMPRT. The K-L grade in the patients without MMPRT was significantly higher than that in those with MMPRT. The medial ratio showed no significant difference between the MMPRT and non-MMPRT groups (P = .79), although the MMER tended to be lower in the MMPRT group than in the non-MMPRT group (P = .09), and the mechanical axis tended to be less varus in the MMPRT group (P = .10) (Appendix Table A1).
Discussion
This is the first study to elucidate the effects of meniscal extrusion on the distribution patterns of subchondral bone density across the knee joint in patients with medial knee OA. MM extrusion was associated with the medial ratio, exerting a greater influence than lower limb alignment parameters, including HKA and MPTA, in patients with medial OA. Additionally, in the non-OA group, a correlation was observed between MMER and the medial ratio, while no correlations were found between lower limb alignment and the medial ratio.
Our results demonstrated that both lower limb alignment and MM extrusion affected the medial ratio, with the influence of MM extrusion’s being greater than that of lower limb alignment. These findings suggest that the hoop function of the MM plays a stronger role in load distribution within the tibia compared with lower leg alignment. A study using total knee arthroplasty implants with tibial component pressure sensors reported that mediolateral force distribution in the knee joint depended on overall leg alignment, 26 indicating that stress distribution in the knee joint without a meniscus is influenced by alignment. Finite element analysis has shown that MM extrusion increases stress loading on medial compartment structures.15,25 Additionally, in vivo biomechanical studies have demonstrated that MM extrusion >4 mm reduces medial compartment contact area due to disrupted load transmission. 9 Based on these studies, while load distribution in the knee joint without the meniscus depends on leg alignment, the meniscus itself influences stress distribution in a functioning knee. Our findings, which show that MM extrusion has a greater influence on stress distribution than leg alignment, support these previous studies. Furthermore, our results indicated that the effect of extrusion on stress distribution surpasses that of alignment. This contributes valuable insight into understanding stress distribution in the knee joint of patients with OA, as no previous studies have concurrently assessed the effects of meniscal extrusion and alignment on stress.
Our study demonstrated that in non-OA patients, leg alignment did not affect the medial ratio, while MM extrusion was correlated with the medial ratio. This suggests that stress distribution is influenced by the hoop function of the meniscus rather than leg alignment when the meniscus is intact. A cadaveric study showed that varus alignment, combined with an intact meniscus, did not lead to an increase in medial compartment peak pressure or a decrease in contact area compared with partial resection of an MM tear. 47 Combined with our results, leg alignment has minimal effect on stress distribution when the meniscus is functioning. A biomechanical study has shown that radial tears involving up to 60% of the meniscal rim width did not affect the magnitude or location of peak contact pressure. However, radial tears involving 90% resulted in increased pressure in the posterocentral area compared with the intact condition. 5 Additionally, posterior root tears of the meniscus increase knee contact force.1,40,49 Our subanalysis revealed that the effect of MM extrusion on the medial ratio varied depending on the presence or absence of MM injury in the OA patient group. Therefore, once the hoop function of the MM is compromised in patients with medial OA, it becomes more vulnerable to further deterioration, which may reflect the progression of OA and contribute to the negative cycle of the disease.
A comparative analysis based on the presence or absence of MMPRT revealed that the MMPRT group tended to less varus alignment and a smaller MMER. Although the predictive formula suggested a lower medial ratio in the MMPRT group than in the non-MMPRT group, there was no significant difference in medial ratio between the groups. This may be attributed to the loss of the ability to absorb hoop stress in MMPRT, making it difficult to explain the decreased ability to absorb hoop stress of the meniscus solely through MRI-based measures of meniscal extrusion. Additionally, the increased load on the medial compartment with MMPRT was strongly influenced by the loss of the ability to absorb hoop stress of the meniscus, potentially leading to a lack of association with alignment. Therefore, the extent of meniscal extrusion on MRI or alignment observed in the case with MMPRT might not reliably predict the increased medial load or the progression of OA unlike other types of meniscal tears. However, given the relatively small sample size of the MMPRT group (n = 8), these trends should be interpreted with caution.
Microstructural and histopathological alterations in subchondral bone were observed in OA patients.17,18 Some studies demonstrated that the subchondral bone marrow lesion (BML) in the medial femoral condyle or tibial plateau was associated with knee pain and cartilage degeneration in OA patients.18,38 HDA of the subchondral bone across the knee joint using CT–osteoabsorptiometry method was thought to be an adaptive response to mediolateral loading on the joint. Thus, the medial ratio may also be associated with symptoms like BML. However, in the present study, we focused on the relationship between distribution of subchondral bone density in the proximal tibial articular surface and biomechanical factor including meniscal extrusion and leg alignment. Future studies are needed to investigate the relationship between the medial ratio and knee symptoms including pain.
The previous study20 demonstrated that lower leg alignment correlated with the distribution of subchondral bone density in patients with medial OA and that the medial ratio shifted toward the lateral compartment after HTO, 20 supporting the stress-shifting effect of HTO.2,33 This study further showed that the MMER was associated with the medial ratio, with this relationship being more pronounced in patients with MM injury. Biomechanical studies have shown that meniscal repair reduces peak contact pressure in the knee joint.5,40,44 Therefore, combining meniscal repair with HTO may more effectively reduce medial compartment stress compared with HTO alone, potentially decreasing the progression of medial OA and reducing the need for conversion to TKA.24,34,46
The restoration of the ability to absorb hoop stress after meniscal transplantation remains incompletely understood. However, previous studies have reported that the MMER after meniscal transplantation ranges from 30% to 40%.22,27 Assuming that the preoperative condition remains applicable after HTO, the prediction equation for the medial ratio in this study suggests that a reduction in MMER from 70% preoperatively to 40% postoperatively would result in an approximately 10% improvement in the medial ratio. This implies that a preoperative medial ratio of 0.8 would improve to 0.7. However, in cases of severe varus alignment, the medial ratio may not fully normalize, indicating that the need for concomitant HTO should be considered as a potential decision-making criterion.
Limitations
There were several limitations to this study. First, while we evaluated the distribution of subchondral bone density on the tibial articular surface, we did not measure the actual contact stress on the knee joint. Second, the extrusion and extrusion ratio of the meniscus were measured from MRI images taken in a nonweightbearing position, which may differ from measurements in a weightbearing position. However, a previous report indicated that the difference in meniscal extrusion between weightbearing and nonweightbearing positions was within 1 mm, suggesting that the overall trend remains similar. 37 Third, meniscal extrusion in this study was assessed in a specific region on MRI, limiting the evaluation to 2-dimensional analysis. Future studies utilizing 3D imaging could measure the meniscal thickness and coverage area on the tibial articular surface, providing more robust evidence of the effect of meniscal extrusion on load distribution in the knee joints. Additionally, the patients in the non-OA group were younger than those in the OA group, and the age difference between the 2 groups could influence our results. We define the medial ratio as the proportion of the HDA in the medial compartment relative to the total HDA within the subchondral bone of the tibial joint surface. While younger individuals generally have higher bone mineral density than those with OA, using this ratio allows for standardization across individuals, reducing the effect of absolute differences in bone density and enhancing the generalizability of our findings. However, the observed associations should be interpreted with caution, as they do not imply causality.
Conclusion
The extrusion of the MM was positively correlated with the distribution of subchondral bone density across knee joints, and its effect was greater than that of lower limb alignment in patients with medial OA. Additionally, the distribution of tibial subchondral bone density in OA patients with concomitant MM injury is more correlated with MM extrusion compared with those without such injury.
Footnotes
Appendix
Patient Characteristics, Lower Leg Alignment, Meniscal Status, and Medial Ratio in Group T With and Without MMPRT a
| Non-MMPRT |
MMPRT |
P | |
|---|---|---|---|
| Patient demographic data | |||
| Age, y | 57.1 (53.9 to 60.3) | 59.6 (53.6 to 65.7) | .46 |
| Sex, M/F, n | 9/18 | 4/4 | .39 |
| Right/left, n | 17/10 | 5/3 | .98 |
| Height, cm | 158.1 (154.5 to 161.7) | 159.8 (153.0 to 166.4) | .66 |
| Weight, kg | 72.3 (66.0 to 78.6) | 75.2 (63.7 to 86.8) | .66 |
| Body mass index, kg/m2 | 28.8 (26.8 to 30.7) | 29.3 (25.7 to 32.9) | .79 |
| Radiological assessment | |||
| K-L grade, n | |||
| Grade 2 | 5 | 0 | |
| Grade 3 | 13 | 8 | |
| Grade 4 | 9 | 0 | .03 |
| Mechanical axis, % | 12.8 (5.9 to 19.6) | 24.8 (12.2 to 37.4) | .10 |
| HKA, deg | –7.8 (–9.3 to −6.3) | –6.3 (–9.1 to −3.6) | .33 |
| mLDFA, deg | 87.3 (86.8 to 87.8) | 87.0 (86.1 to 87.9) | .55 |
| MPTA, deg | 82.3 (81.3 to 83.3) | 83.4 (81.6 to 85.2) | .28 |
| Meniscal extrusion | |||
| EW, mm | |||
| Medial meniscus | 6.0 (5.4 to 6.6) | 5.9 (4.8 to 7.0) | .84 |
| Lateral meniscus | 1.7 (1.3 to 2.0) | 1.8 (1.2 to 2.4) | .67 |
| Ratio of meniscal extrusion EW/TW, % | |||
| Medial meniscus | 72.5 (66.5 to 78.4) | 61.8 (50.6 to 72.9) | .09 |
| Lateral meniscus | 15.8 (12.3 to 19.3) | 14.7 (8.3 to 21.2) | .76 |
| HDA distribution | |||
| Medial ratio, % | 82.5 (78.8 to 86.3) | 83.6 (76.5 to 90.6) | .79 |
Data are presented as mean (95% CI) unless otherwise indicated. EW, extrusion width of the meniscus; F, female; HDA, high-density area; HKA, hip-knee-ankle angle; K-L, Kellgren-Lawrence; M, male; mLDFA, mechanical lateral distal femoral angle; MMPRT, medial meniscus posterior root tear; MPTA, medial proximal tibial angle; TW, total width of the meniscus.
Acknowledgements
We are grateful to the staff of the Department of Orthopaedic Surgery, Faculty of Medicine, and Graduate School of Medicine of Hokkaido University, who gave of their time and expertise.
Final revision submitted March 23, 2025; accepted May 27, 2025.
One or more of the authors has declared the following potential conflict of interest or source of funding: The institution of K.I. has received funding from Olympus Terumo Biomaterials CORP. AOSSM checks author disclosures against the Open Payments Database (OPD). AOSSM has not conducted an independent investigation on the OPD and disclaims any liability or responsibility relating thereto.
Ethical approval for this study was obtained from the institutional review board of Hokkaido Universty Hospital (approval No. 018-0213).