
Abstract
Background:
Patellar instability treatment outcomes vary. Early prediction of patient responses to treatment is needed to personalize interventions, reduce recurrent instability, and improve outcomes. Existing scores that predict outcomes rely on 2-dimensional (2D) imaging measures that do not fully capture 3-dimensional (3D) anatomical data.
Purpose/Hypothesis:
We aimed to develop a 3D medical imaging-based anatomical score of patellar instability severity. It was hypothesized that our 3D score would demonstrate stronger associations with instability history and posttreatment patient-reported outcomes (PROs) than a 2D imaging score.
Study Design:
Cohort study (diagnosis); Level of evidence, 2.
Methods:
Pretreatment magnetic resonance images from 26 control patients and 244 patients with first-time and recurrent patellar instability were retrospectively analyzed from 2 sites associated with the prospective JUPITER (Justifying Patellar Instability Treatment by Results) study group. Using statistically derived 3D features that reflect relative bone positions and bone shape, as well as 2D imaging measures, we developed several preliminary anatomical severity scores. We tested these scores based on the ability to distinguish first-time from recurrent instability patients. Then, we assessed correlations between these scores and baseline and 1-year posttreatment PROs, using the Kujala Anterior Knee Pain Scale (Kujala) and Banff Patellar Instability Instrument 2.0 (BPII 2.0). A final score—the 3D Patellar instability Anatomical Severity Score (3D-PASS)—was created to best correlate with PROs.
Results:
3D-PASS, based on patellar and tibial positions relative to the femur, distinguished first-time from recurrent instability patients (P = .002) and correlated with 1-year outcomes (rnonop Kujala = −0.70; rnonop BPII 2.0 = −0.68, rop Kujala = −0.23; rop BPII 2.0 = −0.25). 3D relative bone positions were more informative than 2D imaging measures and 3D bone shape, neither of which correlated with outcomes.
Conclusion:
A higher 3D-PASS is associated with instability history and worse outcomes across all patients (first-time and recurrent) treated nonoperatively or operatively. While 3D relative bone positions correlated with outcomes, 3D bone shapes did not.
Keywords
Patellar instability involves partial or complete dislocation of the patella and can result in pain, decreased quality of life, and increased risk of osteoarthritis.16,33 The paradigm historically used to treat patellar instability is simple and based on limited information: Patients without previous instability history whose injuries do not involve osteochondral fractures have typically been recommended for nonoperative treatment.2,14,17,22 Approaches today are evolving because nonoperative treatment outcomes vary; one-third of nonoperative patients undergo recurrent dislocations, 9 and nearly two-thirds experience activity limitations 6 months after injury. 1 Identifying patients who might benefit from surgical intervention after first-time instability may prevent recurrent dislocations and associated chondral damage. 13 It is also important to avoid overtreatment. Among patients treated operatively, the complication rate 34 is 26%. Accurate prediction of a patient's response to treatment would enable surgeons to personalize interventions and improve patient outcomes,2,9,14,17,20,22 support patient-centered decision-making, and clarify the risks and benefits of treatment options.
Several scores have been proposed to predict the recurrence of patellar instability. These scores are based on age, skeletal maturity, bilateral instability, and traditional 2-dimensional (2D) imaging measures of instability—including patellar tilt, patella alta, trochlear dysplasia, the tibial tubercle-trochlear groove (TT-TG) distance, and the TT-TG distance-to-patellar length ratio.2,14,17,22 While these scores are associated with episodes of recurrence, they have not yet demonstrated associations with pain or quality of life, which may better reflect the effects of patellar instability. In addition, these scores rely on traditional 2D imaging measures, which are subject to rater variability 10 and do not consider the potential value of all of the information captured by 3-dimensional (3D) magnetic resonance imaging (MRI) scans.
Statistical shape models quantify anatomy and have been used to identify 3D shape features that predict the onset of knee osteoarthritis,26,38 identify bone shapes associated with anterior cruciate ligament (ACL) injury, 30 and highlight variation in pediatric skeletons. 5 Bowes et al 4 used knee osteoarthritis bone shape features to develop an objective score that is associated with pain and function and is a more sensitive measure of osteoarthritis severity than the traditional Kellgren-Lawrence system. 18 This single metric is an efficient way to describe complex 3D anatomy and has the potential to extend to other orthopaedic domains.
This study aimed to develop a single 3D anatomical score of patellar instability that reflects instability severity, based on previous instability history, and that correlates with patient-reported outcomes (PROs). This score could help clinicians assess the 3D anatomical severity of new patellar instability in patients and predict their treatment responses. We hypothesized that this 3D score would demonstrate stronger associations with instability severity and PROs than a score based on traditional 2D imaging measures.
Methods
This study was a retrospective cohort analysis of data from 244 patients with first-time and recurrent patellar instability, prospectively collected by 2 sites of the JUPITER (Justifying Patellar Instability Treatment by Results) study group3,19; and 26 controls with ACL injury. We characterized 3D knee relative bone positions and bone shape through a statistical knee model and evaluated several scores of patellar instability based on their associations with instability history and PROs. Based on these findings, we created a 3D Patellar instability Anatomical Severity Score (3D-PASS) to best correlate with outcomes.
Written informed assent and consent were obtained from all participants and their guardians. All study procedures were approved by our institutional review boards.
Participants
JUPITER is a prospective cohort study with 12 participating centers and 1833 enrolled patients with documented patellar instability. Patients were eligible to participate in the JUPITER study if they were <35 years. Skeletally mature and immature patients were included. Patients who had or needed multiligament reconstructions, patients with developmental delays that would affect their ability to answer survey forms, and non-native English speakers were excluded.
In this study, we conducted a retrospective analysis of data from the 2 sites of the JUPITER study group with the largest cohorts (Institutions A and B). From 2017 to 2021, these sites recruited 1019 patients with first-time and recurrent patellar instability. From these patients, we included those with baseline (postinjury, pretreatment) proton density (PD)-weighted MRIs that did not contain metal artifacts. While this excluded patients with alternately sequenced MRIs, we chose to analyze PD-weighted MRIs because a subset of patients had high-resolution 3D scans with this sequence, ideal for developing a statistical knee model.
Patients with patellar instability were classified as patients with first-time or recurrent instability based on their history of patellar instability at study enrollment: Patients with a single episode of instability were classified with first-time instability, and patients with >1 episode of instability were classified as having recurrent instability. Patients with recurrent instability may have been treated before study enrollment with nonoperative or operative treatment. After enrollment, the nonoperative or operative treatment decision was made by the patient, their family, and their physician. Patients treated nonoperatively and operatively were included in this study.
A control cohort consisted of 26 patients from Institution A with ACL injuries. This convenience sample was age-matched to the patients with patellar instability from Institution A. Patients with ACL injuries were selected as controls because anatomical risk factors for patellar instability differ from those for ACL injury. 12 Patients with patellar instability and previous ACL injury were excluded.
Figure 1 depicts participant inclusion and the subsets of participant data used in each stage of the analysis.

Patient flow diagram. Patients enrolled at institutions A and B of the JUPITER study group were assessed for eligibility and included for analysis if they had baseline (pretreatment) PD-weighted MRIs without metal artifacts. Patients with ACL injury were selected as controls from Institution A to be age-matched with patients with patellar instability from Institution A. The bottom row of the diagram reflects the overlapping subsets of patient data used in each stage of the development and validation of 3D-PASS. 3D-PASS was developed using an age-matched set of control and recurrent instability knees and was thus restricted to patients of Institution A. All participants from Institutions A and B with instability history were included in the instability severity association step of 3D-PASS validation, which identified group differences between the control, first-time instability, and recurrent instability cohorts. Ten participants did not have a recorded instability history and were thus excluded from this step. All patients from Institutions A and B with PROs were included in the PRO association step of 3D-PASS validation, which identified correlations between 3D-PASS and baseline and 1-year PROs. ACL, anterior cruciate ligament; JUPITER, Justifying Patellar Instability Treatment by Results; MRI, magnetic resonance imaging; PD, proton density; PRO, patient-reported outcomes; 3D-PASS, 3-dimensional Patellar instability Anatomical Severity Score.
Demographic, Imaging, and Outcome Data
Patient age, height, weight, and sex were collected for each participant at study enrollment. PD-weighted MRIs were also collected at baseline, before treatment.
One of the 2 experienced musculoskeletal radiologists (D.N.M., K.H.E.) measured the Caton-Deschamps Index (CDI) using the standard radiograph protocol (when radiographs were available) and the patellar tilt, the sulcus angle of the cartilage surface, and the TT-TG distance using standard MRI protocols for patients with patellar instability. Measurement agreement between these radiologists was previously reported as acceptable. 10 Measurements for the control cohort were conducted by a third experienced musculoskeletal radiologist (R.D.B.).
At baseline and approximately 1 year after enrollment, patients with patellar instability completed surveys—including the Kujala Anterior Knee Pain Scale (Kujala) 21 and the Banff Patellofemoral Instability Instrument 2.0 (BPII 2.0). 15 Follow-up surveys were completed during follow-up visits. If a patient did not attend their follow-up visit, they received the surveys by email. Survey data collected between 365 days before and 60 days after intervention or confirmed dislocation by MRI (mean: 13 days before; median: 0 days before; mode: 0 days before) were used as baseline data. Patients who completed baseline survey forms after intervention (n = 48, 18%) were asked to recall their pre-enrollment state. Data collected 300 to 548 (mean: 387; median: 368) days after intervention were used as the 1-year follow-up data.
3D Anatomy Quantification
We developed a 3D statistical knee model 7 to quantify relative bone positions and bone shapes of the knee using MRIs from patients with patellar instability and controls from Institution A. We quantified 3D anatomy in 3 steps, described in detail in the Appendix. Briefly, in Step 1, we extracted distal femur, proximal tibia, and patellar bone surfaces by segmenting voxels from sagittal 3D PD-weighted MRIs using a previously validated machine learning method. 32 In Step 2, we aligned the bones and determined features that reflected the relative bone positions (Figure 2A), which quantify the rotations and translations of the tibia and patella relative to the femur. In Step 3, we established anatomical correspondence of the points on the bone surfaces using previously established algorithms11,23,30 and computed features that reflected bone shape (Figure 2B) using principal component analysis. Each bone shape feature represents variation in bone curvature, disregarding the relative bone positions.

Examples of 3D statistical knee model features. The model quantifies 3D knee features reflecting relative bone positions and bone shape. (A) An example relative bone position feature corresponds to lateral patellar displacement. The statistical knee model includes 12 total relative bone position features, representing the 3 translations and 3 rotations of each of the patella and tibia relative to the femur. (B) An example bone shape feature reflects concurrent changes in the trochlea and lateral patellar facet concavities. The statistical knee model includes 34 total bone shape features. Note that these shape features are not necessarily associated with patellar instability severity. All statistical knee model features can be visualized at github.com/hmc-humble/patellar-instability-skm. L, lateral, M, medial; 3D, 3-dimensional.
Our automatic segmentation model and statistical knee model are available for free (at github.com/hmc-humble/patellar-instability-skm).
3D Patellar instability Anatomical Severity Score
We developed 3D-PASS to best separate the means of the recurrent instability and age-matched control cohorts from Institution A. To achieve this, we first developed a set of scores based on preliminary feature sets and then computed the final 3D-PASS metric using a subset of features.
The preliminary feature sets, which spanned a range of anatomical descriptiveness, were as follows:
2D imaging measures: The CDI, patellar tilt, sulcus angle, and TT-TG distance
3D relative bone positions: Rotations and translations between the bones
3D bone shape: Curvature of the bones
3D relative bone positions & bone shape: Feature Sets 2 and 3 combined
Feature Set 1, based on 2D imaging measures, served as a reference based on the standard of care. Feature Set 4, which comprised 3D relative bone positions and bone shape, was most descriptive of 3D anatomy. Feature Sets 2 (3D relative bone positions) and 3 (3D bone shape) were analyzed to identify which 3D bone feature set (relative positions or shape) was most descriptive of patellar instability and informative in treatment.
We generated scores as distances between the mean features of the control and recurrent instability cohorts. We normalized the scores such that zero was the control mean, scores were measured in units of 1 SD of the control cohort's scores, and a more positive score was associated with recurrent instability. This method was based on that applied by Bowes et al, 4 with further detail provided in the Appendix. After developing the 4 preliminary scores from the data of the age-matched control and recurrent instability participants at Institution A, we scored the knees of all participants. First, we semiautomatically segmented the distal femur, proximal tibia, and patella from 2D (n = 233) or 3D (n = 37) PD-weighted MRIs. We then automatically applied the statistical knee model to quantify anatomies and automatically assigned scores based on feature distances from the control cohort (further detail is provided in the Appendix).
Statistical Analysis
To compare the control and patellar instability participant characteristics in Institution A, where the control participants were age-matched to the patellar instability group, we applied t tests and chi-square tests.
To compare the mean anatomical scores of the first-time instability cohort with those of the control and recurrent instability cohorts, we conducted 1-sided t tests. Because the first-time instability cohort was not used to develop the scores, this approach allowed us to validate that the scores reflected increasing severity of patellar instability by confirming that the mean scores of the first-time instability cohort were greater than those of the control cohort and less than those of the recurrent instability cohort. These analyses also enabled us to compare performances across the 4 preliminary scores.
To further test the utility of the preliminary scores, we computed Pearson correlations between each score and PROs (Kujala and BPII 2.0) at baseline and 1 year after treatment. Posttreatment analyses for the nonoperative and operative cohorts were conducted separately.
After evaluating the preliminary scores, we identified the “best preliminary score” as the one that showed the greatest difference in means between the first-time and recurrent instability cohorts and had the greatest correlation with PROs. We then conducted a subanalysis using the features included in the best preliminary score, identifying the subset with the highest mean correlation to PROs.
For each analysis, missing data were omitted. Statistical tests were evaluated with a significance level set at .05. Correlation coefficients were classified such that magnitudes <0.30 were poor, 0.30 to 0.59 were fair, 0.60 to 0.79 were strong, and >0.80 were very strong. 6
Results
Participants
Participant characteristics are shown in Table 1. Among the 21 patients who underwent nonoperative treatment and reported 1-year outcomes, 20 enrolled with a single episode of instability, and 1 enrolled with multiple events of instability, yet preferred to undergo nonoperative treatment. Among the 88 patients who underwent operative treatment and reported 1-year outcomes, 56 enrolled with multiple events of instability, 2 of whom had undergone previous surgery for patellar instability; and 32 enrolled with a single episode of instability, 2 of whom had undergone previous surgery for medial patellofemoral ligament (MPFL) repair or osteochondritis dissecans. Among the 32 patients who underwent operative treatment of first-time instability, 12 exhibited osteochondral fracture at baseline, and the remainder underwent operative treatment based on preference or risk factors for recurrent instability—including contralateral instability, skeletal immaturity, patella alta, and trochlear dysplasia. Operative treatment consisted of soft tissue and bony surgeries.
Demographic, Imaging, and Outcome Data of the Control and Patellar Instability Groups a

Data are presented as mean (SD) or n [unreported]. Controls were age-matched to the group with patellar instability at Institution A. Characteristics between the control and patellar instability groups from Institution A were compared using t tests and chi-square tests. BMI, body mass index; BPII 2.0, Banff Patellar Instability Instrument 2.0; CDI, Caton-Deschamps Index; Kujala, Kujala Anterior Knee Pain Scale; TT-TG, tibial tubercle-trochlear groove. Dashes indicate non-applicable characteristics and comparisons involving the controls.
P < .05.
P < .001.
All participants in the control cohort had measurements of the CDI, patellar tilt, sulcus angle, and TT-TG distance. Several measurements were not available for patients with patellar instability: The CDI was not available for 21 participants, the patellar tilt was not available for 8 participants, the sulcus angle was not available for 13 participants, and the TT-TG distance was not available for 8 participants. Among the 244 participants with patellar instability, 172 reported baseline Kujala; 187 reported baseline BPII 2.0; 107 reported 1-year Kujala; and 104 reported 1-year BPII 2.0.
3D Patellar instability Anatomical Severity Score
3D-PASS is based on a subset of the 3D features that reflect relative bone positions (translations and rotations of the patella and tibia relative to the femur). The mean 3D-PASS differed significantly (P < .002) across the control (mean 3D-PASS: 0.0), first-time instability (mean 3D-PASS: 1.5), and recurrent instability (mean 3D-PASS: 1.8) cohorts (Figure 3A). 3D-PASS achieved strong correlations with 1-year nonoperative outcomes (Kujala: r = −0.70, P < .001; BPII 2.0: r = −0.68, P = .001; Figure 3B) and weak correlations with 1-year operative outcomes (Kujala: r = −0.23, P = .032; BPII 2.0: r = −0.25, P = .021).
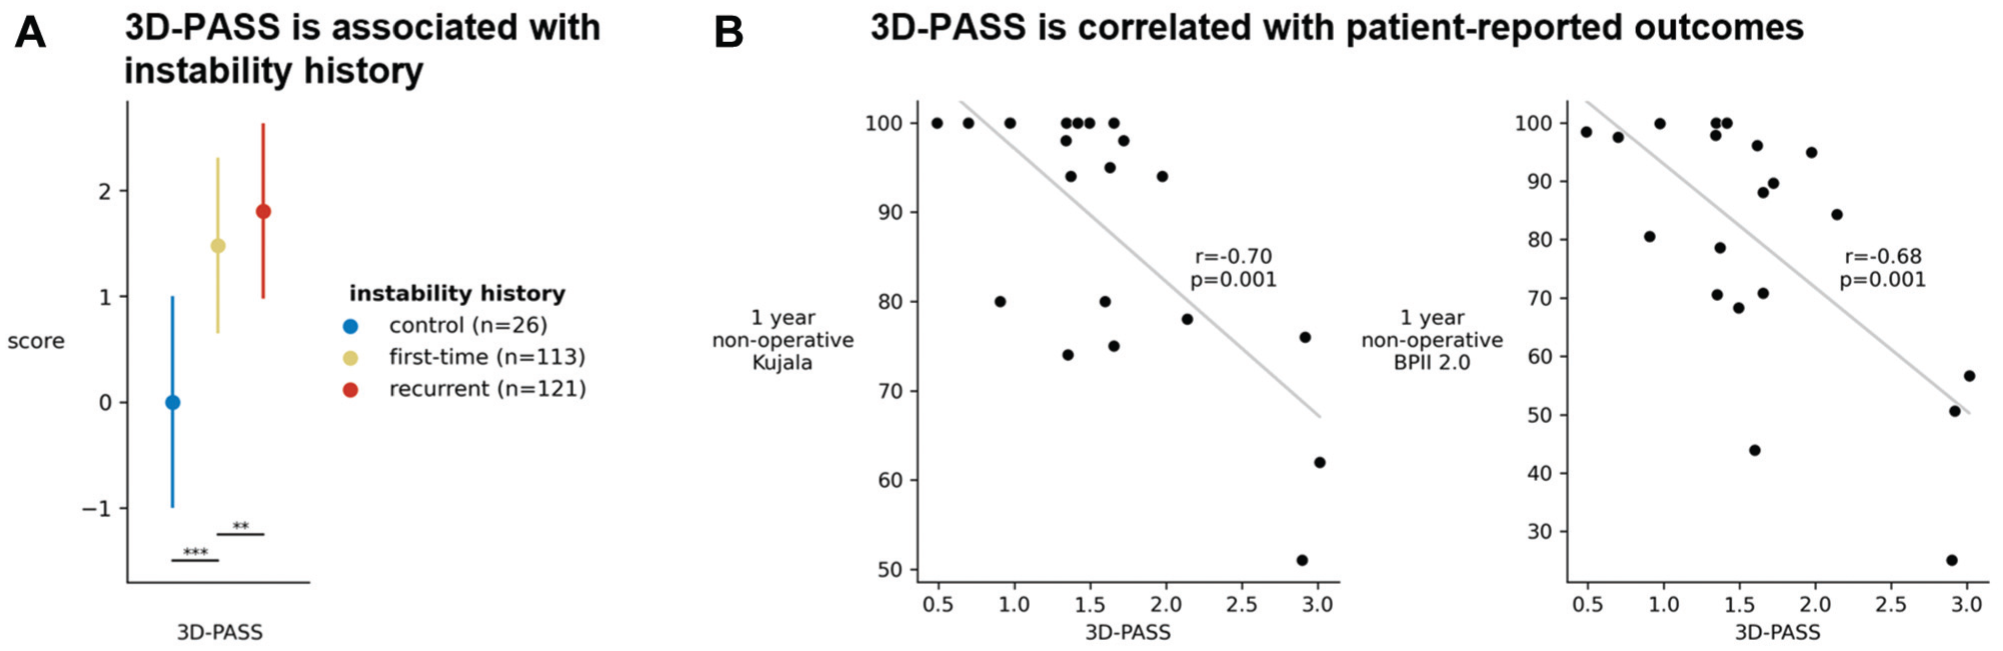
3D-PASS results. (A) 3D-PASS is associated with instability history. The means and standard deviations are shown for the control (blue), first-time instability (yellow), and recurrent instability (red) cohorts. Cohorts were defined based on instability history at the time of enrollment. 3D-PASS was developed using the means of the control and recurrent instability cohorts. Significant values correspond to the results of 1-sided t tests between scores of the first-time instability cohort, which was not used in score development, and those of the control and recurrent instability cohorts. (B) 3D-PASS is strongly correlated with PROs 1 year after nonoperative treatment. Gray lines represent lines of best fit. **P < .01; ***P < .001. BPII 2.0, Banff Patellar Instability Instrument 2.0; Kujala, Kujala Anterior Knee Pain Scale; PRO, patient-reported outcome; 3D-PASS, 3D Patellar instability Anatomical Severity Score.
3D-PASS was developed from a subset analysis of the 3D relative bone positions score, which was the best preliminary score. Among the 4 preliminary scores, the 3D relative bone positions score demonstrated the strongest effect size in distinguishing between the first-time and recurrent instability cohorts (Figure 4; t = −4.00; P < .001; Appendix Table A1) and the strongest correlation with 1-year PROs (Table 2).

Score means and standard deviations across the cohorts. Control (blue), first-time instability (yellow), and recurrent instability (red) cohorts were defined based on instability history at the time of enrollment. To identify anatomical factors related to instability severity, preliminary scores were generated from 4 different sets of inputs, indicated on the x-axis, and were compared based on associations with instability history. Scores were fit using the means of the control and recurrent instability cohorts. Significant values correspond to the results of 1-sided t tests between scores of the first-time instability cohort, which was not used in score development, and those of the control and recurrent instability cohorts. 3D-PASS values, also presented in Figure 3, are included for comparison. Scores based on 3D relative bone positions, including 3D-PASS, best separated the first-time from the recurrent instability cohorts. *P < .05, **P < .01, ***P < .001. 3D-PASS, 3D Patellar instability Anatomical Severity Score.
Pearson Correlations Between Baseline Scores and 1-Year PROs Among Patients Who Reported Outcomes a

Statistically significant correlations are bolded. BPII, Banff Patellar Instability Instrument; Kujala, Kujala Anterior Knee Pain Scale; PRO, patient-reported outcome; 3D-PASS, 3-dimensional Patellar instability Anatomical Severity Score; 2D, 2-dimensional.
P < .05.
P < .01.
P < .001.
Score means and standard deviations of the 4 preliminary scores and 3D-PASS scores are shown in Figure 4. Validation tests on the first-time instability cohort, which was not included in score development, revealed that its mean scores were significantly greater than those of the control cohort and significantly less than those of the recurrent instability cohort, consistent with expected patellar instability severity.
Correlations between the scores and 1-year PROs are reported in Table 2. No statistically significant correlations were identified with baseline PROs. Among the 4 preliminary scores, only the scores based on 3D relative bone positions were significantly correlated with 1-year PROs.
Inspection of the mean control and recurrent instability scores based on 3D relative bone positions revealed that a higher score was associated with greater patellar tilt, height, and lateral displacement; greater external rotation of the tibia relative to the femur; more knee valgus; and more posterior offset of the tibia relative to the femur (Figure 5).

Bones representing the mean scores based on relative bone positions. The ACL injury control mean (3D relative bone positions score = 0.0) is shown in blue, and the recurrent instability mean (3D relative bone positions score = 3.5) is shown in red. A higher score, associated with the recurrent instability cohort, reflects a combination of greater patellar tilt, height, and lateral displacement; greater external rotation of the tibia relative to the femur; more knee valgus; and more posterior offset of the tibia relative to the femur. ACL, anterior cruciate ligament; L, lateral, M, medial; 3D, 3-dimensional.
The score based on 3D bone shape, which reflects variations in bony curvature, is associated with subtle variations reflecting greater trochlear dysplasia; more lateral anterior aspects of the femoral condyles; a more medial trochlear groove; less patellar width, particularly on the medial facet; and greater lateral patellar facet concavity than the ACL control cohort (Figure 6). The differences in trochlear dysplasia and lateral patellar facet concavity together demonstrate less shape congruence between the articulating aspects of the patellar and femoral bones in the recurrent instability cohort. The general overlap between the mean control and recurrent instability shapes indicates that mean bone shapes between the cohorts were very similar; knees corresponding to the minimum and maximum bone shape scores demonstrate a wider range of variation and can be viewed in Appendix Figure A2.

Bones representing the mean scores based on 3D bone shape. The ACL injury control mean (3D bone shape score = 0.0) is shown in blue, and the recurrent instability mean (3D bone shape score = 2.6) is shown in red. The bones are difficult to distinguish from each other; the general overlap in bones indicates that the mean bone shapes between the cohorts were very similar. Close inspection of the axial view reflects that a higher score, associated with the recurrent instability cohort, reflects a combination of greater trochlear dysplasia, more lateral anterior aspects of the femoral condyles, a more medial trochlear groove, less patellar width, and greater lateral patellar facet concavity. The trochlear dysplasia and lateral patellar facet concavity observed in the mean recurrent instability bone shape result in less bone shape congruence between the articulating aspects of the patella and the femur. ACL, anterior cruciate ligament; L, lateral, M, medial; 3D, 3-dimensional.
The score based on relative bone positions and bone shape is the combination of the relative bone positions-only score (Figure 5) and the bone shape-only score (Figure 6). The score based on 2D imaging measures was very strongly correlated with the TT-TG distance (r = 0.82; P < .001), strongly correlated with patellar tilt (r = 0.74; P < .001), fairly correlated with the CDI (r = 0.59; P < .001), and poorly correlated with the sulcus angle (r = 0.27; P < .001).
Scores did not significantly differ between Institutions A and B, except for the 3D bone shape score. The mean bone shape score of patients seen at Institution B was lower (more similar to controls) in both the first-time (P = .031) and recurrent (P = .002) instability cohorts. While the mean scores were different, the bone shape scores of patients seen at Institution B, who were significantly older, did fall within the range of bone shape scores of individuals seen at Institution A.
Discussion
We developed 3D-PASS using MRIs from 2 sites of the JUPITER study group with the largest cohorts. 3D-PASS, which relies on relative bone positions in the knee but not bone shape, is associated with instability history. Across all patients with patellar instability (first-time and recurrent), a higher 3D-PASS is associated with poorer patient-reported nonoperative and operative outcomes 1 year after treatment. The findings of this study support our hypothesis that 3D-PASS is more strongly associated with patellar instability severity and PROs than a score based on traditional 2D imaging measures. 3D-PASS can be computed from any 3D knee scan that captures the bony anatomy. It has the potential to identify patients unlikely to respond well to treatment and may help guide surgeons to earlier intervention decisions.
Among the different feature sets evaluated, 3D relative bone positions demonstrated the strongest ability to distinguish between first-time and recurrent instability cohorts and correlated significantly with 1-year treatment outcomes. In contrast, 2D imaging measures and 3D bone shape, while effective in separating the control and instability cohorts, did not correlate with PROs. These findings suggest that relative bone positions provide more information about patellar instability recurrence and treatment outcomes than bone shape or traditional imaging measures.
The results showed that the 3D relative bone positions associated with instability severity and treatment outcomes include features previously associated with patellar instability, including patellar tilt and height 8 , lateral patellar displacement, 31 and external rotation of the tibia relative to the femur.8,27 Knee valgus was greatest in patients with multiple episodes of instability. In addition, ACL control knees exhibited more anterior tibial positions relative to the femur compared with patellar instability knees. This likely reflects ACL pathology 35 , rather than patellar instability, because the ACL restrains anterior tibial displacement.
In this study, we used a convenience sample of ACL-injured knees as the controls. ACL-injured knees exhibit tibias that are positioned more anteriorly and rotated more internally relative to the femur.24,35,36 Consequently, the choice to use these knees as controls in this study influences the interpretation of 3D-PASS, a position-based score (a score of zero corresponds to an average ACL-injured knee, and not to an average healthy knee). Because the MRIs in this study were acquired after injury, it is also the case that the relative bone positions in 3D-PASS may reflect immediate effects of dislocation, including effusion and MPFL injury. More investigation is needed to explore the relationship between preinjury anatomy and injury and treatment outcomes. In addition, it is expected that some of the patients who enrolled in the study with first-time instability will undergo recurrent episodes. Despite these limitations, 3D-PASS is associated with instability history and PROs within the patellar instability cohort.
While 3D bone shape was associated with instability history, differences between the control and recurrent instability groups were subtle. However, the features associated with instability severity align with previous findings and include trochlear dysplasia, 8 a more medial trochlear groove, 28 more lateral anterior aspects of the femoral condyles, 25 and decreased patellar width.29,37 Despite this, PROs were not associated with 3D bone shapes. Previous scores that used measures of trochlear dysplasia were associated with recurrence.2,14,17 Future analyses should extend our multibone statistical knee model to include cartilage and further investigate the relationship between trochlear dysplasia and PROs.
PROs at baseline were not explained by 3D-PASS, and PROs 1 year after operative treatment were only weakly correlated with 3D-PASS. Baseline and operative outcomes are influenced by many factors beyond the baseline 3D anatomy analyzed in this study. At baseline, shortly after an instability episode, acute pain and function can be determined by a variety of factors—including effusion and osteochondral fractures. Information about these features can also be obtained from MRIs and may support future estimates of baseline PROs. PROs 1 year after operative treatment are influenced by patient-specific 3D changes that result from surgery. These are not accounted for in our score. In this study, decisions to treat nonoperatively or operatively varied, even within patient groups with first-time and recurrent instability. For patients treated operatively, surgeries also varied, with some patients undergoing only MPFL reconstruction surgery and others also undergoing procedures such as tibial tubercle osteotomies and lateral retinacular releases. Future studies should investigate the relative bone position and bone shape changes that result from specific surgical treatments and whether outcomes are more strongly associated with these changes. They should also study whether 3D-PASS or a similar metric can predict whether a patient indicated for surgery should undergo more than just MPFL reconstruction.
While 3D-PASS demonstrates strong correlations within this study cohort, the generalizability of 3D-PASS is limited by data inclusion criteria and sample size. The study cohort was drawn from 2 sites of the JUPITER study group, with future model developments planned to incorporate data from all 12 sites. While both sites were used to validate 3D-PASS, only 1 site, primarily involving pediatric patients, was used for model development. Further research is needed to validate 3D-PASS across age groups and institutional contexts.
3D-PASS was developed using 3D MRIs, which allowed the creation of a high-resolution statistical knee model. It was then validated on a combination of 3D MRIs and more clinically common 2D MRIs, with slice thicknesses up to 4 mm. Thus, the results of this study indicate how 3D-PASS performs when applied to clinically acquired 2D MRIs. Patients included in this study were limited to those with PD-weighted MRIs, for which we had established an accurate bone segmentation method. However, because 3D-PASS is compatible with any set of segmented knee bones, future studies can extend its application to include MRIs acquired with different sequences and resolutions. This flexibility will allow for the incorporation of other segmentation methods, increasing the dataset size and improving model reliability across diverse patient populations and institutions.
A larger sample size is critical for addressing more complex questions related to patellar instability treatment outcomes. For example, this study was limited to outcomes measured 1 year after enrollment and did not differentiate between first-time and recurrent instability cases. With a larger cohort, future studies could investigate longer-term outcomes, stratify patients by instability history and treatment history and selection, and evaluate whether patients with first-time instability and high 3D-PASS scores—who are traditionally treated nonoperatively—might benefit from earlier surgical intervention.
3D-PASS takes advantage of 3D information in MRI scans and provides a score that differs between first-time and recurrent instability groups. 3D-PASS is associated with PROs, which historically have not been predictable, and demonstrates the potential of an automated score that can inform treatment decisions. While the technical development of this score was complex, its potential application is much simpler, requiring only clinical MRI scans from which a computer can automatically compute 3D-PASS. This score requires further validation, including prospective validation, before widespread clinical use, but it makes important steps toward the long-term goal of creating a planning tool to predict recurrence risk and PROs after first-time instability episodes and identify the appropriate patient-specific interventions.
Authors
Marissa L. Sinopoli, PhD (Department of Mechanical Engineering, Stanford University, Stanford, CA, USA; Department of Engineering, Harvey Mudd College, Claremont, CA, USA); Anthony A. Gatti, PhD (Department of Radiology, Stanford University, Stanford, California, USA); Christian E. Wright, BS (Department of Biology, Stanford University, Stanford, California, USA; School of Medicine, Washington University, Saint Louis, Missouri, USA); Anna Bartsch, MD (Department of Orthopaedic Surgery, Stanford University Medical Center, Stanford, California, USA; Department of Orthopedics and Traumatology, University Hospital Basel, Basel, Switzerland); Matthew W. Veerkamp, BA (Division of Pediatric Orthopaedics, Cincinnati Children’s Hospital Medical Center, Cincinnati, Ohio, USA); Robert D. Boutin, MD (Department of Radiology, Stanford University, Stanford, California, USA); Douglas N. Mintz, MD (Department of Radiology & Imaging, Hospital for Special Surgery, New York, USA); Kathleen H. Emery, MD (Department of Radiology and Medical Imaging, Cincinnati Children's Hospital Medical Center, Cincinnati, Ohio, USA); Kevin G. Shea, MD (Department of Orthopaedic Surgery, Stanford University Medical Center, Stanford, California, USA); Akshay S. Chaudhari, PhD (Department of Radiology, Stanford University, Stanford, California, USA); Eric J. Wall, MD (Division of Orthopaedic Surgery, Cincinnati Children’s Hospital Medical Center, Cincinnati, Ohio, USA); Stacey Elangovan, MD (Department of Radiology and Medical Imaging, Cincinnati Children’s Hospital Medical Center, Cincinnati, Ohio, USA); Daniel W. Green, MD, MS, FAAP, FACS (Department of Pediatric Orthopedics, Hospital for Special Surgery, New York, USA); Peter D. Fabricant, MD, MPH (Department of Pediatric Orthopedics, Hospital for Special Surgery, New York, USA); Sabrina M. Strickland, MD (Department of Orthopedic Surgery, Hospital for Special Surgery, New York, USA); Beth E. Shubin Stein, MD (Department of Sports Medicine, Hospital for Special Surgery, New York, USA); Shital N. Parikh, MD (Division of Pediatric Orthopaedics, Cincinnati Children’s Hospital Medical Center, Cincinnati, Ohio, USA); Scott L. Delp, PhD (Department of Mechanical Engineering, Stanford University, Stanford, California, USA; Department of Orthopaedic Surgery, Stanford University Medical Center, Stanford, California, USA; Department of Bioengineering, Stanford University, Stanford, California, USA); and Seth L. Sherman, MD (Department of Orthopaedic Surgery, Stanford University Medical Center, Stanford, California, USA). Collaborating members of the JUPITER Study Group are: Shital N. Parikh, MD (Division of Pediatric Orthopaedics, Cincinnati Children’s Hospital Medical Center, Cincinnati, Ohio, USA); Eric J. Wall, MD (Division of Orthopaedic Surgery, Cincinnati Children’s Hospital Medical Center, Cincinnati, Ohio, USA); Matthew W. Veerkamp, BA (Division of Pediatric Orthopaedics, Cincinnati Children’s Hospital Medical Center, Cincinnati, Ohio, USA); Stacey Elangovan, MD (Department of Radiology and Medical Imaging, Cincinnati Children’s Hospital Medical Center, Cincinnati, Ohio, USA); Beth E. Shubin Stein, MD (Department of Sports Medicine, Hospital for Special Surgery, New York, USA); Daniel W. Green, MD, MS, FAAP, FACS (Department of Pediatric Orthopedics, Hospital for Special Surgery, New York, USA); Peter D. Fabricant, MD, MPH (Department of Pediatric Orthopedics, Hospital for Special Surgery, New York, USA); Sabrina M. Strickland, MD (Department of Orthopedic Surgery, Hospital for Special Surgery, New York, USA); and Seth L. Sherman, MD (Department of Orthopaedic Surgery, Stanford University Medical Center, Stanford, California, USA).
Supplemental Material
sj-docx-1-ojs-10.1177_23259671251362675 – Supplemental material for 3D Patellar instability Anatomical Severity Score (3D-PASS): A Novel Machine Learning Score Using 3D Bone Position From MRI to Predict Outcomes of Patellar Instability Treatment (Using a Subset of Data in the JUPITER Cohort)
Supplemental material, sj-docx-1-ojs-10.1177_23259671251362675 for 3D Patellar instability Anatomical Severity Score (3D-PASS): A Novel Machine Learning Score Using 3D Bone Position From MRI to Predict Outcomes of Patellar Instability Treatment (Using a Subset of Data in the JUPITER Cohort) by Marissa L. Sinopoli, Anthony A. Gatti, Christian E. Wright, Anna Bartsch, Matthew W. Veerkamp, Kevin G. Shea, Akshay S. Chaudhari, Beth E. Shubin Stein, Shital N. Parikh, Scott L. Delp and Seth L. Sherman in Orthopaedic Journal of Sports Medicine
Footnotes
Acknowledgements
The authors thank Bennett Propp and Simone Gruber for helping to facilitate data sharing from the Hospital for Special Surgery.
Final revision submitted April 8, 2025; accepted May 9, 2025.
One or more of the authors has declared the following potential conflict of interest or source of funding: This work was funded by the American Orthopaedic Society for Sports Medicine, the Arthroscopy Association of North America, the Canadian Institutes of Health Research Postdoctoral Fellowship, CONMED, the National Institutes of Health (P41EB027060, R01 AR077604, R01 EB002524, and R01 AR079431), the Pediatric Orthopaedic Society of North America, Stanford Data Science, Stanford University, the University of Cincinnati, and the Wu Tsai Human Performance Alliance. A.A.G. has equity ownership of NeuralSeg Ltd, NodeAI Diagnostics, and GeminiOV LLC. K.G.S. serves on the editorial board of nView Inc, Sarcio Inc, and Medeloop Inc; has received stock options from nView Inc, Sarcio Inc, and Medeloop Inc; has received support for education from Arthrex, BioMarin, Evolution Surgical, Stryker, and Vericel Research; and has received research support from Arthrex, BioMarin, Evolution Surgical, Stryker, and Vericel Research. A.S.C. provides consulting services to Chondrometrics GmbH, Patient Square Capital, and Elucid Bioimaging Inc; and has equity ownership in Brian Key, Subtle Medical, and LVIS Corp. B.E.S.S. receives support for research from CONMED; receives royalties from Arthrex; is a paid consultant for Arthrex and CONMED; serves on the editorial board of Orthopedics Today; and serves on the publishing board of The American Journal of Sports Medicine. S.N.P. receives support for research from CONMED. S.L.S. holds committee positions for the Arthroscopy Association of North America, the American Academy of Orthopaedic Surgeons, the ACL Study Group, the American Orthopaedic Society for Sports Medicine, the Biologic Association, the International Cartilage Regeneration & Joint Preservation Society, and the International Society of Arthroscopy, Knee Surgery and Orthopaedic Sports Medicine; is on the editorial board of Arthroscopy, Current Reviews in Musculoskeletal Medicine, and Video Journal of Sports Medicine; is a course chair of the
Ethical approval for this study was obtained from Cincinnati Children’s Hospital Medical Center, Hospital for Special Surgery, and Stanford University.
References
Supplementary Material
Please find the following supplemental material available below.
For Open Access articles published under a Creative Commons License, all supplemental material carries the same license as the article it is associated with.
For non-Open Access articles published, all supplemental material carries a non-exclusive license, and permission requests for re-use of supplemental material or any part of supplemental material shall be sent directly to the copyright owner as specified in the copyright notice associated with the article.