
Abstract
Background:
Autologous osteochondral transfer (AOT) is preferred because of its ability to replace defective cartilage with hyaline cartilage. However, longitudinal changes in hyaline cartilage after AOT and their correlation with clinical outcomes remain unclear.
Purpose/Hypothesis:
The purpose of the study was to evaluate the short- to midterm outcomes of AOT and to investigate the correlation between clinical outcomes and the morphologic and qualitative findings of cartilage. It was hypothesized that cartilage would remain stable over the follow-up period and that clinical outcomes would correlate with cartilage status.
Study Design:
Case series; Level of evidence, 4.
Methods:
Patients who underwent AOT between 2002 and 2021 and were followed for a minimum of 2 years were retrospectively reviewed. Clinical outcomes were assessed at postoperative early term (1-2 years postoperatively) and at the short- to midterm period (2-6 years postoperatively) using the Lysholm score, International Knee Documentation Committee (IKDC) score, Tegner activity scale, and visual analog scale (VAS) for pain. Morphology of cartilage was evaluated using MOCART (magnetic resonance observation of cartilage repair tissue) 2.0 scores, and quality was assessed using quantitative magnetic resonance imaging (MRI) T2 mapping. In those who were assessed with serial MRIs at early term and short-to-midterm intervals, correlation analysis was performed to assess the relationship between MRI and clinical outcomes.
Results:
A total of 45 patients with a mean age of 36.6±14.0 years (range, 16–63 years) were included. The mean follow-up period was 4.3±1.2 years. The mean MOCART score was 84.0±11.5 at early term and 78.1±21.0 at midterm, with no significant changes between follow-up intervals. T2 value also remained unchanged between postoperative follow-ups. Significant improvements in the Lysholm, IKDC, and VAS scores observed at the early term improved further through the midterm period. The MOCART score at the postoperative early term was correlated with VAS improvement (P = .003); however, no significant correlation was found between other clinical and MRI outcomes.
Conclusion:
Postoperative improvements in clinical and MRI outcomes after AOT at the early term follow-up were maintained through a mean follow-up of 4 years. The further improvement in clinical outcomes, despite stable MRI findings, suggests a limited correlation between structural and clinical outcomes.
Keywords
Localized articular cartilage defects can cause persistent pain, restricted daily activities, and progressive chondral wear.21,26,27,30 Among the various cartilage repair techniques for treating localized chondral defects at an early stage, autologous osteochondral transfer (AOT) has demonstrated acceptable long-term results.37,41 The unique benefit of AOT compared with other techniques is its use of autologous hyaline cartilage, as opposed to allograft or fibrocartilage. Because hyaline cartilage offers biological advantages in terms of lubrication, durability, and longevity,4,5 restoring hyaline cartilage is a primary goal of articular cartilage repair surgeries. In addition, AOT is preferable to autologous chondrocyte implantation (ACI) because it replaces defective lesions with whole-layer, healthy hyaline cartilage tissue in a single-stage procedure.
Nevertheless, the correlation between hyaline cartilage restoration and clinical outcomes remains unclear.1,11 Although studies have reported good patient-reported outcomes (PROs) and graft longevity at midterm follow-up following autologous minced cartilage repair 32 and ACI, 7 a lack of correlation between postoperative clinical and radiological outcomes has been observed. Additionally, the limited literature on the longitudinal changes in transferred cartilage after AOT and their relationship with clinical outcomes makes it difficult to fully evaluate this correlation.
Among cartilage assessment tools, quantitative T2 mapping is increasingly utilized for the biochemical analysis of cartilage as a valid, noninvasive, and objective biomarker.6,16,20 This technique is valuable because it enables both morphologic and qualitative evaluation of cartilage tissue. It is well-established that cartilage T2 relaxation time (T2 value) reflects the biocomposition of collagen and water content as well as disruptions in collagen structure.19,36 Therefore, increased intracartilaginous water content is correlated with higher T2 values, making it a clinically practical index of early degeneration in articular cartilage.15,17,22 Although recent studies have assessed cartilage status in patients with osteochondral lesions,23,43 longitudinal studies focusing on cartilage changes after AOT are lacking.
Therefore, this study aimed (1) to evaluate the short-term to mid-term outcomes of AOT and (2) to investigate the correlation between longitudinal changes in clinical outcomes and the morphology and quality of cartilage using quantitative magnetic resonance imaging (MRI) T2 mapping. We hypothesized that cartilage would remain stable over the follow-up period and that interval changes in clinical outcomes would correlate with morphologic outcomes or T2 values.
Methods
This retrospective study was approved by the institutional review board of the medical center conducting the current study. The patient data were collected and assessed anonymously by the first author (H.Y.L.).
Patients
Patients who underwent AOT between March 2002 and March 2021 were retrospectively reviewed. AOT was considered for patients with symptomatic focal cartilage defects whose characteristics corresponded with the International Cartilage Regeneration & Joint Preservation Society grade 3 or 4 lesions, measuring ≥1.0 cm2. For patients with accompanying structural problems, the following concomitant procedures were considered: realignment osteotomy for patients with a mechanical axis deviation >5°, meniscal allograft transplantation for patients exhibiting subtotal-to-total meniscectomy state of the knee, and anterior cruciate ligament (ACL) reconstruction for knees with ACL deficiency. Conversely, AOT was not considered for patients with morbid obesity (body mass index [BMI] >40), advanced osteoarthritis, a history of inflammatory arthritis, or autoimmune conditions. Patients who were followed up for a midterm period (2-6 years postoperatively) were included in this study.
Surgical Technique and Postoperative Management
Two senior authors (J.-M.K. and S.-I.B.) of this study performed the AOT procedure, and both used the same surgical technique. The size and depth of the cartilage defect were measured via preoperative MRI, and the cartilage status of the nonweightbearing area of the trochlea was assessed as a potential donor site. Once AOT was confirmed to be an appropriate treatment for a patient, an arthroscopic examination was conducted to evaluate the condition of the meniscus, cartilage, and ligaments. The cartilage status at the donor site was assessed and the area of the cartilage defect was intraoperatively measured using an arthroscopic probe. Subsequently, an arthrotomy was performed with a small 4-cm skin incision to visualize the surface of the chondral defect. Using the Osteochondral Autograft Transfer System (Arthrex), a recipient hole was created perpendicular to the surface. The minimum depth of the hole was set to 1.5 times the diameter of the hole to ensure a sufficient press-fit contact area between the healthy cancellous bone and the osteochondral plug. A perpendicular osteochondral plug was harvested from the donor site under direct visualization. Two cylindrical plugs from the recipient and donor sites were compared to adjust their lengths, and the healthy plug was trimmed to be slightly shorter than the damaged plug to prevent protrusion at the recipient site. If the damaged chondral lesion was not adequately covered by the healthy transferred plug, mosaicplasty was performed by harvesting multiple additional osteochondral plugs. To fill the hollow space left at the donor site, the osteochondral plug from the defect region, primarily consisting of subchondral bone, was inserted. After this procedure, the capsule was repaired meticulously, ensuring that the cartilage surface of the recipient site was congruent.
Postoperatively, quadriceps strengthening and range-of-motion exercises were initiated immediately to promote functional recovery. The duration of nonweightbearing after AOT was tailored to the number and configuration of transplanted plugs. For 1 or 2 plugs, patients were advised to avoid weightbearing for 2 weeks, followed by partial weightbearing. Full weightbearing was permitted after 4 weeks postoperatively. In cases involving ≥3 plugs, where there was potential reduction in contact surface with neighboring host bone, a 4-week period of nonweightbearing was recommended. This was followed by 4 weeks of partial weightbearing before allowing full weightbearing after 8 weeks postoperatively. As a precaution, patients were advised to limit their physical activities to light sports such as cycling and swimming. Strenuous exercise and heavy labor were discouraged indefinitely to avoid potential complications related to the healing of the transplanted meniscus. For postoperative monitoring, patients were recommended to undergo MRI after 1 year for short-term follow-up and every 2 to 3 years thereafter for regular follow-up.
Postoperative Cartilage Assessment
Postoperative cartilage status was assessed using MRI (Achieva 3T; Philips Healthcare) with a dedicated 16-channel knee coil. For morphological assessment, a MOCART (magnetic resonance observation of cartilage repair tissue) knee score was used, as it enables the assessment of cartilage repair tissue after different cartilage repair techniques with good intra- and interrater reliability. 34 It comprises 7 variables contributing to a total score of 100 that includes volume of the cartilage defect filling (0-20 points), integration into adjacent cartilage (0-15 points), surface of the repair tissue (0-10 points), structure of the repair tissue (0-10 points), signal intensity of the repair tissue (0-10 points), bony defects or bony overgrowth (0-10 points), and subchondral changes (0-20 points).
For the qualitative assessment of the cartilage, quantitative T2 sequence was obtained in addition to conventional MRI. Quantitative MRI was performed using the following parameters: 6 echo times at 13, 26, 39, 52, 65, and 78 ms; a repetition time of 3500 ms; slice thickness of 3 mm; field of view of 160 × 160 mm; pixel matrix of 304 × 304 mm; and a total acquisition time of 7.93 minutes. The T2 relaxation times (measured in ms) were acquired using multiecho measurements. Color T2 mapping images ranging from 1 to 81 ms were generated using an advanced cartilage assessment application (IntelliSpace Portal; Philips Healthcare). Region of interest (ROI) analysis was conducted on the cartilage of each osteochondral plug. The software automatically computed the mean T2 value of the cartilage for each osteochondral plug. Additionally, the ROIs were automatically divided into deep and superficial layers of equal thickness to evaluate the variation in T2 values across the different depths of the cartilage layer (Figure 1).6,19

Quantitative T2 mapping for cartilage assessment after autologous osteochondral transfer. Left panel: well-healed osteochondral plugs are observed at both the donor and the recipient sites, with region of interest (ROI) segmentation performed for each plug. Right panel: the color T2 map visualizes T2 values ranging from 1 to 81 ms. Red indicates lower T2 values, suggestive of superior cartilage quality, while blue indicates higher T2 values, suggestive of inferior tissue quality.
For the intrareader reproducibility analysis, intraclass correlation coefficients were calculated to assess the reliability of the MRI outcomes. One month after the initial assessment by the first investigator (H.Y.L.), 10 patients were randomly selected and reevaluated by the same investigator and another author (J.-H.S.), both experienced in quantitative MRI analysis.
Clinical Outcome Assessment
Clinical outcomes were assessed at preoperative, early term, and short- to midterm follow-up periods using PRO measures (PROMs), including the Lysholm score, International Knee Documentation Committee (IKDC) Subjective Knee Score, Tegner activity scale, and visual analog scale (VAS) for pain. Moreover, the Lysholm score, IKDC score, and VAS were analyzed based on the minimal clinically important difference (MCID) and Patient Acceptable Symptom State (PASS) values reported in the literature to assess clinical relevance and significance. The reported thresholds in the current literature were as follows: MCID for Lysholm score, 10.1; IKDC score, 16.7; and VAS, 2.7; PASS for Lysholm score, 70.0; IKDC score, 62.1; and VAS, 4.0.3,8,14,29
Correlation Analysis Between MRI Outcomes and Clinical Outcomes
In patients who underwent consecutive postoperative MRIs, subgroup analysis was performed to investigate the correlation between the longitudinal change in MRI outcomes and clinical outcomes.
Statistical Analysis
SPSS statistical software (Version 25.0; IBM) was used for statistical analyses. Statistical significance was set at P < .05. The Wilcoxon signed-rank test was used to verify longitudinal changes in clinical and MRI outcomes. The Spearman rank coefficient correlation test was conducted to assess the correlation between T2 value and MOCART scores and the relationship between clinical outcomes and MRI findings.
Results
Patient Characteristics
A total of 57 patients underwent AOT at the medical center conducting the current study. Of these, 12 patients were excluded due to the absence of follow-up at <2 years. Therefore, 45 patients were finally enrolled in this study. For the subgroup analysis examining the correlation between longitudinal changes in MRI outcomes and clinical outcomes, 27 patients who underwent postoperative MRI at both the early term and the midterm follow-up periods were included (Figure 2). The study included 21 male and 24 female patients, with a mean age of 36.6 ± 14.0 years (range, 16-63 years). The mean follow-up period was 4.3 ± 1.2 years (median 4.5 years; range, 2.1-6.1 years). Patients had a mean BMI of 24.9 ± 4.3 (range, 19.3-35.8). The mean cartilage defect area was 1.7 ± 0.7 cm2 (range, 0.7-3.8 cm2). Detailed demographic and clinical data are provided in Table 1.

Flowchart of patient enrollment. MRI, magnetic resonance imaging.
Patient Characteristics a

Data are presented as mean ± SD unless otherwise indicated. ACL, anterior cruciate ligament; AOT, autologous osteochondral transfer; HKA, hip-knee-ankle; HTO, high tibial osteotomy; MAT, meniscal allograft transplantation.
Qualitative and Morphologic Changes in Cartilage Tissue
For the MOCART score, the intraobserver reliability and interobserver agreement were 0.91 (95% CI, 0.63-0.98; P = .001) and 0.89 (95% CI, 0.57-0.97; P = .001), respectively. For T2 value, intraobserver reliability was 0.96 (95% CI, 0.92-0.98; P < .001), and interobserver agreement was 0.91 (95% CI, 0.78-0.97; P < .001). These results were interpreted as good to excellent agreement.
The mean MOCART score was 84.0 ± 11.5 at the early postoperative period and 78.1 ± 21.0 at the midterm follow-up, with no significant changes over the interval (P = .08). No subchondral bone pathology associated with the osteochondral plug was observed, such as necrosis or progression of bone marrow edema. Similarly, the mean T2 value was 48.2 ± 6.7 at the early postoperative period and 46.3 ± 5.0 at the midterm, showing no significant interval changes (P = .37) (Table 2).
Serial Change of Outcomes After Autologous Osteochondral Transfer Surgery a

Data are presented as mean ± SD. IKDC, International Knee Documentation Committee; MOCART, magnetic resonance observation of cartilage repair tissue; MRI, magnetic resonance imaging; VAS, visual analog scale for pain. The Friedman test and Wilcoxon signed-rank test were performed. The bold interface indicates statistical significance (P < .05).
Clinical Outcomes
The Lysholm score increased significantly from 66.7 ± 17.1 preoperatively to 91.2 ± 7.3 at the early postoperative period (P < .001) and further improved to 93.8 ± 6.7 at the midterm follow-up (P = .04). Overall, 86.1% surpassed the MCID for the Lysholm score and 100% achieved the PASS for the Lysholm score. Likewise, the IKDC score showed a significant improvement from 51.7 ± 15.4 preoperatively to 77.6 ± 8.1 at the early postoperative period (P < .001) and further increased to 81.0 ± 11.6 at the midterm follow-up (P = .003). Overall, 73.5% reached the MCID for the IKDC score and 90.9% surpassed the PASS for the IKDC score. Similarly, the mean VAS score decreased significantly from 5.3 ± 2.1 preoperatively to 1.7 ± 1.7 at the early postoperative period (P < .001) and further reduced to 1.1 ± 1.6 at the midterm follow-up (P = .017). Overall, 73.8% surpassed the MCID for the VAS score and 95.5% achieved the PASS for the VAS score. However, the mean Tegner activity scale scores did not show significant changes throughout the follow-up period (Table 2).
Correlation Between MRI Outcomes and Clinical Outcomes
Correlation analysis showed a moderate association between the MOCART score and improvement in VAS at the early postoperative term (rho = −0.514; P = .003). However, no significant correlation was found between other clinical outcomes and MRI findings (Table 3). Additionally, there was no association between the interval changes in MRI outcomes and clinical outcomes from the early postoperative term to the midterm follow-up (Table 4).
Correlation Between MRI Outcomes and Interval Changes in Clinical Outcomes From Pre- to Postoperative Early Term Follow-up Period a
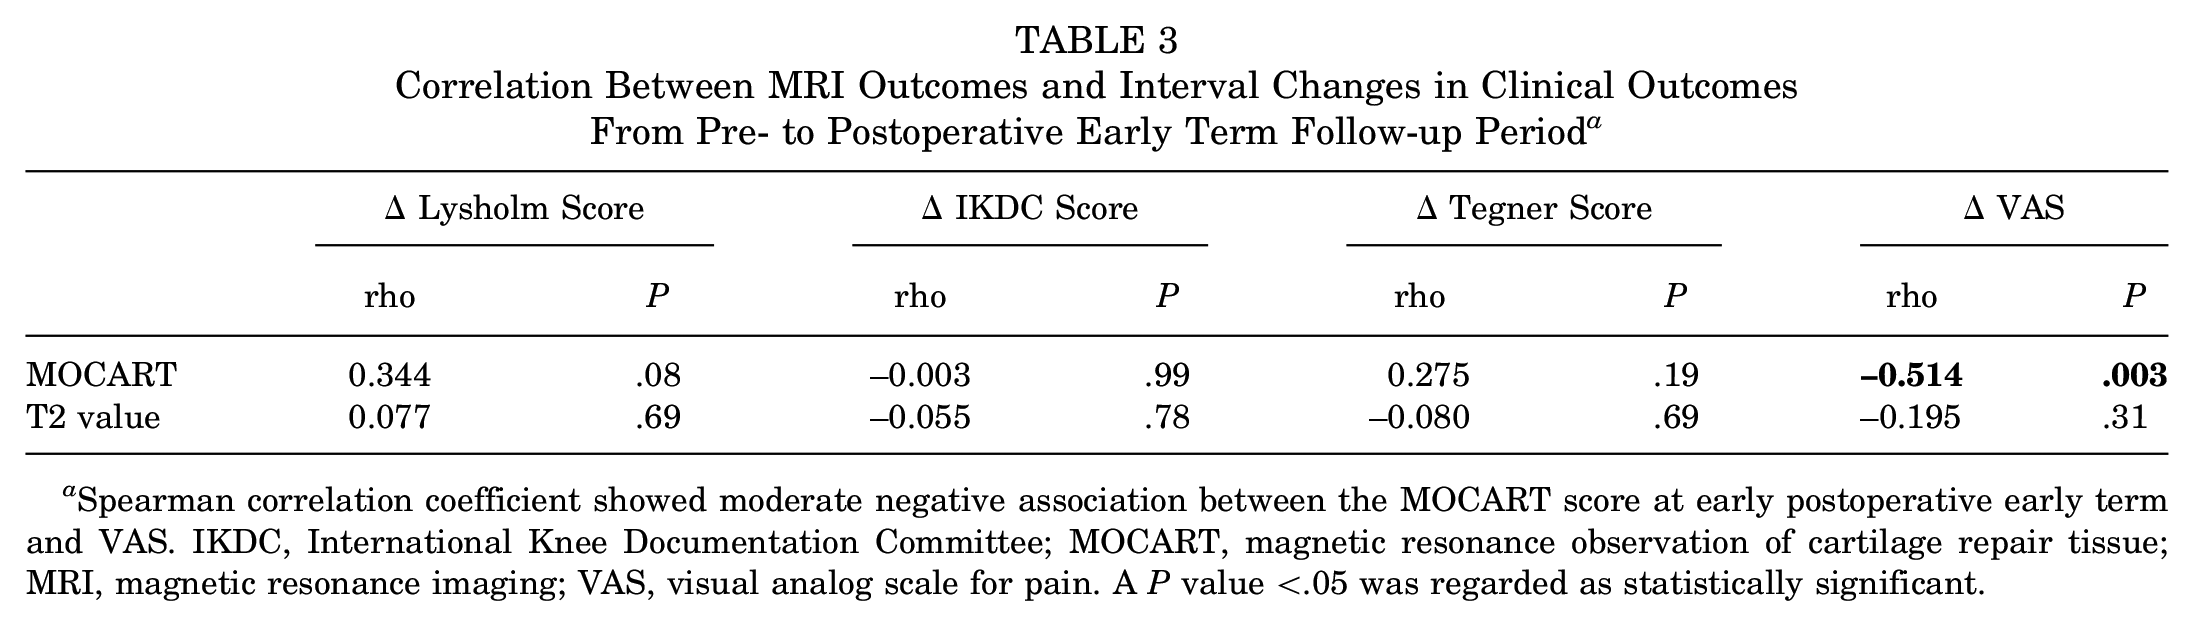
Spearman correlation coefficient showed moderate negative association between the MOCART score at early postoperative early term and VAS. IKDC, International Knee Documentation Committee; MOCART, magnetic resonance observation of cartilage repair tissue; MRI, magnetic resonance imaging; VAS, visual analog scale for pain. A P value <.05 was regarded as statistically significant.
Correlation Between Interval Changes in MRI Outcomes and Clinical Outcomes From Postoperative Early to Midterm Follow-up Period a

Spearman correlation coefficient showed no significant association between the MRI findings and clinical outcomes during the follow-up intervals. IKDC, International Knee Documentation Committee; MOCART, magnetic resonance observation of cartilage repair tissue; MRI, magnetic resonance imaging; VAS, visual analog scale for pain. A P value <.05 was regarded as statistically significant.
Discussion
The most important finding of this study is that favorable structural and clinical outcomes observed after AOT at the early postoperative term were well maintained up to a mean follow-up of 4.3 years. During the follow-up period, the MOCART score and T2 value were maintained, while clinical outcomes showed further improvement, leading to weak or no correlation between structural and clinical outcomes. These results suggest that the transferred hyaline cartilage in AOT is sufficiently durable to support sustained clinical improvement through the short-to-midterm follow-up period.
The most notable advantage of AOT is its ability to replace cartilage defects with hyaline cartilage rather than fibrocartilage regeneration. 3 ACI has been shown to restore a higher fraction of hyaline cartilage than other techniques. 5 However, because AOT replaces whole-layer cartilage in a single stage, it may provide an even greater proportion of hyaline cartilage compared with ACI. Thus, AOT could be a more suitable option for articular cartilage repair, as fibrocartilage shows inferior stiffness, increased susceptibility to degradation, and reduced long-term durability.13,35 Additionally, AOT offers the advantage of replacing the osteochondral defect with healthy subchondral bone, which is an important factor in cartilage repair outcomes. Previous studies have emphasized the underlying subchondral bone condition that affects the outcome of cartilage repair procedures. Gersing et al 10 found that subchondral trabecular bone parameters have significant correlations with T2 value after matrix-associated ACI. Similarly, Mukai et al 25 reported that bone marrow edema observed via MRI was well-correlated with plug union and necrosis after AOT. In this study, we observed no complications associated with the osteochondral plug, such as necrosis or progression of bone marrow edema during the follow-up period, potentially contributing to the favorable clinical outcomes observed at midterm.
Previous studies have suggested that favorable outcomes after AOT may be attributed to the restoration of hyaline cartilage rather than fibrocartilage.12,24,34,37,42 Randomized controlled trials have shown that AOT yields superior long-term outcomes compared with microfracture.37,41 A meta-analysis by Han et al 12 further demonstrated that AOT provides better clinical outcomes and faster return to play than microfracture. Consistent with these findings, the present study reported a high mean MOCART score of 84.0 ± 11.5 at the postoperative early term, comparable with previous outcomes from other cartilage repair procedures.24,34,42 This satisfactory outcome was maintained through a mean follow-up of 4.3 years, with a midterm MOCART score of 78.1 ± 21.0, indicative of good cartilage status. Moreover, excellent clinical outcomes were observed, with a large proportion of patients surpassing the MCID and PASS thresholds. Nonetheless, direct comparisons between different studies should be interpreted cautiously, as various factors, such as age, lesion size, lower limb alignment, BMI, residual meniscal volume, and concomitant procedures, may influence surgical outcomes.9,21,40
However, the role of transplanted hyaline cartilage in clinical outcomes remains unclear. To better understand the nature of hyaline cartilage overlying osteochondral lesions, recent studies have used quantitative MRI to investigate juvenile osteochondritis dissecans,23,43 postoperative outcomes of ACI,16,36 and osteochondral lesion of the talus. 11 In the present study, the mean T2 values of the entire cartilage layer remained stable throughout the follow-up period. Given that T2 values increase with cartilage degeneration,2,15,18 it is reasonable to assume that the quality of the transferred cartilage tissue did not deteriorate. However, caution is required when interpreting these results, as T2 values are influenced by a variety of conditions.28,33,39 More evidence is required, as, to our knowledge, this study is the first to document longitudinal changes in T2 values after AOT.
Another significant finding of this study was the lack of correlation between the changes in MRI outcomes and clinical outcomes. Previous studies have also reported that MRI findings after cartilage repair procedures, such as ACI 10 and AOT, 25 do not necessarily correlate with clinical outcomes. Runer et al 32 also observed this disconnect in their investigation of ACI outcomes at a minimum 5-year follow-up, where clinical improvements were not reflected in MRI findings. In the present study, the only significant correlation found was between the MOCART score and VAS improvement at the postoperative early term. However, no correlation was observed between the MOCART score or T2 values and other PROMs such as Lysholm and IKDC scores. One possible explanation is that the MOCART scores were consistently high enough to surpass the MCID and PASS thresholds throughout the follow-up period. Additionally, the stable T2 values indicate the durability of the repaired hyaline cartilage, which may have contributed to further improvements in clinical scores. Retzky et al 31 reported that a MOCART score of 55 was associated with achieving PASS and MCID thresholds for the Knee injury and Osteoarthritis Outcome Score Quality of Life subscale after patellofemoral ACI. However, a threshold MOCART score predictive of achieving PASS after AOT has not yet been established. Future studies aimed at identifying such thresholds may help explain the observed mismatch between MRI and clinical outcomes after AOT.
This study has strength as, to our knowledge, this is the first to document longitudinal changes in structural outcomes after AOT, compared with previous studies that primarily focused on clinical and structural outcomes at specific time points, using conventional MRI.9,37,38,41 Thus, this study enriches the comprehensive understanding of AOT and the role of hyaline cartilage for future research.
Limitations
However, this study has several limitations. First, the small sample size may restrict the generalization of our findings. Second, this was a retrospective study design that did not include a control group. A comparison with other cartilage repair techniques, such as microfracture, which primarily result in the formation of fibrocartilage rather than hyaline cartilage, would have enriched the insights into the influence of hyaline cartilage on surgical outcomes. Third, the broad time range for the final follow-up may have influenced the interpretation of results. Finally, the absence of histological analysis prevented a more detailed assessment of hyaline cartilage repair at the cellular level.
Conclusion
Postoperative improvements in clinical and MRI outcomes after AOT at the early term follow-up were maintained through a mean follow-up of 4 years. The further improvement in clinical outcomes, despite stable MRI findings, suggests a limited correlation between structural and clinical outcomes.
Footnotes
Final revision submitted February 13, 2025; accepted March 28, 2025.
The authors declared that there are no conflicts of interest in the authorship and publication of this contribution. AOSSM checks author disclosures against the Open Payments Database (OPD). AOSSM has not conducted an independent investigation on the OPD and disclaims any liability or responsibility relating thereto.
Ethical approval for this study was obtained from Asan Medical Center Institutional Review Board (Receipt No. S2024-0528-0001).