
Abstract
Background:
Individual risk factors for osteochondral fractures (OCFs) have been discussed separately; nonetheless, there is a lack of established systematic assessment models to predict the risk of OCFs after lateral patellar dislocation (LPD). Timely diagnosis, appropriate treatment, and rehabilitation can help optimize outcomes for affected patients.
Purpose:
To develop a comprehensive and effective personalized scoring system based on demographic and clinical characteristics to help understand the factors associated with OCFs after LPD and compare the anatomic differences of OCFs in different locations.
Study Design:
Case-control study; Level of evidence, 3.
Methods:
From 2016 to 2023, a total of 369 patients with LPD who were admitted to our hospital were enrolled in this study; OCFs were considered positive events, and patient characteristics and imaging data were collected. Backward stepwise regression identified independent risk factors associated with the incidence of OCFs after LPD. A predictive nomogram was constructed based on the analysis results. The predictive performance was assessed using receiver operating characteristic curves (ROCs), calibration plots, and decision curve analysis.
Results:
After regression analysis, skeletal immaturity, higher body mass index (BMI), shorter tibial tuberosity-trochlear groove distances, knee valgus, and smaller patellar tilt angles were identified as independent risk factors and incorporated into the predictive model. The ROC curve, calibration plot, Hosmer-Lemeshow test, and decision curve analysis all demonstrated good performance in both the training and validation cohorts. The area under the curve was 0.769 and 0.794 in the training and validation cohorts, respectively.
Conclusion:
This study developed a comprehensive and effective personalized nomogram with 5 predictors (skeletal maturity, BMI, tibial tubercle-trochlear groove distance, mechanical axis deviation, and patellar tilt). This tool quantifies the risk factors for OCFs and provides a more detailed understanding of how these factors interact with one another.
Osteochondral fractures (OCFs) are complications of lateral patellar dislocation (LPD), occurring on the posterior surface of the patella or the lateral femoral condyle during dislocation or relocation. 8 Intra-articular OCFs may occur concurrently in 2.3% to 44% of cases of LPD.9,13,15 OCFs of the knee joint pose significant harms to patients, manifesting as pain, instability, impaired mobility, joint stiffness, and reduced range of motion. These fractures compromise the structural integrity of the knee joint, leading to cartilage damage and an increased risk of developing osteoarthritis over time. 20 OCFs are considered one of the surgical indications for LPD. 16
LPD occurs due to a complex interplay of various anatomic and biomechanical factors. Patients with LPD usually have anatomic abnormalities such as increased tibial tubercle-trochlear groove (TT-TG), excessive femoral torsion, trochlea dysplasia, patella alta, knee valgus, and medial patellofemoral ligament injury.4,7,23 The anatomic changes may alter the pattern of patellofemoral cartilage injury.
Stefanik et al 17 found that patients with patellar alta were 2.4 times more likely to have lateral cartilage damage than the normal population. However, Johnson et al 6 suggest that patients with patella alta tend to experience less severe cartilage damage after LPD; nonetheless, the location of cartilage damage appears to be similar to that observed in normal populations. Uimonen et al 19 found that the risk of OCF after patellar dislocation was related to anatomic factors such as carriage morphology, patellar position, and other factors. In addition, some studies 26 have reported that male patients are more likely to develop OCFs after LPD.
Although individual risk factors have been discussed separately, there is a scarcity of established systematic assessment models to predict the risk of OCFs after LPD. Timely diagnosis, appropriate treatment, and rehabilitation are crucial in mitigating the harms associated with OCFs and optimizing outcomes for affected patients. Therefore, developing a new tool to assess the individual risk of OCF occurrence after LPD may help our understanding of the factors that contribute to the development of OCFs.
This study aimed to develop a comprehensive and effective personalized scoring system based on patient and clinical characteristics to help understand the factors associated with OCFs after LPD and compare the anatomic differences of OCFs in different locations.
Methods
Patients with LPD who were treated with arthroscopically assisted surgery at our hospital between 2016 and 2023 were included in this study. An osteochondral fragment is defined as an intra-articular loose body containing both cartilage and bone components that have been cleaved from the articular surface of the patellofemoral joint. The chondral lesion grading follows the Outerbridge Classification, with patients classified as grade 3 or 4 based on either imaging or arthroscopic examination. The exclusion criteria were as follows: (1) concomitant ligament or meniscal injury; (2) presence of patellofemoral arthritis; (3) missing relevant imaging data; and (4) a history of knee surgery and/or lower limb trauma. OCFs were considered positive events. Patient characteristics and radiographic data were obtained from medical records. A total of 369 patients were included in this study, with 259 in the training cohort, where the incidence of OCFs was approximately 25.1%. The patient selection flowchart is presented in Figure 1. The study was approved by the Hebei Medical University Third Hospital Ethics Committee.
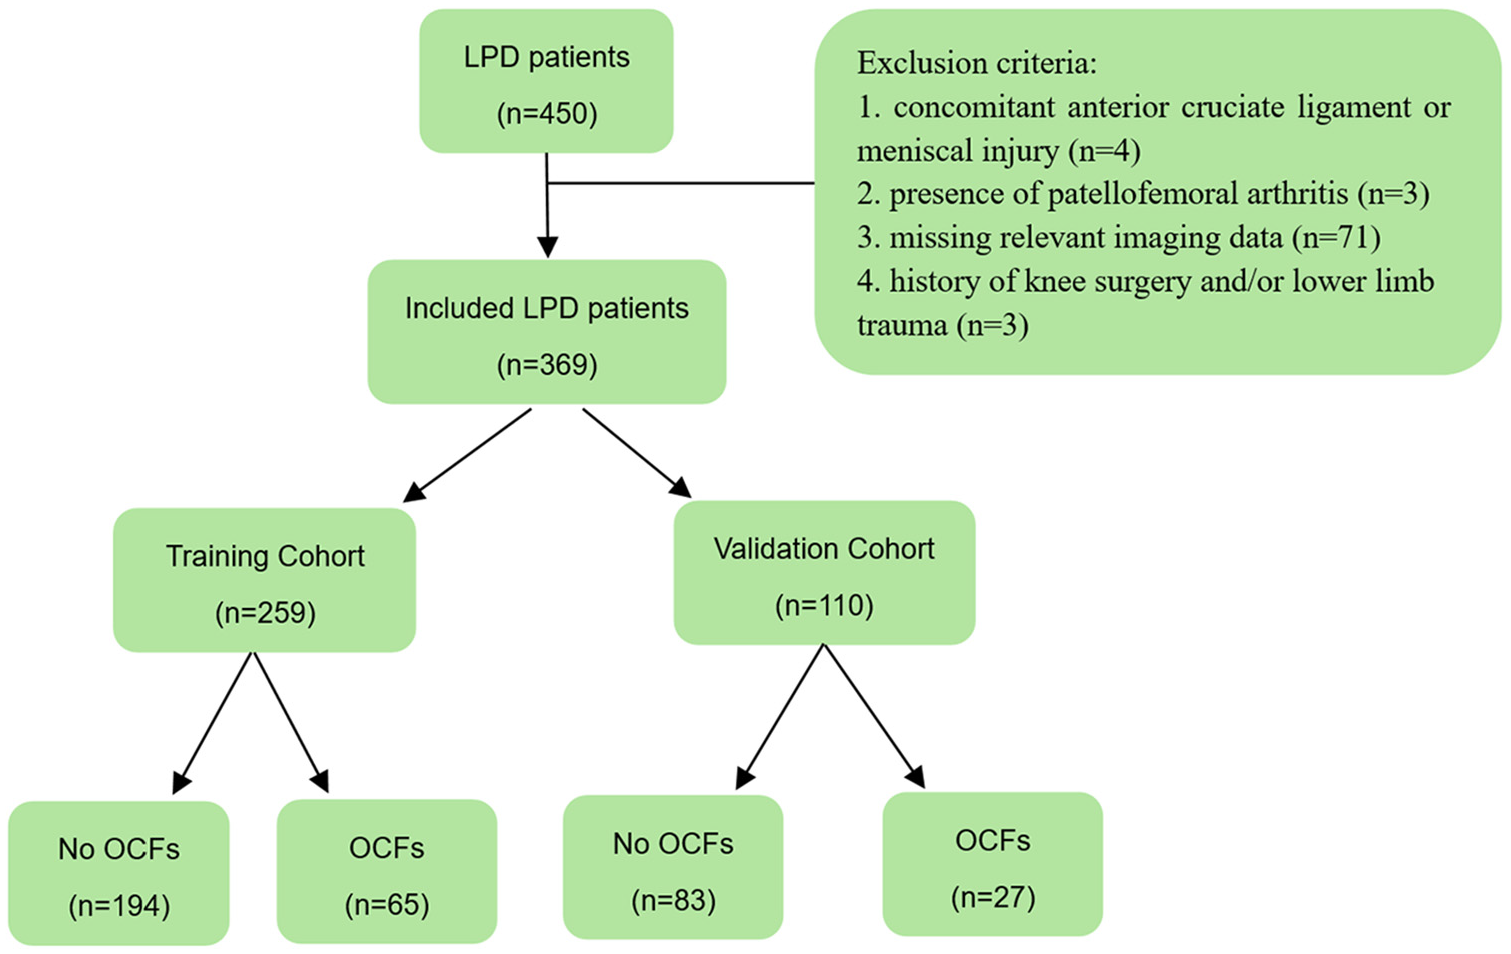
Flowchart of patient selection. LPD, lateral patellar dislocation; OCFs, osteochondral fractures.
Radiographic Measurements
Two experienced orthopaedic surgeons, blinded to the clinical history, independently performed radiographic measurements on imaging data twice, with an 8-week interval between each measurement. The mean of the 2 measurements was used for analysis. In case of disagreement between the results, a third author (Z.N.) conducted a third measurement, and the mean of the observations that were closer to one another was used. Intraclass correlation coefficients (ICCs) were calculated within groups to assess intraobserver and interobserver reliability; an ICC of 0.75 was considered excellent. Skeletal maturity was assessed through radiographs. Patients were considered skeletally mature if the growth plates of both the femur and tibia were completely closed. This assessment was conducted by a pediatric orthopaedic specialist.
An evaluation of reported anatomic risk factors for LPD was performed, including (1) trochlear morphology, (2) TT-TG distance, (3) lateral patellar tilt angle (PTA), (4) patellar height, (5) femoral anteversion angle, (6) patellar-trochlear groove distance, and (7) knee valgus (Figure 2). The trochlear morphology was classified according to the Dejour classification, while the patellar height was assessed using the Insall-Salvati index. The knee valgus was assessed on the full-length radiograph of the lower limb using mechanical axis deviation (MAD).

Radiographic measurements. (A) The TT-TG distance is the distance between the tibial tubercle and the trochlear groove. (B) The PTA is the angle between the patellar axis and the posterior condylar line of the femur. (C) The FAA is the angle between the femoral neck axis and the posterior condylar line of the femur. (D) The PT-TG distance is the distance between the medial edge of the patella and the trochlear groove, with a positive value indicating the medial edge of the patella is located lateral to the groove. (E) The Insall-Salvati index is the ratio of the distance from the lower edge of the patella to the tibial tubercle to the length of the patella (①/②). (F) The MAD is the distance from the center of the knee joint to the mechanical axis of the lower limb, with a negative value indicating the center of the knee joint is medial to the mechanical axis. (G) OCF of the femoral condyle and intra-articular loose bodies of cartilage in the knee joint. FAA, femoral anteversion angle; MAD, mechanical axis deviation; OCFs, osteochondral fractures; PTA, patellar tilt angle; PT-TG, patella-trochlear groove; TT-TG, tibial tubercle-trochlear groove.
Statistical Analysis
Univariate logistic regression analysis was employed to assess the relationship between OCFs risk in LPD patients and clinical parameters, as well as imaging features. Factors with P < .1 were included in further analyses. A backward stepwise regression was utilized to select the most robust combination of these predictive factors from the entire cohort. Factors meeting the inclusion criterion of P < .05 or deemed clinically significant were incorporated into the model. Based on the results of the final regression analysis, a nomogram depicting the probability of OCFs was constructed. An independent samples t test and a chi-square test were utilized to investigate whether there were differences in anatomic abnormalities in the occurrence locations of OCFs.
The discriminative ability of the model was determined by the area under the receiver operating characteristic curve (AUC), which ranged from 0.5 (no discrimination) to 1 (perfect discrimination). 2 Typically, AUC values >0.7 suggest a reasonable estimation. 21 The calibration curves are utilized to assess the accuracy of absolute risk predictions provided by the model, with further evaluation conducted using the Hosmer-Lemeshow test. The Brier score can be interpreted as an extension of the Hosmer-Lemeshow test, where closer proximity to 0 indicates better model calibration. The decision curve analysis (DCA) was used to evaluate the clinical application of the model.
Subsequently, internal validation was conducted using the bootstrap method to assess its predictive accuracy. The calibrated C-index and calibrated Brier score were obtained after 1000 repetitions of sampling.
Statistical analyses and graphical representations were performed using SPSS 20.0 (IBM) and R software Version 4.3.1 (R Foundation for Statistical Computing). The “rms” package was used to develop a nomogram and calculate C-index and Brier scores. The ROC curves, calibration curves, and DCA were used to visualize the comprehensive performance of the models. The significance level was set at P < .05 for all analyses, and all tests were 2-tailed unless otherwise specified. According to G-power (3.1.9.2), at least 128 patients needed to be included in this study (effect = 0.5, α = .05, and power = 0.8).
Results
The characteristics and imaging measurements of patients in both the training and validation cohorts are summarized in Table 1. Intraobserver and interobserver agreement were excellent, with ICCs >0.8 for both. The descriptive and imaging information of patients in the training and validation cohorts is presented in Table 1. Skeletal maturity, BMI, TT-TG distance, PTA, and MAD were included in the multivariable regression analysis. The results of the multivariable regression analysis are shown in Table 2. After regression analysis, skeletal immaturity, higher BMI, shorter TT-TG distances, knee valgus (smaller mechanical axis deviation), and smaller patellar tilt angles were identified as independent risk factors.
Demographic and Radiographic Data of Patients a

BMI, body mass index; FAA, femoral anteversion angle; MAD, mechanical axis deviation; NS, nonsignificant; OCFs, osteochondral fractures; PTA, patella tilt angle; PT-TG distance, patella-trochlear groove distance.
Multivariate Analyses of the Independent Risk Factors Associated With OCFs after LPD a

BMI, body mass index; MAD, LPD, lateral patellar dislocation; MAD, mechanical axis deviation; OCFs, osteochondral fractures; PTA, patella tilt angle; OR, odds ratio; TT-TG distance, tibial tubercle-trochlear groove distance.
Based on the results of the multivariable analysis, a predictive nomogram was constructed to facilitate more intuitive and convenient clinical application (Figure 3). This nomogram includes 5 factors, each assigned a specific score on the upper axis. The total score is calculated as the sum of individual scores for each predictive factor, corresponding to the predicted probability of OCFs after LPD, as indicated on the probability axis at the bottom of the nomogram. The AUC was 0.769 (95% CI, 0.705-0.833) (Figure 4), indicating good discriminatory ability of the model. The c-index and the Brier score were 0.769 and 0.053, respectively. After internal bootstrap validation (B = 1000 repetitions), the calibrated values were 0.749 and 0.055, demonstrating satisfactory overall performance of the model. The calibration curve showed excellent agreement between predicted probabilities and actual OCF incidence in both cohorts (Figure 5). DCA indicated that the net benefit of using the predictive model was significant in both cohorts (Figure 6), suggesting good clinical applicability of our nomogram. In addition, the discriminatory ability of the model was similarly robust in the external validation dataset, with an AUC of 0.794.

Nomogram for predicting the occurrence of OCFs in patients with LPD. This predictive nomogram incorporates 5 factors, each assigned a specific score on the top axis. The total score, calculated by summing the individual scores for each predictive factor, corresponds to the predicted probability of OCFs after LPD, as shown on the probability axis at the bottom of the nomogram. BMI, body mass index; MAD, mechanical axis deviation; PTA, patella tilt angle; TT-TG distance, tibial tubercle-trochlear groove distance.

ROC curves for the nomogram in the training (Left) and validation cohorts (Right). In the training and validation cohorts, the AUC of the nomogram is 0.769 and 0.794, respectively, indicating that the model has good discriminative ability. AUC, area under the curve; ROC, receiver-operating characteristic.

Calibration curves of the nomogram in the training cohort (Left) and validation cohort (Right). The x-axis represents the predicted probability. The y-axis represents the actual recurrence rate. The diagonal dashed line represents a perfect prediction of an ideal model. The bias-corrected line (green line) indicates the predictive power of this nomogram, and the more it fits with the apparent line (red line), the better the predictive ability.
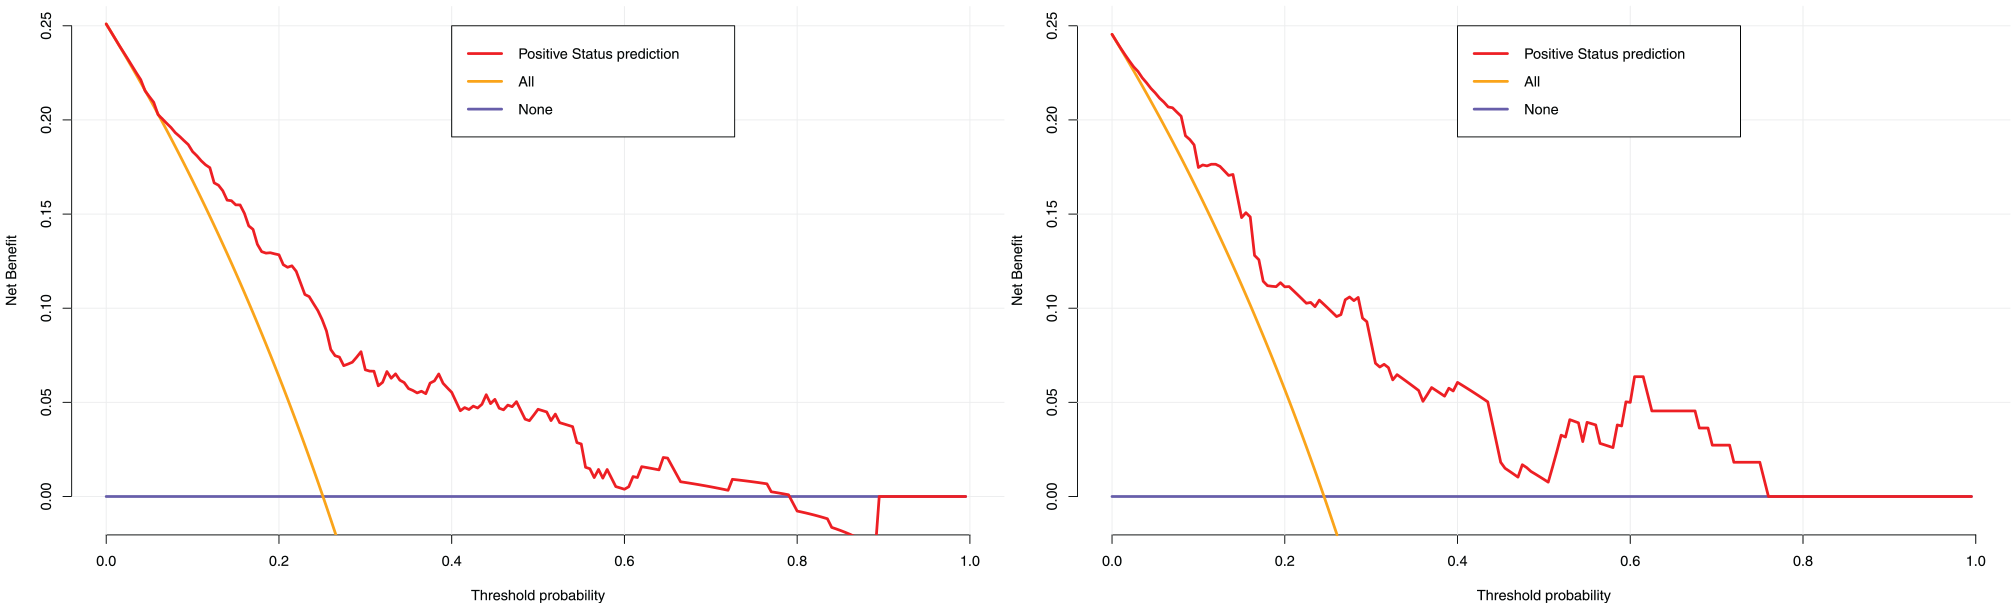
DCA for the nomogram in the training cohort (Left) and validation cohort (Right). The x-axis represents the high-risk threshold. The y-axis represents the net benefit. The red line indicates the net benefit of our nomogram. The yellow line indicates the hypothesis that all LPD patients had OCFs. The black horizontal line indicates the hypothesis that no patients with LPD had OCFs. DCA, decision curve analysis; LPD, lateral patellar dislocation; OCFs, osteochondral fractures.
The locations of OCFs (patella or femur) showed no statistically significant differences in patient and imaging characteristics (Table 3).
Demographic and Radiographic Measurements of Patients With OCFs a

BMI, body mass index; FAA, femoral anteversion angle; MAD, mechanical axis deviation; NS, nonsignificant; OCFs, osteochondral fractures; PTA, patella tilt angle; PT-TG distance, patella-trochlear groove distance; TT-TG distance, tibial tubercle-trochlear groove distance.
Discussion
The study demonstrates that BMI, MAD, PTA, skeletal maturity, and TT-TG distance were associated with OCFs after LPD. Moreover, based on these risk factors, we have developed a comprehensive nomogram to accurately predict the individual risk of the incidence of OCFs. This tool quantifies the risk factors for OCFs and provides a deeper understanding of the interactions between these factors, offering insights that go beyond what has been presented in previous studies. In the training cohort and validation cohort, the AUC produced by the predicted values was 0.769 and 0.794, respectively. The model seems to exhibit a great performance. The calibration curve showed excellent agreement between predicted probabilities and actual OCF incidence in both cohorts, and DCA showed good clinical applicability of our nomogram.
There is limited research on the factors contributing to OCFs resulting from LPD. Palmowski et al 10 concluded that risk factors for the development of LPD do not influence the risk of knee injury after primary LPD. They included a total of 50 patients, which is a limitation in terms of sample size. Uimonen et al 19 investigated the relationship between patellofemoral joint anatomy and OCFs. They compared key anatomic landmarks and found that in patients with OCFs after LPD, the trochlear configuration and vertical position of the patella were closer to normal anatomy, while greater lateral patellar tilt was observed compared with patients without OCFs. In the study by Zheng et al, 27 normal trochlear groove, normal TT-TG distance, and skeletal maturity were identified as risk factors for acute cartilage injury after LPD. Although trochlear groove morphology did not show statistically significant differences in our study, the overall trends align with previous research. Our findings suggested that common anatomic abnormalities associated with LPD appear to be protective factors against OCFs. In other words, although these anatomic abnormalities are typically associated with patellar dislocation, they might reduce the risk or severity of OCFs in the context of LPD. This finding may be explained by the way anatomic abnormalities influence the mechanical forces acting on the knee. These abnormalities could alter how forces are distributed across the knee, potentially reducing the direct impact or pressure on the cartilage and bone, and thus lowering the risk of OCFs. In addition, the body might adapt to these variations, with other structures such as ligaments or cartilage adjusting to better withstand the forces, providing a protective effect. Moreover, changes in joint motion or range of motion due to these anatomic differences could help avoid high-risk movements, further reducing the likelihood of injury. These protective mechanisms, however, require further investigation to fully understand how they contribute to the occurrence of OCFs in the context of patellar dislocation. A strength of our study lies in the inclusion of individual patient demographics as risk factors, providing a more comprehensive approach to predicting OCFs in patellar dislocation. Moreover, rather than studying each factor independently as done in previous research, our model facilitates an integrated scoring based on personalized factors. Given the presence of multiple risk factors in LPD patients, 14 risk prediction should shift from isolated risk factors to a systematic combination of various risk factors.
A shorter TT-TG distance and a smaller PTA often indicate the need for greater energy when the patella dislocates laterally. During both the dislocation and relocation phases of patellar dislocation, there is increased collision and compression forces between the patella and the lateral femoral condyle. This results in more severe collision and compression of the articular cartilage, and it is the direct cause of OCFs under significant forces. Knee valgus has rarely been discussed in the past. Unlike other anatomic factors, knee valgus represents an abnormal alignment of the tibiofemoral joint. A more negative MAD (A MAD value of <0 indicates knee valgus) indicates a greater deviation of the knee joint center from the mechanical axis, making the patella more prone to lateral dislocation. 5 We thought that this phenomenon may be due to the increased lateral patellofemoral joint pressure caused by knee valgus. Knee valgus leads to abnormal distribution of contact pressure of the lateral patellofemoral joint. 25 The biomechanical changes in the knee joint caused by knee valgus are complex. During the flexion process, further internal rotation of the femur in a valgus knee can cause a dramatic increase in pressure and force on the lateral aspect of the patellofemoral joint,11,24 leading to LPD and associated OCFs, particularly when other anatomic structures are normal.
The difference lies in the role of skeletal maturity among patients with OCF compared with the study by Uimonen et al. 19 However, the reasons for this difference remain unclear. The results from Broom et al 3 indicate that under shear loading conditions, the dynamic mode 2 fracture toughness of the osteochondral region in mature tissue is approximately 1.5 times greater than that of immature tissue, while the derived dynamic shear stiffness of immature tissue is approximately 4 times greater than that of mature tissue. Therefore, under the violence of patellar dislocation, immature cartilage tissue is more likely to fracture and fall off. Thambyah and Broom 18 found that in intact tissues of adult animals, fractures are primarily confined to the upper third of the cartilage thickness. In intact tissues of adolescent animals, fractures progress into the deeper matrix region, traversing through the underdeveloped calcified cartilage zone and into the underlying bone. In adults, cartilage injury often presents as surface damage to the cartilage. The significant impact forces resulting from patellar dislocation are more likely to penetrate deeper and lead to full-thickness OCFs in skeletally immature patients.
Some studies 19 have reported that trochlear morphology is also a risk factor. During dislocation and relocation, the direct cause is the impact between the patella and the femoral condyle. Therefore, the morphology of the patella and femoral trochlea is crucial. Because the Dejour classification is more commonly used in clinical practice, we have incorporated it into our study. Nevertheless, we found that trochlear morphology is not a risk factor. However, because of the inability to quantify trochlear morphology, this remains inconclusive. There is a certain correlation between increased TT-TG, PTA, and trochlear morphology, and they may collectively influence the occurrence of OCFs. However, because most of the patients we included had trochlear dysplasia, the effect of trochlear morphology was likely to be low.
There are fewer studies on the relationship between differences in the location of OCFs and anatomic factors. Johnson et al 6 concluded that cartilage damage after patellar instability was less severe in patients with patellar alta, but there was no significant difference in the incidence or location of cartilage defects. Zheng et al 27 concluded that the normal femoral trochlea is an independent risk factor for acute lateral femoral condylar articular cartilage lesions. Due to the outward pulling force during LPD, excessive lateral facet convexity of the femoral condyle can lead to OCFs on the lateral aspect of the femoral condyle. We found no association between the anatomic factors and the location of OCFs, whether they occurred in the patella or the femur. Knee activity patterns at the time of injury may be relevant, but we did not investigate them further due to a lack of data. In addition, the toughness and stiffness of the patellar and femoral cartilage may also influence the location of OCFs.
Research1,22 has reported that magnetic resonance imaging (MRI) and plain radiographs demonstrate limited sensitivity in identifying loose bodies or osteochondral defects after patellar dislocation. Among the 90 patients with OCF included in our study, MRI reports for 6 patients did not show loose cartilage fragments. While such errors are reasonable, incorporating the scoring system can enhance precision. Compared with previous studies12,27 that commonly utilized MRI for evaluating cartilage condition after patellar dislocation, our assessment relies on a combination of imaging and arthroscopic examination, thus ensuring high accuracy. Our model can effectively complement imaging data to address this dilemma.
Based on our findings, we infer that patients at a high risk of OCF after patellar dislocation may exhibit different dislocation patterns compared with those with severe bony deformities. This distinction may assist in further classifying patellar dislocation cases and developing personalized treatment plans. In terms of etiology, the cartilage damage of the patellofemoral joint differs from the anatomic risk factors associated with recurrent patellar dislocation. This may suggest a lack of strong correlation between simple recurrent patellar dislocation and long-term patellofemoral osteoarthritis. Further individualized analysis based on anatomic considerations is still needed.
Limitations
This study has some limitations. First, our study was retrospective, inherently leading to selection bias and recall bias. Second, the analysis of the femoral trochlea was based solely on the Dejour classification, without the use of quantitative or qualitative methods. Third, in the subgroup analysis of the location of OCFs, because of the lack of detailed surgical records in many past cases, we did not perform specific site statistics, including patellar size and exact location. Finally, we only included a subset of the population from our hospital, and our model has only undergone internal validation. The accuracy of this model may vary when applied to other centers because of differences in practice settings.
Conclusion
This study developed a comprehensive and effective personalized nomogram with 5 predictors (skeletal maturity, BMI, TT-TG distance, mechanical axis deviation, and patellar tilt). This tool quantifies the risk factors for OCFs and provides a more detailed understanding of how these factors interact with one another. By analyzing their combined effects, it offers a deeper insight into the complex relationships between these risk factors.
Footnotes
Final revision submitted February 1, 2025; accepted March 4, 2025.
One or more of the authors has declared the following potential conflict of interest or source of funding: This work was supported by the Natural Science Foundation of Hebei Province (H2022206534). AOSSM checks author disclosures against the Open Payments Database (OPD). AOSSM has not conducted an independent investigation on the OPD and disclaims any liability or responsibility relating thereto.
Ethical approval for this study was obtained from Hebei Medical University Third Hospital Ethics Committee (No Ke2023-002-1).