
Abstract
Background:
Adolescent baseball players often experience throwing arm complaints from the repetitive activity of baseball, which can affect performance and overall well-being. More focus is needed on their psychological and social challenges in order to achieve better treatment outcomes.
Purpose:
To investigate changes in the health-related quality of life (HRQOL) among adolescent baseball players in Taiwan and identify the factors that influence HRQOL.
Study Design:
Cohort study; Level of evidence, 2.
Methods:
Taiwanese adolescent baseball players (12-18 years old) of all positions from junior and senior high schools were surveyed every 3 months for 1 year (starting in August 2022). Data on demographic characteristics, training volume, throwing arm injury history, and Functional Arm Scale for Throwers (FAST) scores (1 measurement of HRQOL for baseball players) were collected and analyzed using mixed-effects regression models.
Results:
The study included 299 adolescent baseball players (mean age, 14 years; range, 12-18 years). Pitchers and outfielders exhibited higher FAST total scores than infielders and catchers (mean ± SE, 14.74 ± 16.60 and 14.24 ± 18.76 vs 8.92 ± 9.77 and 9.52 ± 9.56, respectively; P = .027), which indicated more physical disability and psychological impact. In the mixed-effects regression model for FAST total scores, injury history (estimate for mild injury, 7.18 ± 1.25; moderate injury, 18.28 ± 3.00; severe injury, 22.94 ± 3.76 vs healthy), player position (pitcher 4.20 ± 1.97 vs infielder), and months of follow-up (estimate for 3 months, –4.86 ± 1.33; 6 months, –4.55 ± 1.48; 9 months, –4.27 ± 1.85; 12 months –5.84 ± 2.28 vs 0 months). Training volume did not significantly affect HRQOL scores (P = .629).
Conclusion:
Our study demonstrated significant differences in most FAST total and subscale scores among player positions. Pitchers and outfielders exhibited higher FAST scores than the other positions, indicating more physical disability and psychological impact. Furthermore, the severity of throwing arm injury history significantly influenced FAST scores, with more severe injuries correlating with poorer outcomes. However, training volume did not significantly impact FAST scores. These data may help in future studies integrating patient-reported outcomes and HRQOL to evaluate athlete’s’ well-being beyond just physical parameters.
Keywords
Baseball players are prone to throwing arm injuries due to the repetitive throwing motion that puts stress on the shoulder and elbow. Previous studies have shown that baseball players, particularly pitchers, are at a higher risk of upper limb injuries compared with the general population.2,3,14,16,21 More than half of the injuries in Major League Baseball (MLB) are upper limb injuries, with 48.4% of them attributed to throwing motion. 2 Because throwing is a vital aspect of baseball, injuries to the throwing arm significantly impair baseball players, affecting not only their sports performance but also other areas of their lives, including psychological and social well-being.
Previous research on baseball has largely focused on epidemiological studies of injuries, biomechanical analysis of throwing motions, and evaluations of injury prevention interventions but has paid relatively less attention to the psychological and social impacts of baseball players. 1 Given that they are often competing with their own teammates for starting positions, baseball players frequently experience loneliness and thus need to address problems and seek solutions on their own. 9 As a result, baseball players tend to express their feelings after a sports injury in a negative manner. Rotella et al 23 posited that athletes’ emotions when unable to participate in training and competitions due to injuries resemble those experienced in mourning, with stages including shock, isolation, anger, bargaining, depression, acceptance, and adaptation. Likewise, Hardy and Crace 7 suggested that athletes’ responses to injuries are similar to experiences of facing death, exhibiting 5 stages of grief: denial, anger, bargaining, depression, and acceptance.
The importance of patient-reported outcomes (PROs) has continued to increase in clinical research, shifting the focus from physician-assessed physical examinations and laboratory test results to measurements that reflect patients’ experiences. PROs can aid physicians in evaluating patients’ health-related quality of life (HRQOL), and researchers have also begun applying this concept in sports medicine–related fields. 29 HRQOL refers to the impact of patients’ experiences, beliefs, expectations, and feelings about their physiological, psychological, and social health. Previous clinical studies4,11,20,25 on throwing sports have mainly focused on such impairments as pain, shoulder and elbow joint angles, or strength or functional limitations like throwing ability, distance, and speed. However, research on the psychological changes and social interactions of throwing athletes after sports injuries is lacking. We believe that sports performance is influenced by physical function but also significantly by psychological and social factors. Measuring HRQOL aims to address this aspect.
The objective of this study was to investigate the changes in the HRQOL of adolescent baseball players in Taiwan and identify the factors affecting HRQOL. We hypothesized that playing positions, injury history, or training volume could affect HRQOL of Taiwanese adolescent baseball players.
Methods
Participants
We performed a prospective longitudinal study tracking changes of functional and psychological outcomes related to the upper extremity of adolescent baseball players (12-18 years old) in Taiwan from several junior and senior high school baseball teams in Taiwan starting in August 2022. The survey items included baseline characteristics (name, date of birth, height, weight, date of assessment, playing position, past/recent injury history), the Functional Arm Scale for Throwers (FAST) scale,8,24 and a survey on training volume. To protect the privacy of participants, we used a research code and English abbreviation to represent their identities. This code did not reveal the participants’ names, ID numbers, or addresses. Furthermore, the principal investigator (P.-C.C.) maintained confidentiality regarding the survey results to ensure participants’ privacy. Participants who understood and signed the informed consent form were included in this study. Because most participants were minors (age ≤17 years), parental consent was also obtained for these school participants.
Survey Process
This study was approved by the institutional review board (No. 202002365B0). Our research investigators obtained permission from each team coach or teacher before conducting surveys in the classroom. To ensure that the questionnaires were not administered immediately after a competitive situation, we confirmed beforehand whether participants had a match on the assessment date. During the survey process, the research investigator informed the baseball players of the assessment content, instructions, and response principles while ensuring confidentiality and the withholding of test results from coaches. Athletes could choose not to fill out the questionnaire if they did not wish to participate in the study. If the baseball players had questions, the investigators provided appropriate responses. All investigators underwent training and communication before questionnaire administration to ensure that they understood the content and standard procedures; the survey process took approximately 20 minutes. After collecting the questionnaires, the principal investigator reviewed the responses and removed data with omissions or significant response errors.
Determinants
Individual Level
Age
Body mass index (BMI)
Training volume: Based on the literature review by Norton et al
18
on risk factors for shoulder and elbow injuries in adolescent baseball players, the training volume of baseball players, regardless of position, can be quantified in the following ways: Training hours per day Training days per week Games played per year
From these records, we were able to calculate training hours per week and games per year. For pitchers, the training volume can be quantified as follows:
Innings pitched per game
Games pitched per year
From these records, we were able to calculate innings pitched per year.
(4) Position: Positions were divided into pitcher, catcher, infielder, and outfielder. For elementary or junior high schools, we found that the baseball positions were usually not fixed (eg, pitchers sometimes also practiced as outfielders). These participants were asked about the position they practiced most frequently in a single season during interviews, and this position served as their individual position for our analysis.
(5) Injury history: During the first interview with the athlete, inquiries were made about any injuries in the past year that required rest before resuming training or competitions. The results were categorized as follows:
(a) Healthy: no health issues and full participation in training or competition
(b) Mild injury: able to fully participate in training or competition despite some discomfort, or requiring 1 to 20 days of rest to recover for training or competition
(c) Moderate injury: requiring 21 to 60 days of rest to recover for training or competition
(d) Severe injury: requiring ≥61 days of rest to recover for training or competition
School Level
Baseball players from the same school had similar schedules and training content, so we considered the correlation of these factors during analysis.
Questionnaire
FAST Scale
The FAST scale,8,24 a measurement for the HRQOL of baseball players, consists of 22 items that are applicable to all positions (pitcher, catcher, infielder, outfielder), with 5 main constructs: pain (selecting 6 items related to pain from the other 4 constructs), throwing (10 items), activities of daily living (ADLs) (5 items), psychological impact (4 items), and advancement (3 items). In addition to the original 22 items, pitchers have 9 additional items. A 5-point Likert scale is used, with 1 indicating satisfaction or no symptoms at all and 5 indicating extreme dissatisfaction or severe symptoms. Higher scores indicate more severe symptoms. Finally, we used the following formula to calculate the FAST total score, FAST subscale score, and FAST pitcher module score: [(sum of scores for n items ÷ n) – 1] × 25. Scores ranged from 0 to 100, with higher scores indicating poorer HRQOL. In this study, we observed the changes in the HRQOL of each adolescent baseball player throughout 1 year, with assessments conducted every 3 months.
Statistical Analysis
This study mainly investigated the correlation between the HRQOL of baseball players and various covariates. The FAST scale, including the subscale and total scores, was repeatedly measured for all enrolled baseball players. The baseball players belonged to specific school teams, which revealed a hierarchical relationship between school, individual, and time. Therefore, we used a 3-level mixed-effects model. The hierarchical levels are as follows: level 1, time; level 2, individual; level 3, school. HRQOL was treated as a continuous variable and analyzed using a mixed-effects linear regression model. The statistical program was as follows:

Results
This longitudinal study included 299 adolescent baseball players from 6 schools, with 95 pitchers, 89 outfielders, 91 infielders, and 24 catchers (Table 1). We observed significant differences in height, weight, and BMI among these positions. However, we found no significant difference in age, training hours per week, games per year, or injury history among these positions. According to our data, the training hours per week ranged from 24.54 ± 7.34 (catchers) to 27.03 ± 8.55 (pitchers), and the number of games per year ranged from 12.20 ± 12.24 (infielders) to 14.13 ± 11.34 (catchers). We also collected the data of innings per year for pitchers (24.51 ± 26.33).
Baseline Characteristics of the Adolescent Baseball Players a

Values are reported as mean ± SD unless otherwise noted.
<0.001.
<0.05.
<0.01.
The baseline HRQOL of these adolescent baseball players is reported in Table 2. Most subscales of the FAST scale (pain, throwing, ADL, and psychological) demonstrated significant differences, whereas the advancement subscale seemed to show nonsignificant differences among these positions. Pitchers and outfielders had similar FAST subscales and total scores (14.74 ± 16.60 for pitchers; 14.24 ± 18.76 for outfielders), whereas infielders and catchers had similar FAST subscales and total scores (8.92 ± 9.77 for infielders; 9.52 ± 9.56 for catchers). The subscale for the pitcher module was 15.90 ± 21.40.
Baseline Health-Related Quality of Life Scores of the Adolescent Baseball Players a

Values are reported as mean ± SE. Higher score for the Functional Arm Scale for Throwers (FAST) indicates greater impairment.
<0.05.
<0.01.
In the mixed-effects model for FAST total score, injury history (mild level, estimate [mean ± SE] 7.18 ± 1.25,P < .001; moderate level, estimate 18.28 ± 3.00, P < .001; severe level, estimate 22.94 ± 3.76, P < .001; compared with healthy level), position (pitcher, estimate 4.20 ± 1.97, P = .034; compared with infielder), and months of follow-up (3 months, estimate –4.86 ± 1.33, P < .001; 6 months, estimate –4.55 ± 1.48, P = .002; 9 months, estimate –4.27 ± 1.85, P = .022; 12 months, estimate –5.84 ± 2.28, P = .011; compared with baseline) had significant effects on the FAST total score. Age, BMI, training hours per week, and games per year had no significant correlations with the FAST total score. No interaction effect was noted between position and months of follow-up (Table 3). The predicted value of the FAST total scores for each position in 1 year is shown in Figure 1. For other FAST subscale scores, injury history, position, and months of follow-up were primarily significantly correlated with each FAST subscale score (position was not significantly correlated with the FAST throwing and advancement subscale scores) (Appendix Tables A1-A5). In the mixed-effects model for FAST pitcher module score, injury history (mild level, estimate 9.36 ± 3.09, P = .003; moderate level, estimate 44.51 ± 6.18, P < .001) and months of follow-up (6 months, estimate –7.06 ± 2.63, P = .009; 9 months, estimate –7.98± 2.76, P = .006) each had a significant effect on the FAST pitcher module score (Table 4).
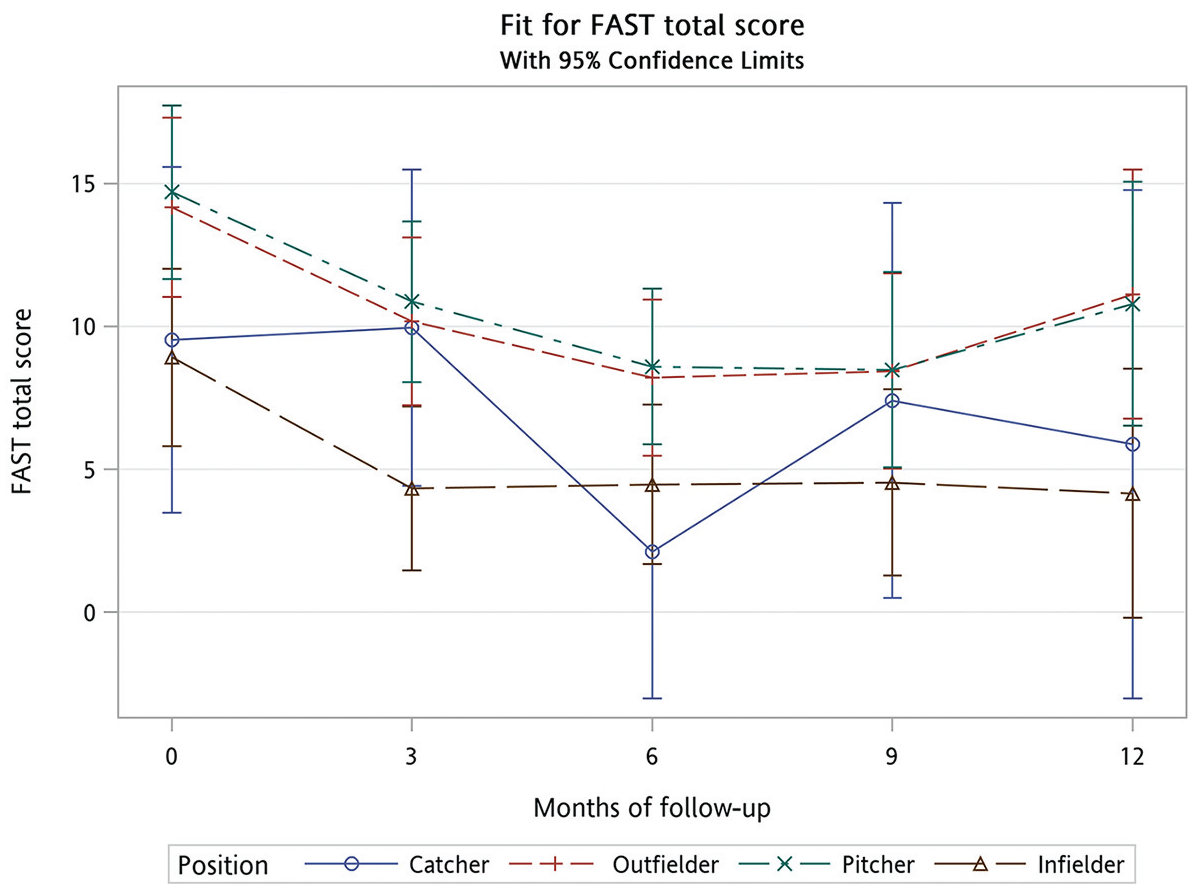
The predicted value of the Functional Arm Scale for Throwers (FAST) total scores for each position in 1 year.
Mixed Effects for FAST Total Score a
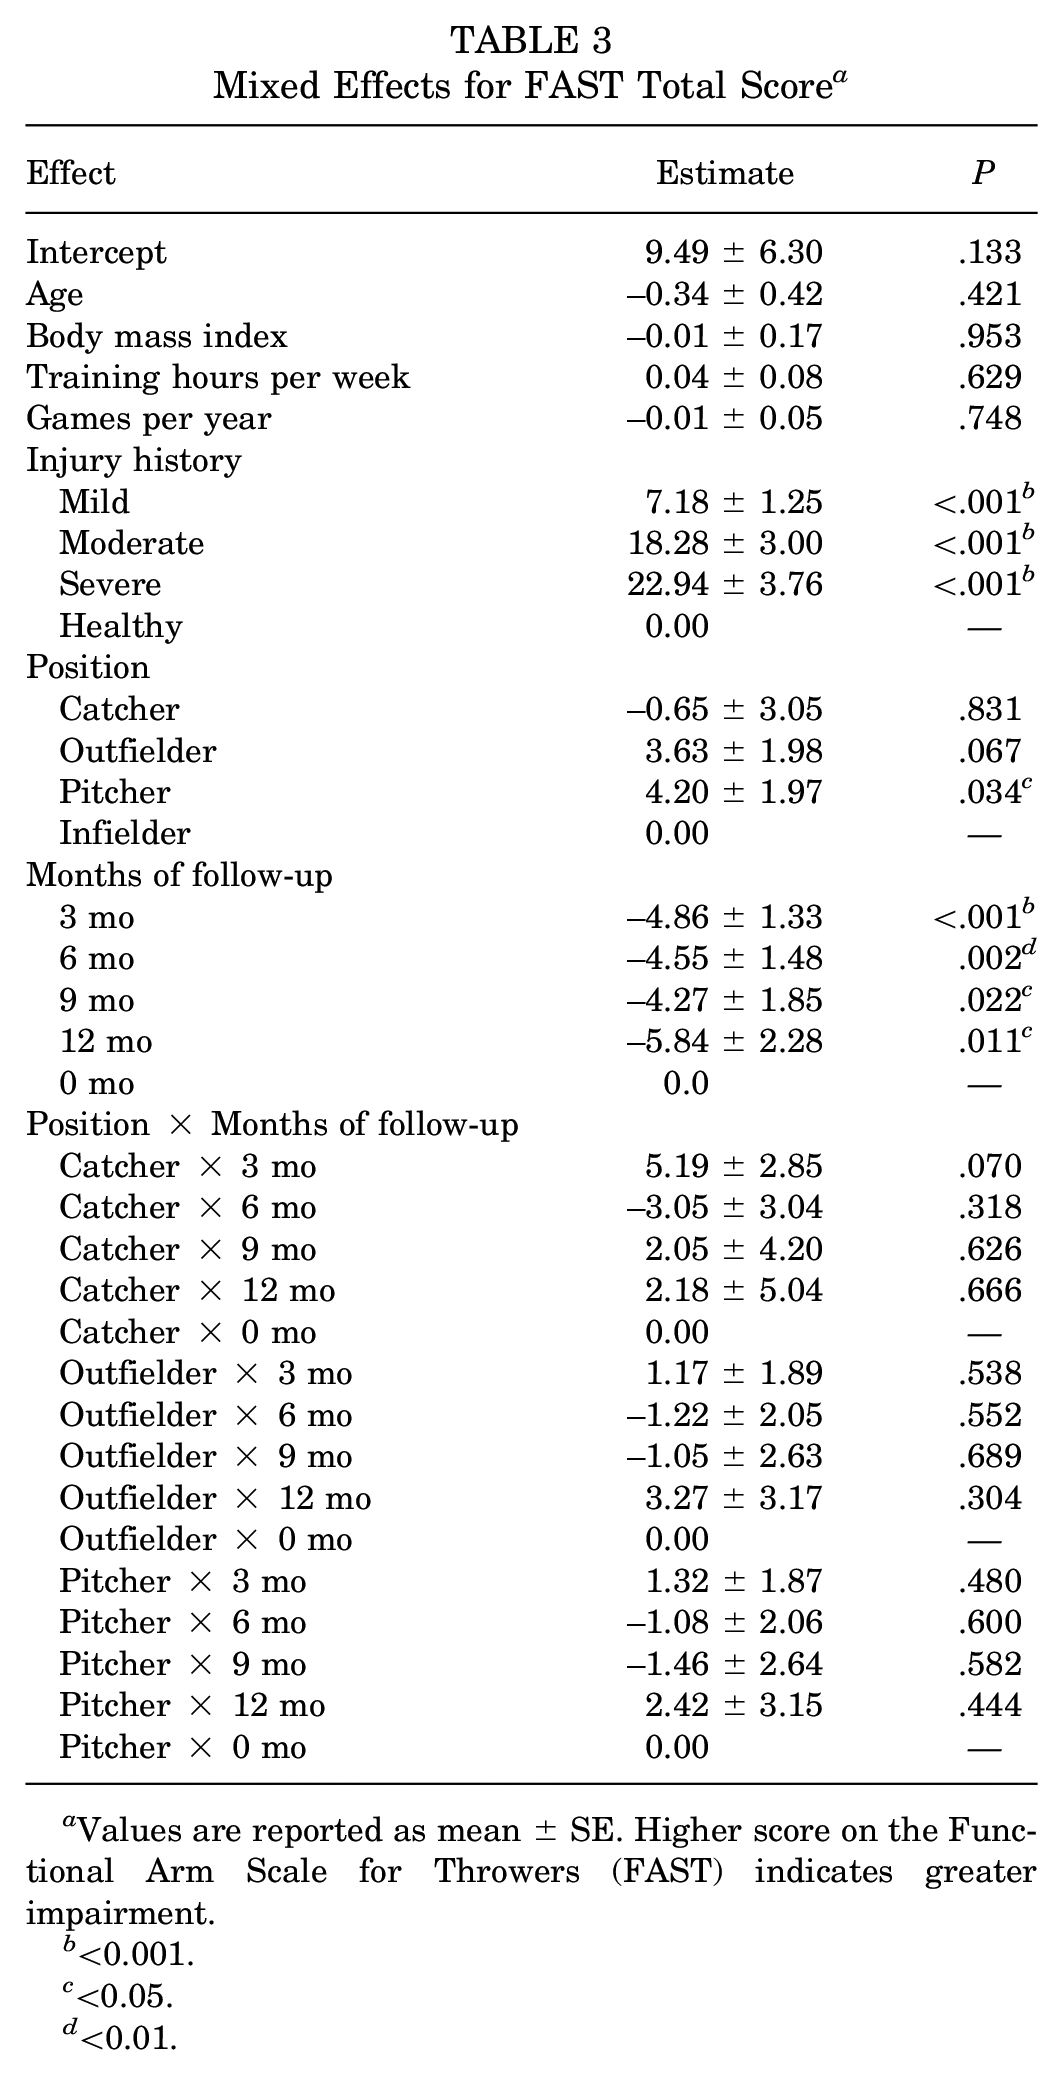
Values are reported as mean ± SE. Higher score on the Functional Arm Scale for Throwers (FAST) indicates greater impairment.
<0.001.
<0.05.
<0.01.
Mixed Effects for FAST Pitcher Module Score a

Values are reported as mean ± SE. Higher score on the Functional Arm Scale for Throwers (FAST) indicates greater impairment.
<0.01.
<0.001.
Discussion
The major findings of our study demonstrated no significant difference in age, training hours per week, games per year, or injury history among these positions of the adolescent baseball players in Taiwan, except for a higher BMI in catchers (24.88 ± 3.54; P = .004). Significant differences were noted in most FAST scale subscales (pain, throwing, ADL, psychological) among these positions, with the exception of the advancement subscale (P = .164). Pitchers and outfielders shared similar FAST subscales and total scores, as did infielders and catchers (FAST total scores, 14.74 ± 16.60 and 14.24 ± 18.76 for pitchers and outfielders vs 8.92 ± 9.77 and 9.52 ± 9.56 for infielders and catchers, respectively; P = .027). Injury history, position, and follow-up duration significantly influenced FAST total score. Other factors like age, BMI, training hours, and games per year had no notable correlation. Injury history and follow-up duration significantly affected the FAST pitcher module score as well.
Although many PRO scales have been used to assess upper limb function in the past, few have specifically evaluated the upper limb function of high-demand athletes. Using general population upper limb function PRO scales to assess baseball players often yields poor responsiveness. Therefore, a PRO scale designed specifically for baseball players is needed. The Kerlan-Jobe Orthopedic Clinic (KJOC) Overhead Athlete Shoulder and Elbow scale has been developed and applied in adolescent and professional baseball players.10,17 However, this scale assesses only physical disability and does not evaluate psychological, social, or other aspects. The FAST has recently been developed to evaluate the HRQOL in high-demand baseball players.8,24 This scale covers 5 domains—pain, throwing, ADL, psychological impact, and advancement—providing a more comprehensive assessment of baseball players’ status. In our study, pitchers and outfielders had higher FAST total scores and subscale scores in most domains than did infielders and catchers, thus indicating that pitchers and outfielders tended to have more physical disability and psychological impact. Repetitive pitching for pitchers and long-distance throwing for outfielders may be related to shoulder and elbow injuries, which may result in psychological impact on these adolescent baseball players. Furthermore, injury history played an important role in FAST total scores and subscale scores. In most regression models for FAST total scores and subscale scores, we observed that a more severe injury history was related to a higher coefficient value, thus demonstrating a dose-response relationship.
Our study showed that Taiwan adolescent baseball players had higher FAST total and subscale sores at the beginning and the end of the enrollment (the transition time of late summer and early autumn), which meant a lower HRQOL. The reason for this could be that most high-intensity student baseball tournaments in Taiwan are held during the summer. Players inevitably accumulated some injuries after experiencing several high-intensity matches, leading to higher FAST total and subscale scores. However, a previous study at the professional level reported that the highest injury rates were in April and May. 22 Dick et al 3 observed that injuries among NCAA baseball players were most prevalent during preseason practices. Although different peak periods for baseball injuries were noticed between adolescent and adult baseball players, in most cases these injuries could be attributed to deconditioning and overload.
Training hours per week and games per year did not affect the FAST total and subscale scores in this study. Likewise, the number of innings pitched per year was not related to the FAST pitcher module score. For training time per week, only 1 study 6 indicated that engaging in training for 7 consecutive days per week markedly raised the likelihood of radiographic abnormalities occurring in the elbow, whereas 3 studies15,26,30 did not support a relationship between training time and injuries. Regarding number of games per year, only Matsuura et al 15 found that playing >100 games per year significantly increased the risk of elbow pain, whereas 4 other studies13,19,27,30 did not prove this to be a risk factor for injuries. Whether innings pitched per year is a significant risk factor has been controversial according to previous studies.5,12,13,28 Therefore, the effect of training time and number of games on risk of injuries are both still equivocal in adolescent baseball players.
The strength of this study was its prospective longitudinal study design. In such designs, researchers can control the data collection process to ensure consistency and accuracy in measurements. Furthermore, changes in outcomes over time within the same individuals can be observed, providing insight into the natural history of year-round baseball. Another strength of our study was use of the FAST, which is an upper extremity region-specific and population-specific PRO scale to evaluate the HRQOL of baseball players that consists of not only physical but also psychological and social aspects. Compared with the KJOC scale, the FAST scale is a more comprehensive measurement of HRQOL for baseball players. Nevertheless, this study still had some limitations. First, these adolescent baseball players were recruited from school baseball teams with high competition performance. Therefore, any generalizations to other populations must be made with caution. Second, baseball positions were difficult to define in junior high school baseball players because their positions are not yet set. To perform statistical calculations, we asked baseball players to consider their most common fielding positions as their baseball positions. Third, response bias could exist because of unanticipated communication barriers between the investigator and respondents. Fourth, significant discrepancies in height, weight, and BMI among player groups could lead to potential bias in survey assessments. Fifth, training methods vary across different schools, which may lead to differences in injury risks and changes in HRQOL. Although we used several indicators, including training hours per week, games per year, and innings pitched per year, as covariates to observe whether they would affect FAST total and subscale scores, we did not observe significant impacts of these indicators on FAST total and subscale scores in our study. Future research should consider categorizing these training methods to investigate potential effects on injury risks and changes in HRQOL.
Conclusion
Our study demonstrated significant differences in most FAST total and subscale scores among player positions. Pitchers and outfielders exhibited higher FAST scores than the other positions, indicating more physical disability and psychological impact. Furthermore, the severity of throwing arm injury history significantly influenced FAST scores, with more severe injuries correlating with poorer outcomes. However, training volume did not significantly affect FAST scores. This data may help in future studies integrating PROs and HRQOL to evaluate athletes’ well-being beyond just physical parameters.
Footnotes
Appendix
Mixed Effects for Functional Arm Scale for Throwers Advancement Subscale Score a

| Effect | Estimate | P |
|---|---|---|
| Intercept | 11.70 ± 7.22 | .106 |
| Age | –0.32 ± 0.47 | .495 |
| Body mass index | –0.02 ± 0.19 | .915 |
| Training hours per week | 0.06 ± 0.09 | .515 |
| Games per year | –0.01 ± 0.05 | .903 |
| Injury history | ||
| Mild | 7.90 ± 1.41 | <.001 b |
| Moderate | 17.08 ± 3.37 | <.001 b |
| Severe | 18.68 ± 4.66 | <.001 b |
| Healthy | 0.00 | — |
| Position | ||
| Catcher | –4.48 ± 4.24 | .292 |
| Outfielder | 2.11 ± 2.76 | .446 |
| Pitcher | 3.01 ± 2.74 | .274 |
| Infielder | 0.00 | — |
| Months of follow-up | ||
| 3 | –9.17 ± 1.88 | <.001 b |
| 6 | –5.94 ± 2.25 | .009 d |
| 9 | –6.54 ± 2.64 | .014 c |
| 12 | –9.03 ± 2.81 | .002 d |
| 0 | 0.00 | — |
| Position × Months of follow-up | ||
| Catcher × 3 mo | 8.94 ± 4.04 | .028 c |
| Catcher × 6 mo | –1.64 ± 4.64 | .724 |
| Catcher × 9 mo | 8.15 ± 6.01 | 0.177 |
| Catcher × 12 mo | 6.16 ± 6.21 | .323 |
| Catcher × 0 mo | 0.00 | — |
| Outfielder × 3 mo | 2.26 ± 2.67 | .398 |
| Outfielder × 6 mo | –0.07 ± 3.13 | .982 |
| Outfielder × 9 mo | 1.99 ± 3.77 | .599 |
| Outfielder × 12 mo | 3.84 ± 3.93 | .330 |
| Outfielder × 0 mo | 0.00 | — |
| Pitcher × 3 mo | 3.80 ± 2.64 | .152 |
| Pitcher × 6 mo | –0.30 ± 3.13 | .923 |
| Pitcher × 9 mo | 0.19 ± 3.78 | .960 |
| Pitcher × 12 mo | 4.20 ± 3.89 | .282 |
| Pitcher × 0 mo | 0.00 | — |
Values are reported as mean ± SE.
P < .001.
P < .05.
P < .01.
Final revision submitted January 17, 2025; accepted February 20, 2025.
One or more of the authors has declared the following potential conflict of interest or source of funding: This work was supported by Chang Gung Memorial Hospital, Taiwan (CMRPG8M0411). The funders had no role in the design of the study, data collection, data analysis, interpretation of data, or writing the manuscript. AOSSM checks author disclosures against the Open Payments Database (OPD). AOSSM has not conducted an independent investigation on the OPD and disclaims any liability or responsibility relating thereto.
Ethical approval for this study was obtained from the Institutional Review Board of Chang Gung Memorial Hospital (No. 202002365B0).