
Abstract
Background:
An increased posterior tibial slope (PTS) has been shown to be a risk factor for anterior cruciate ligament (ACL) ruptures, but the difference in the mean PTS between patients with ACL ruptures and patients with intact ACLs is only approximately 1°, and the PTS has a wide range between 1° and 22°. Therefore, an ACL rupture may be associated with other morphological differences along with the PTS.
Purpose:
To evaluate whether the predictive value of the PTS can be increased with new parameters associated with the proximal tibia, distal femur, and extensor mechanism.
Study Design:
Cross-sectional study; Level of evidence, 3.
Methods:
This study included 81 patients who underwent surgical treatment for isolated ACL ruptures and 81 patients with intact ACLs as the control group.Lateral PTS (LPTS), medial PTS (MPTS), lateral femoral condylar offset, anterior patellar offset (APO), lateral tibial plateau offset, and tibial tubercle offset were measured on magnetic resonance imaging. The patella–lateral tibial plateau ratio (P-LTPR) was obtained by dividing the APO by the lateral tibial plateau offset, and the patella–tibial tubercle ratio (P-TTR) was obtained by dividing the APO by the tibial tubercle offset. Patients with ACL ruptures and intact ACLs were subdivided according to an LPTS ≥8° and an LPTS <8° and compared.
Results:
The parameters independently associated with ACL ruptures were P-LTPR (P = .001), P-TTR (P = .006), LPTS (P = .016), and MPTS (P = .047). In patients with intact ACLs and an LPTS ≥8°, P-LTPR was negatively correlated with LPTS and MPTS (P = .015 and P < .001, respectively; r = −0.736 and r = −0.758, respectively). In patients with an LPTS ≥8°, P-LTPR was associated with ACL ruptures, with 77.8% sensitivity and 73.7% specificity, at values >1.38, while P-TTR was associated with ACL ruptures, with 68.3% sensitivity and 67.7% specificity, at values >1.77. In patients with an LPTS <8°, P-TTR was associated with ACL ruptures, with 68.7% sensitivity and 77.2% specificity, at values >1.86.
Conclusion:
An evaluation of the P-LTPR and P-TTR parameters when assessing anatomic risk factors for an ACL rupture may increase the predictive information provided by the PTS. P-LTPR may be especially useful in re-evaluating the risk of ACL ruptures in patients who are considered to have a high risk because of a high PTS but an intact ACL, and P-TTR may be useful in re-evaluating the risk of ACL ruptures in patients who are considered to have a low risk because of a low PTS.
Keywords
Previous studies have demonstrated that an increased posterior tibial slope (PTS) is associated with increased anterior cruciate ligament (ACL) tension and ACL ruptures. 15 An increased PTS has been shown to increase the risk of reruptures after ACL reconstruction, and this risk is more pronounced in patients with a PTS ≥12°.5,14 Although it has been shown that the PTS is significantly higher in patients with ACL ruptures compared with patients with intact ACLs, the difference in the mean PTS between patients with ACL ruptures and patients with intact ACLs is only approximately 1°, and the PTS has a wide range from 1° to 22°. 15 In another study, it was demonstrated that the difference in the mean PTS between patients with ACL ruptures and patients with intact ACLs was 1.8°, the PTS ranged from 0° to 18.1°, and a PTS ≥8° was the cutoff value for ACL ruptures with 63.3% sensitivity and 62.5% specificity. 12 Weiler etal 15 investigated the PTS in 1000 patients with intact ACLs and 1000 patients with ACL ruptures and showed that the majority of patients with ACL ruptures were in the “normal” PTS range, and the difference between the groups was significant at both ends of the PTS spectrum. Pfeiffer etal 10 analyzed the relationship between ACL ruptures and the lateral femoral condyle ratio (LFCR) and found that an increased LFCR was associated with ACL ruptures, but there were no data on the PTS of the patients in their study. In patients without outlier PTS values, the predictive value of the PTS on ACL ruptures appears to be limited. New parameters related to the distal femur, proximal tibia, and extensor mechanism may increase the predictive value of the PTS on ACL ruptures.
There is no study in the literature that analyzes distal femoral anatomy, proximal tibial anatomy, and anatomy of the extensor mechanism of the knee together and, at the same time, also examines which parameters are associated with an ACL rupture independently of the other parameters. In this study, we defined new parameters derived from the distances of the most posterior points of the tibial plateau and the most anterior point of the tibial tubercle to the lateral tibial axis as well as the most posterior points of the femoral condyles and the most anterior point of the patella to the lateral femoral axis (LFA). The aim of this study was to investigate whether new parameters related to the proximal tibia, distal femur, and extensor mechanism in the sagittal plane increase the predictive value of the PTS on ACL ruptures. We hypothesized that the PTS may be more suggestive when evaluated together with new parameters related to the proximal tibia, distal femur, and extensor mechanism rather than alone.
Methods
After institutional ethics committee approval was obtained, the data of 153 patients who underwent arthroscopic knee surgery by a single senior surgeon at a tertiary academic medical center between January 2016 and January 2022 were retrospectively reviewed, and 81 patients who underwent primary ACL reconstruction for isolated ACL ruptures were included in the study. Physical examination, radiological, and intraoperative findings were compatible with isolated ACL ruptures. Exclusion criteria for the group of patients with ACL ruptures were as follows: meniscal injuries, ligament injuries other than of the ACL, previous lower extremity fractures, previous lower extremity surgery, degenerative arthritis (Kellgren-Lawrence grades 2-4), trochlear dysplasia, patellofemoral arthritis, a history of dislocations, age <18 years and >40 years, patients with pathological findings in the hip and ankle on a physical examination and pathological range of motion, neurological and rheumatological diseases, and patients whose imaging was not suitable for measurements. A total of 81 patients were selected as the control group to match the age and sex of the patients with ACL ruptures. All patients in the control group had pain owing to minor trauma (simple fall or overuse), their physical examination findings did not suggest any specific knee abnormality, and their magnetic resonance imaging (MRI) did not show any ligament or meniscal injury. The exclusion criteria of the control group were the same as those of the ACL rupture group: previous lower extremity fractures, previous lower extremity surgery, degenerative arthritis (Kellgren-Lawrence grades 2-4), age <18 years and >40 years, patients with pathological findings in the hip and ankle on a physical examination and pathological range of motion, and neurological and rheumatological diseases.
PTS measurements were made on MRI, as described by Hudek etal. 7 In the T1-weighted sequence on sagittal MRI, the slice in which the tibial attachment of the posterior cruciate ligament, the intercondylar eminence, and the anterior and posterior tibial cortices were seen concavely was determined (Figure 1). Next, 2 cranial and caudal circles tangent to the cortices were drawn. The center of the caudal circle was placed at the border of the cranial circle. The centers of the 2 circles were then combined to obtain the lateral tibial axis and fixed on the screen. The sagittal slice in which the lateral tibial axis was fixed was referred to the axial slice, and the sagittal slice was advanced to the slice in which the lateral tibial plateau was seen widest in the axial slice; the lateral PTS (LPTS) and lateral tibial plateau offset (LTPO) were measured on this slice (Figure 1). Then, the sagittal slice was advanced to the axial slice in which the medial tibial plateau was seen widest, and the medial PTS (MPTS) and medial tibial plateau offset (MTPO) were measured on this slice (Figure 2). Finally, the sagittal slice was advanced to the slice in which the tibial tubercle was seen most prominently in the axial slice, and the tibial tubercle offset (TTO), which is the distance of the tibial tubercle apex to the lateral tibial axis, was measured (Figure 2). The tibial tubercle–lateral tibial plateau ratio (TT-LTPR) parameter, which is the ratio of the TTO to the LTPO, was obtained. Similarly, the tibial tubercle–medial tibial plateau ratio (TT-MTPR) parameter was obtained by dividing the TTO by the MTPO.

Illustration of measurements in relation to the proximal tibia. (A) There were 2 circles drawn for the determination of the lateral tibial axis (LTA) in the proximal tibia. (B) The LTA was determined through the center of the circles. (C) The LTA was fixed on the screen, and the sagittal slice was advanced to the lateral plateau with reference to the coronal slice (shown in D). Subsequently, the lateral posterior tibial slope (LPTS) was measured between the tangent of the LTA and the surface of the lateral tibial plateau, while the lateral tibial plateau offset (LTPO) was quantified as the distance between the most posterior point of the lateral tibial plateau and the LTA.
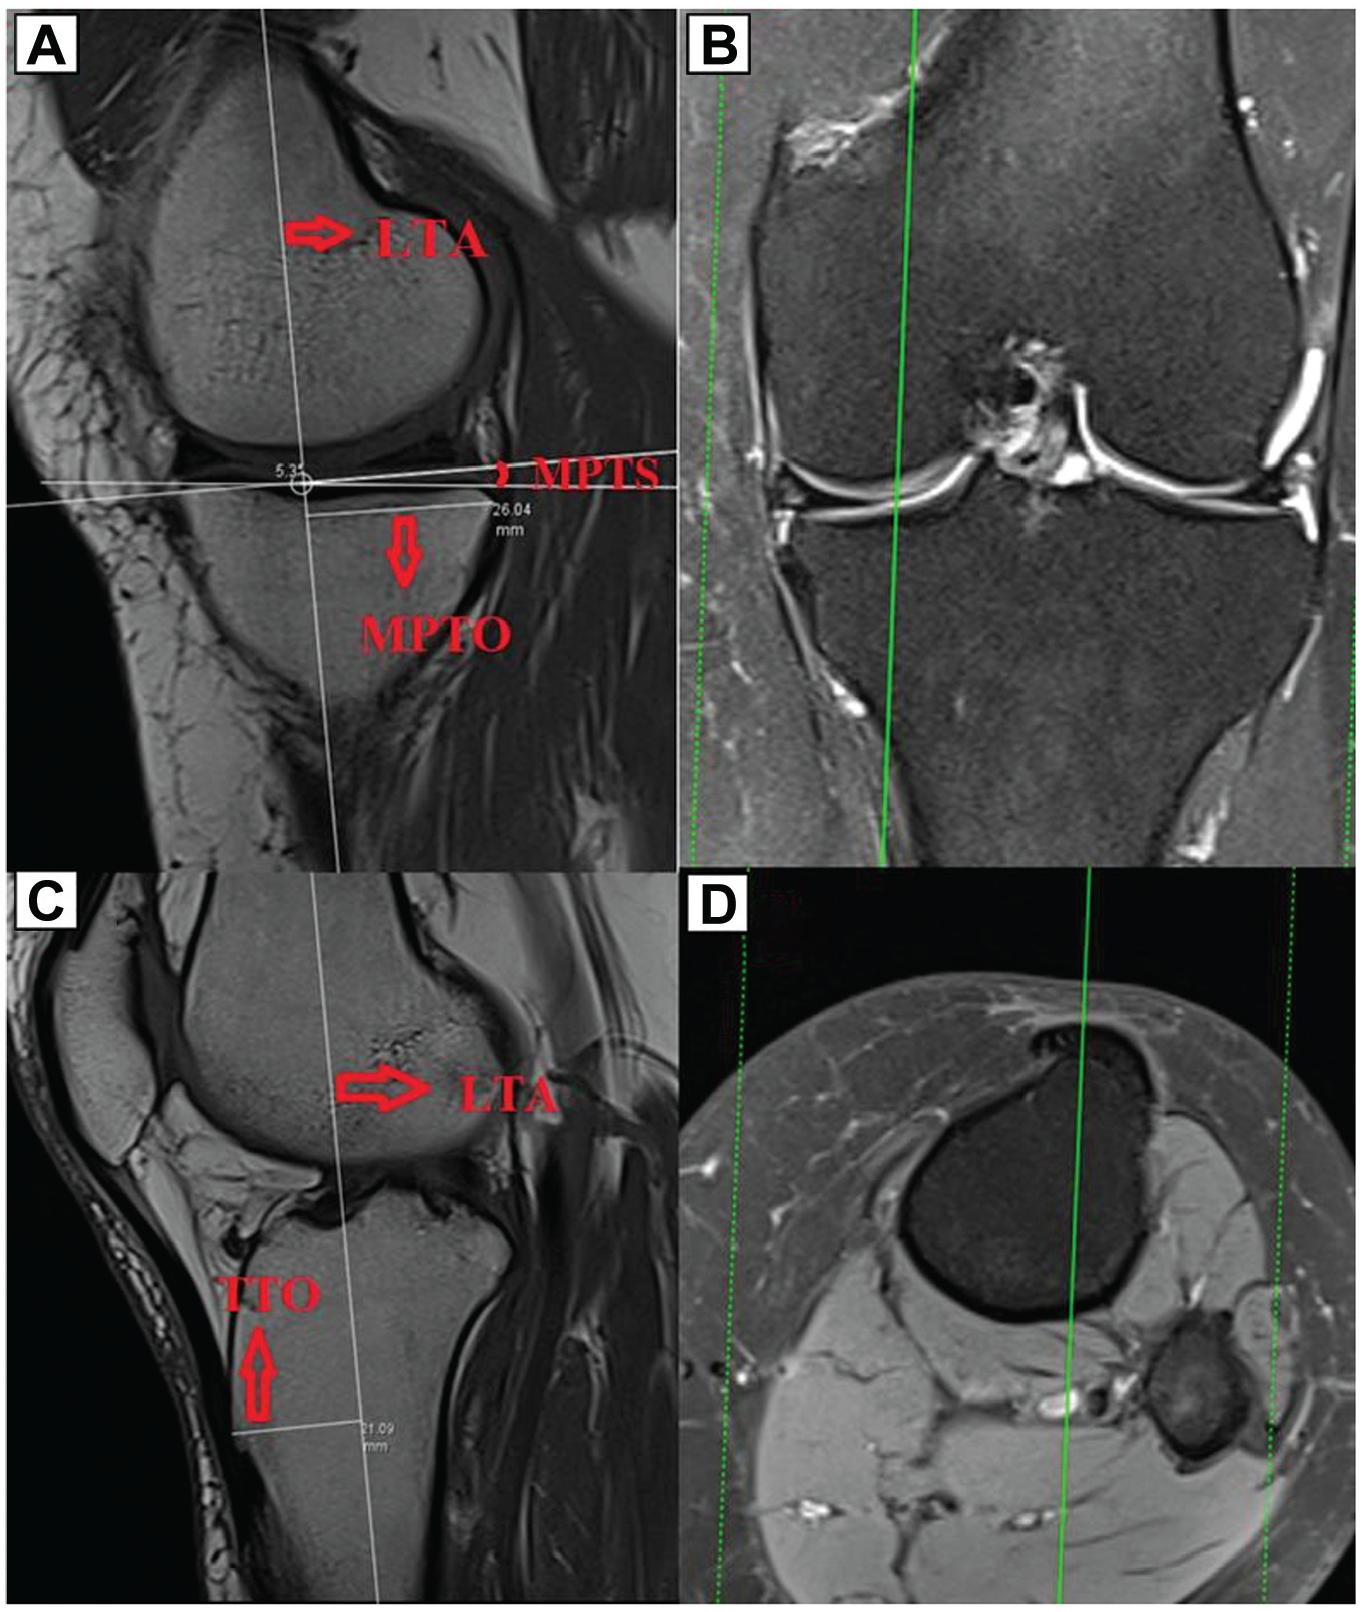
Illustration of measurements in relation to the proximal tibia. (A) The sagittal slice was advanced to the medial plateau in reference to the coronal slice (shown in B), after which the medial posterior tibial slope (MPTS), which is the angle between the tangent of the lateral tibial axis (LTA) and the surface of the medial plateau, was measured. The medial tibial plateau offset (MTPO), which is the distance between the most posterior point of the medial plateau and the LTA, was then measured. (C) The distance between the tibial tubercle and the LTA, designated as the tibial tubercle offset (TTO), was measured by advancing the sagittal slice to the slice in which the tibial tubercle was most prominent with reference to the axial slice (shown in D).
Distal femoral measurements were then performed. The LFA was determined on the sagittal slice, which was referred to the axial slice, and fixed on the screen (Figure 3).1,3 Then, the lateral femoral condylar offset (LFCO), which is the distance from the most posterior point of the lateral femoral condyle to the LFA, was measured on the sagittal slice, which was also referred to the coronal slice (Figure 3). The medial femoral condylar offset (MFCO), which is the distance from the most posterior point of the medial femoral condyle to the LFA, and the anterior patellar offset (APO), which is the distance from the most anterior point of the patella to the LFA, were measured on the sagittal slice, which was also referred to the coronal and axial slices, respectively (Figure 4). The patella–lateral femoral condyle ratio (P-LFCR) was obtained as the ratio of the APO to the LFCO, the patella–medial femoral condyle ratio (P-MFCR) was obtained as the ratio of the APO to the MFCO, the patella–tibial tubercle ratio (P-TTR) was obtained as the ratio of the APO to the TTO, the patella–lateral tibial plateau ratio (P-LTPR) was obtained as the ratio of the APO to the LTPO, and the patella–medial tibial plateau ratio (P-MTPR) was obtained as the ratio of the APO to the MTPO.
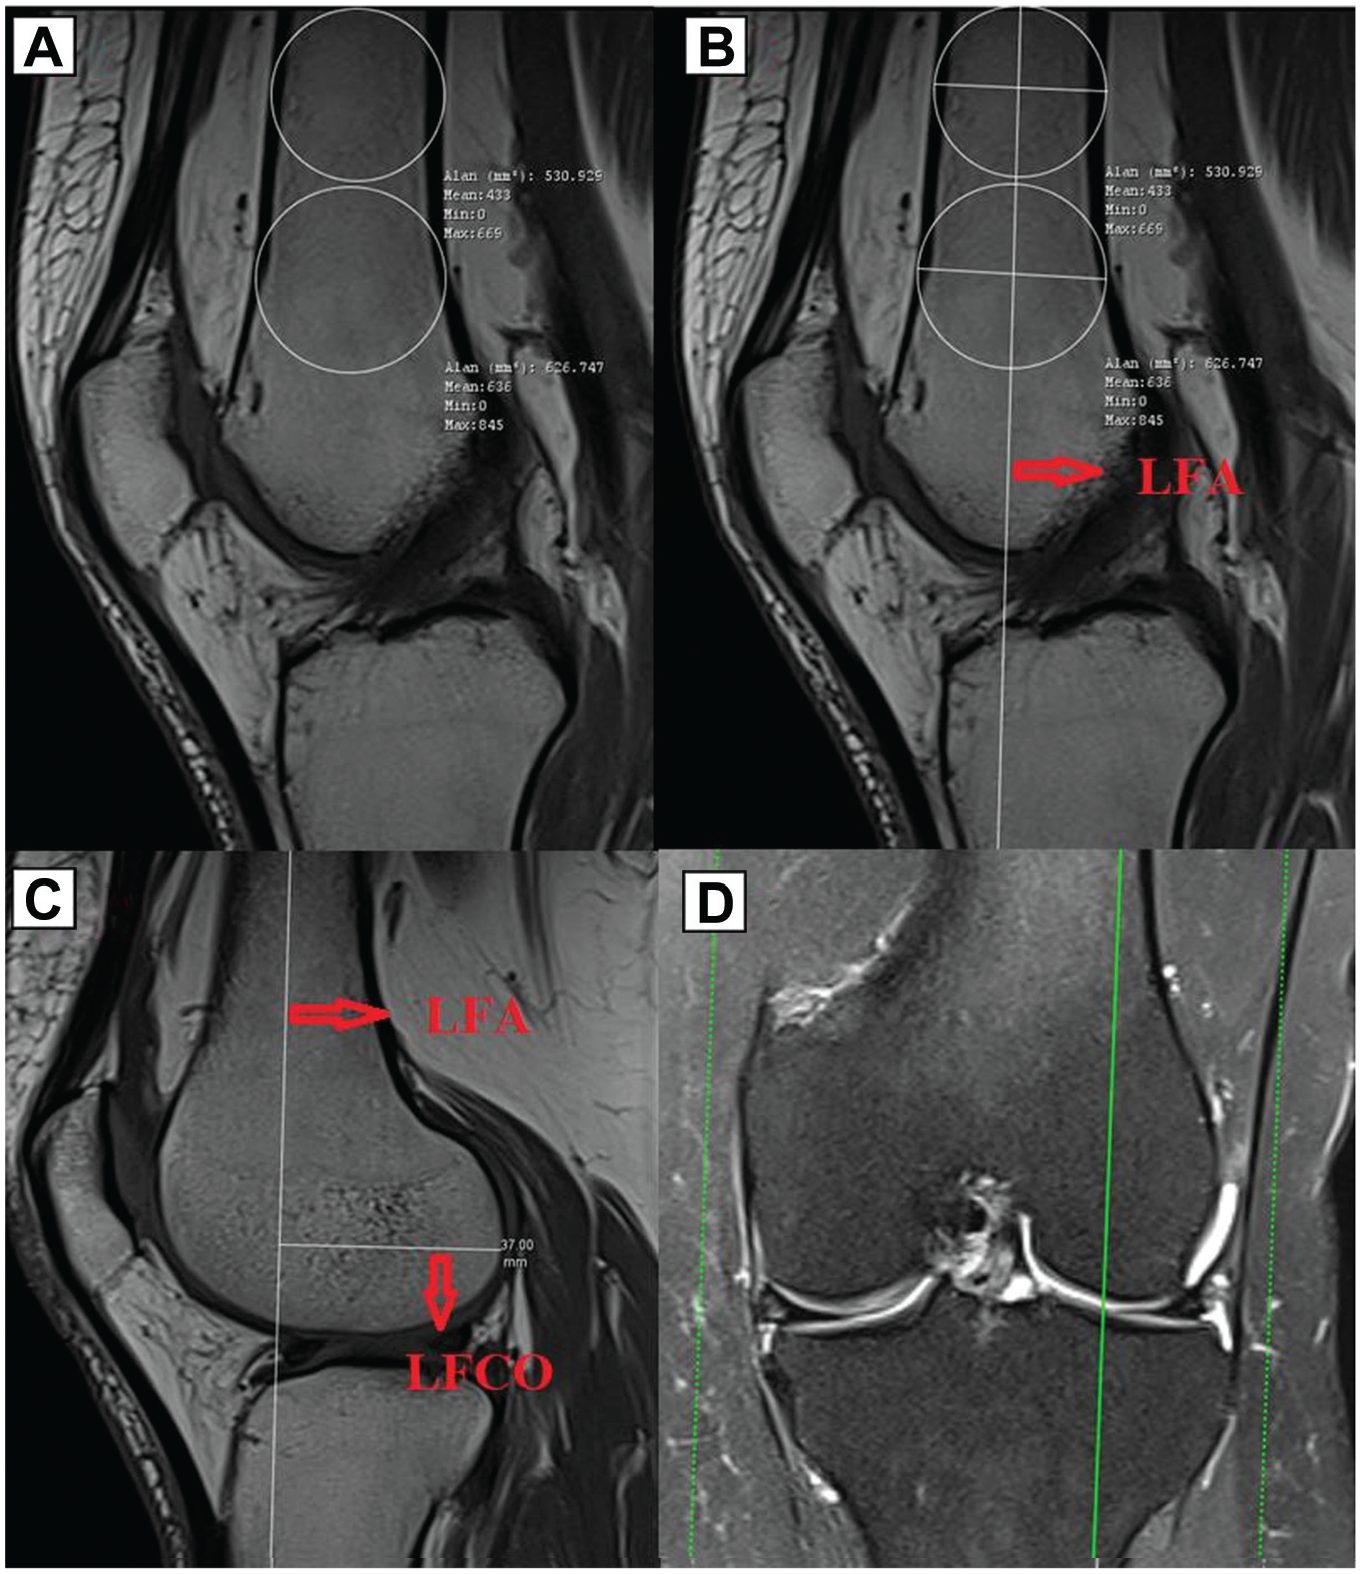
Illustration of measurements of the distal femur and patellofemoral complex. (A) There were 2 circles drawn in the distal femoral region to determine the lateral femoral axis (LFA). (B) The LFA was determined through the center of the circles. (C) After fixing the LFA on the screen, the sagittal slice was advanced to the lateral femoral condyle with reference to the coronal slice (shown in D), and then, the lateral femoral condylar offset (LFCO), which is the distance between the most posterior point of the lateral femoral condyle and the LFA, was measured.

Illustration of measurements of the distal femur and patellofemoral complex. (A) The sagittal slice was advanced to the medial femoral condyle with reference to the coronal slice (shown in B), and then, the medial femoral condylar offset (MFCO), which is the distance between the most posterior point of the medial femoral condyle and the lateral femoral axis (LFA), was measured. (C) The sagittal slice was advanced to the slice in which the patella was most prominent with reference to the axial slice (shown in D), and then, the anterior patellar offset (APO), which is the distance between the most anterior point of the patella and the LFA, was measured.
All measurements were performed by 2 senior surgeons, blinded to each other, in 2 separate sessions with an interval of 4 weeks. Intrarater and interrater reliability were analyzed by the intraclass correlation coefficient (ICC). The ICC was categorized as slight between 0.00 and 0.20, fair between 0.21 and 0.40, moderate between 0.41 and 0.60, good between 0.61 and 0.80, and excellent >0.80. 8
Data analysis was performed using SPSS software (Version 22.0; IBM). After ICC analysis, mean values, standard deviations, and 95% confidence intervals (CIs) were calculated by averaging the 4 measurements. Post hoc power calculation was carried out using G*Power software (Version 3.1.9.4; Heinrich Heine University Düsseldorf) with an alpha of .05 and a 2-tailed significance level. Skewness of the data was assessed by the Shapiro-Wilk test. The t test was used for the comparison of parametric independent variables, and the Mann-Whitney U test was used for the comparison of nonparametric independent variables. Pearson and Spearman correlation coefficients were used for correlation analyses. Receiver operating characteristic (ROC) analysis was performed to calculate the best diagnostic cutoff thresholds of the parameters. Calculations with P < .05 were considered significant. Logistic regression analysis was used to investigate whether the parameters were associated with an ACL rupture independently of other parameters. After all patients were separated into 2 subgroups of LPTS <8° and LPTS ≥8°, intragroup correlation analyses and ROC analyses were performed for the parameters.
Results
Interrater and intrarater reliability were good to excellent, with ICCs between 0.76 and 0.97 (observer 1: M.Ö.; observer 2: H.Y.) (Table 1).
ICCs for Radiological Parameters a

ACL, anterior cruciate ligament; APO, anterior patellar offset; ICC, intraclass correlation coefficient; LFCO, lateral femoral condylar offset; LPTS, lateral posterior tibial slope; LTPO, lateral tibial plateau offset; MFCO, medial femoral condylar offset; MPTS, medial posterior tibial slope; MTPO, medial tibial plateau offset; TTO, tibial tubercle offset.
The mean age of the ACL rupture group was 28.6 ± 6.6 years (range, 18-39 years), while the mean age of the control group was 29.3 ± 5.3 years (range, 18-38 years), with no significant difference between the groups (P = .681) (Table 2). There were 64 male and 17 female patients in each group (Table 2).
Patient Characteristics a

Data are shown as No. unless otherwise indicated. ACL, anterior cruciate ligament.
The LPTS and MPTS were significantly higher in the ACL rupture group than in the control group (P < .001 and P = .002, respectively) (Table 3). There was no significant difference between the groups in terms of the LTPO, MTPO, TTO, APO, LFCO, and MFCO (Table 3). When the groups were compared in terms of the P-LFCR, P-MFCR, P-TTR, and P-LTPR, these parameters were significantly higher in patients with ACL ruptures (P = .048, P = .016, P = .002, and P = .003, respectively) (Tables 3 and 4). When the groups were compared in terms of the P-MTPR, TT-MTPR, and TT-LTPR, there was no significant difference between them.
Measurements of Parameters a

Data are shown as mean ± SD (range). Boldface values indicate statistical significance. ACL, anterior cruciate ligament; APO, anterior patellar offset; LFCO, lateral femoral condylar offset; LPTS, lateral posterior tibial slope; LTPO, lateral tibial plateau offset; MFCO, medial femoral condylar offset; MPTS, medial posterior tibial slope; MTPO, medial tibial plateau offset; P-LFCR, patella–lateral femoral condyle ratio; P-LTPR, patella–lateral tibial plateau ratio; P-MFCR, patella–medial femoral condyle ratio; P-MTPR, patella–medial tibial plateau ratio; P-TTR, patella–tibial tubercle ratio; TT-LTPR, tibial tubercle–lateral tibial plateau ratio; TT-MTPR, tibial tubercle–medial tibial plateau ratio; TTO, tibial tubercle offset.
MDs Between Groups and Power Analysis Results of Statistically Significant Parameters a

LPTS, lateral posterior tibial slope; MD, mean difference; MPTS, medial posterior tibial slope; P-LFCR, patella–lateral femoral condyle ratio; P-LTPR, patella–lateral tibial plateau ratio; P-MFCR, patella–medial femoral condyle ratio; P-TTR, patella–tibial tubercle ratio.
On logistic regression analysis performed by using the statistically significant parameters, the parameters that were associated with an ACL rupture independently of other parameters were LPTS (odds ratio [OR], 1.44 [95% CI, 1.07-1.94]; P = .016), MPTS (OR, 1.81 [95% CI, 1.02-3.29]; P=.047), P-LTPR (OR, 4.04 [95% CI, 1.76-9.10]; P = .001), and P-TTR (OR, 4.07 [95% CI, 1.23-3.50]; P = .006). A 1° increase in the LPTS increased the risk of ACL ruptures by 1.44-fold, while a 1° increase in the MPTS increased the risk by 1.81-fold. A 0.1 increase in the P-LTPR increased the risk of ACL ruptures by 4.04-fold, while a 0.1 increase in the P-TTR increased the risk by 4.07-fold.
On ROC analysis for ACL ruptures, the cutoff value of the LPTS was 8° (65.6% sensitivity, 63.3% specificity, likelihood ratio of 2.11), the cutoff value of the MPTS was 9.5° (71.9% sensitivity, 63.3% specificity, likelihood ratio of 2.26), the cutoff value of the P-LTPR was 1.45 (69.1% sensitivity, 66.1% specificity, likelihood ratio of 2.30), and the cutoff value of the P-TTR was 1.75 (71.9% sensitivity, 70.0% specificity, likelihood ratio of 2.49) (Figure 5).
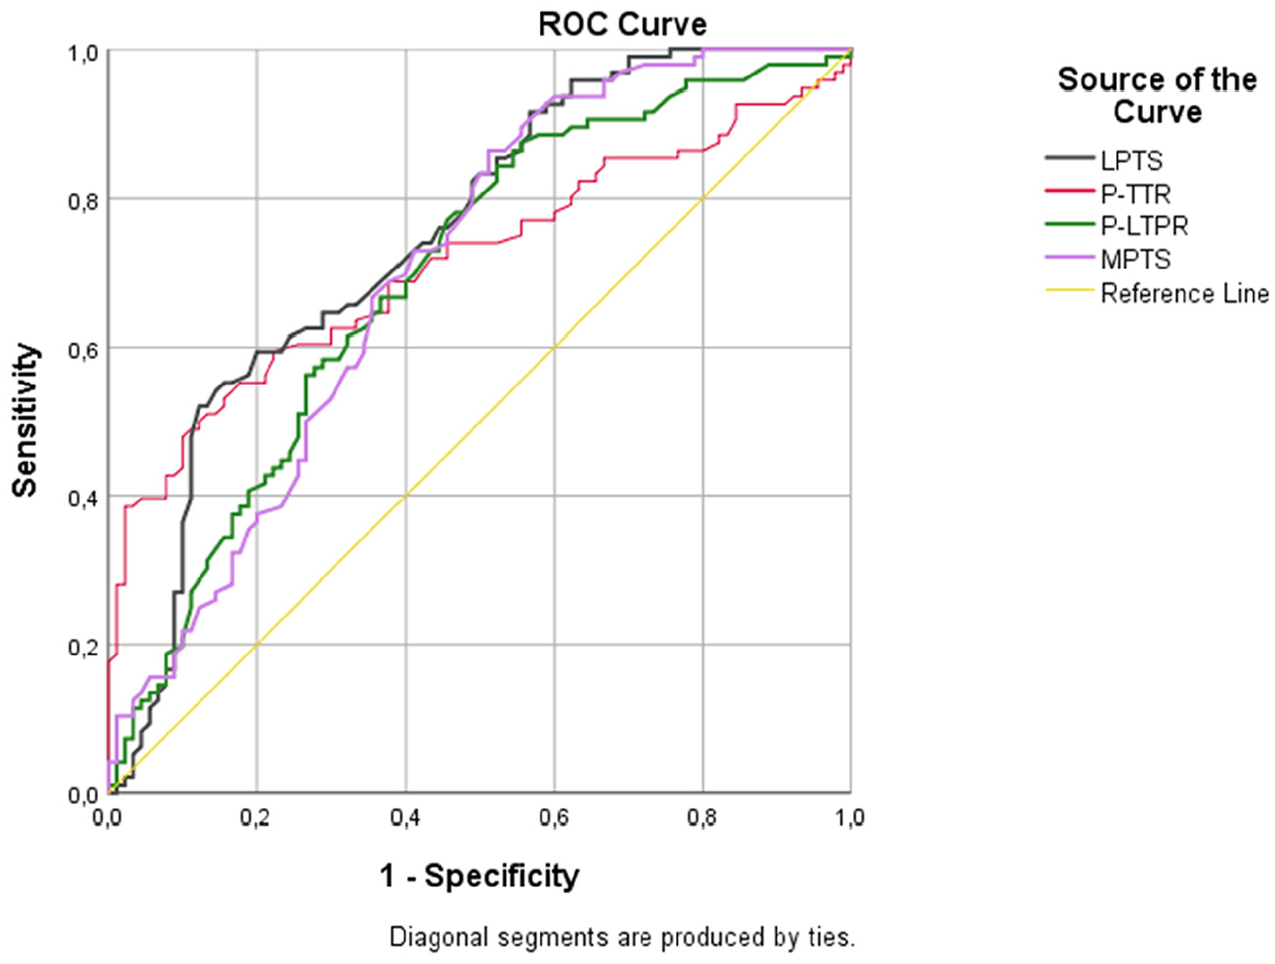
Receiver operating characteristic (ROC) curves of lateral posterior tibial slope (LPTS; area under the curve [AUC], 0.754 [95% CI, 0.631-0.877]), medial posterior tibial slope (MPTS; AUC, 0.712 [95% CI, 0.581-0.844]), patella–tibial tubercle ratio (P-TTR; AUC, 0.724 [95% CI, 0.595-0.853]), and patella–lateral tibial plateau ratio (P-LTPR; AUC, 0.714 [95% CI, 0.582-0.845]) parameters.
When all patients included in the study were divided into 2 subgroups of an LPTS <8° and an LPTS ≥8°, there were 79 patients with an LPTS <8° (28 patients with ACL ruptures, 51 patients with intact ACLs) and 83 patients with an LPTS ≥8° (53 patients with ACL ruptures, 30 patients with intact ACLs). On correlation analysis performed at this stage, there was a significant negative correlation between P-LTPR and LPTS in the subgroup of patients with an LPTS ≥8° and intact ACLs (P = .015; r= −0.736); there was also a significant negative correlation between P-LTPR and MPTS in this subgroup (P < .001; r = −0.758). In patients with an LPTS ≥8° and ACL ruptures, there was no correlation of P-LTPR and P-TTR with other parameters. On ROC analysis performed in patients with an LPTS ≥8°, an increased P-LTPR showed a predictive effect, with 77.8% sensitivity and 73.7% specificity (likelihood ratio: 2.95), at a cutoff value of 1.38, and an increased P-TTR showed a predictive effect, with 68.3% sensitivity and 67.7% specificity (likelihood ratio: 2.11), at a cutoff value of 1.77 (Figure 6). Of the 30 patients with an LPTS ≥8° and intact ACLs, 24 (80.0%) had a P-LTPR value <1.38, and 22 (73.3%) had a P-TTR value <1.77.

Receiver operating characteristic (ROC) curves of lateral posterior tibial slope (LPTS; area under the curve [AUC], 0.689 [95% CI, 0.561-0.817]), medial posterior tibial slope (MPTS; AUC, 0.521 [95% CI, 0.395-0.658]), patella–tibial tubercle ratio (P-TTR; AUC, 0.703 [95% CI, 0.599-0.807]), and patella–lateral tibial plateau ratio (P-LTPR; AUC, 0.801 [95% CI, 0.711-0.892]) parameters in patients with an LPTS ≥8°.
In the subgroup of patients with an LPTS <8° and ACL ruptures, there was a significant negative correlation only between P-TTR and LPTS (P = .021; r = −0.586). P-TTR predicted ACL ruptures in patients with an LPTS <8°, with a sensitivity of 68.7% and a specificity of 77.2%, at values >1.86. In this subgroup of patients (ie, patients with LPTS <8°), an increased P-TTR versus a low LPTS seemed to have an effect on ACL ruptures (Figure 7). In 22 (78.5%) of the 28 patients with an LPTS <8° and ACL ruptures, the P-TTR value was >1.86.

Receiver operating characteristic (ROC) curves of lateral posterior tibial slope (LPTS; area under the curve [AUC], 0.760 [95% CI, 0.663-0.856]), medial posterior tibial slope (MPTS; AUC, 0.810 [95% CI, 0.723-0.897]), patella–tibial tubercle ratio (P-TTR; AUC, 0.744 [95% CI, 0.618-0.870]), and patella–lateral tibial plateau ratio (P-LTPR; AUC, 0.654 [95% CI, 0.541-0.767]) parameters in patients with an LPTS <8°.
Discussion
The most important finding of this study is that the PTS, which has been shown to be predictive for ACL ruptures but has a wide range of values and demonstrates small differences between patients with ACL ruptures and patients with intact ACLs, provided better information about the risk of ACL ruptures when evaluated together with the P-LTPR and P-TTR, which are new parameters involving the extensor mechanism of the knee and lateral tibial plateau. The strong negative correlation of the LPTS and MPTS with the P-LTPR in patients with an LPTS ≥8° and intact ACLs may indicate that a low P-LTPR compensates for the risk of ACL ruptures caused by an increased PTS. The moderate negative correlation between the LPTS and P-TTR in patients with an LPTS <8° and ACL ruptures may indicate that although this subgroup does not have an increased risk of a LPTS, the risk of ACL ruptures may increase because of the extensor mechanism of the knee.
Micicoi etal 9 showed that the precise definition of femoral and tibial anatomic risk factors for an ACL rupture is difficult; 15% to 62% of the healthy reference population possess anatomic risk factors according to the threshold values reported in the literature. They added that risk factors may be misleading because these rates are very high. 9 Weiler etal 15 showed, in their study of 2000 patients, that most of the ACL ruptures occurred in the “normal” PTS range, and the difference between the groups was significant at both ends of the distribution. In their study, approximately one-third of patients with ACL ruptures and one-fifth of patients with intact ACLs had a PTS ≥12°; approximately one-third of patients with ACL ruptures and two-fifths of patients with intact ACLs had a PTS <8°. 15 Rahnemai-Azar etal 11 showed that an increased LPTS was associated with ACL ruptures, independent of other factors in their study, in high-level male football players. Christensen etal 2 demonstrated that an increased LPTS was associated with early graft failure in patients undergoing ACL reconstruction. Stijak etal 13 showed that an ACL rupture was associated with a LPTS, without a significant difference in the PTS and MPTS.
Hodel etal 6 demonstrated a relationship between a decreased lateral femoral condyle index and ACL ruptures. Pfeiffer etal 10 showed that an increased posterior femoral condyle depth (which may indicate that the lateral femoral condyle is less spherical) was associated with ACL ruptures. Güven etal 4 investigated the relationship between the Insall-Salvati index and ACL ruptures and showed that the risk of ACL ruptures increased in patients with a higher Insall-Salvati index, but there were no data on the PTS in their study. In line with these findings in the literature, we aimed to investigate the anatomic factors that may provide predictive information on patients with a high or low risk for the PTS (patients with a high PTS but intact ACLs, patients with a low PTS but ACL ruptures) by taking new measurements including the proximal tibia, distal femur, and extensor mechanism.
In our study, there was a significant negative correlation between LPTS and P-LTPR in patients with a PTS ≥8° and intact ACLs, and in this subgroup of patients with an increased risk for an LPTS, P-LTPR values >1.38 predicted ACL ruptures with 77.8% sensitivity and 73.7% specificity, while P-TTR values >1.77 predicted ACL ruptures with 68.3% sensitivity and 67.7% specificity. On the other hand, P-LTPR and P-TTR values were lower than the determined cutoff values in the majority of patients with an LPTS ≥8° and intact ACLs. Furthermore, in patients with an LPTS <8°, P-TTR predicted ACL ruptures, with 68.7% sensitivity and 77.2% specificity, at values >1.86. In this study, we tried to utilize not only the statistical difference of the measurement related to an anatomic structure but also the ratio of the parameters to each other and the relationships of these ratios with other parameters because they are biomechanically related to each other. The results obtained in this study showed that the PTS will continue to be a strong parameter in ACL ruptures, but it may be useful to evaluate other anatomic structures together with the PTS.
We classified patients into 2 subgroups based on an LPTS <8° and LPTS ≥8° because of the relationship of the LPTS with ACL ruptures in the literature and because the cutoff value of the LPTS was 8° in our study. The strong negative correlation of the P-LTPR with the LPTS and MPTS in patients with an LPTS ≥8° and intact ACLs (r = −0.736 and r = −0.758, respectively) suggests that a low P-LTPR may compensate for the predictive effect of an increased PTS on ACL ruptures. This compensation may be caused by a lower APO leading to a more superiorly oriented patellar tendon, reducing its anterior vector and thus diminishing anterior tibial translation. The increased LTPO needed for a low P-LTPR might better suit the lateral femoral condyle’s spherical structure. In contrast, a low LTPO may cause the lateral tibial plateau’s posterior corner to move anteriorly past the lateral femoral condyle, resulting in less anterior tibial translation and contributing to ACL ruptures and the subsequent lateral femoral notch sign.
In our study, the P-LTPR showed higher sensitivity and specificity than the LPTS and MPTS for ACL ruptures in patients with an LPTS ≥8°, indicating that the P-LTPR may provide stronger predictive information about the risk of ACL ruptures in this patient subgroup.On the other hand, the P-LTPR may have the potential to provide information about the risk of reruptures and the necessity of slope-reducing osteotomy in patients who have undergone ACL reconstruction. Regarding this issue, the measurement of the P-LTPR in patients with a high PTS and the evaluation of how much the P-LTPR compensates for an increased PTS may help surgeons to make decisions about slope-reducing osteotomy. However, further studies evaluating these parameters in patients with ACL reruptures and in patients with a high PTS but no reruptures are required.
In patients with an LPTS <8° and ACL ruptures, the negative correlation between LPTS and P-TTR (r = −0.586) indicated that a high P-TTR was associated with a low PTS. A high P-TTR meant an increased APO, decreased TTO, or both. An increased APO means that the superior vector of patellar tendon force is decreased, while the anterior vector, which has an effect on anterior tibial translation, is increased; by the same logic, a decreased TTO moves the point of force exerted by the patellar tendon on the tibia posteriorly, and the anterior vector of patellar tendon force may be increased. In patients with an LPTS <8°, while the force due to the PTS decreases among the forces acting on anterior tibial translation, the anterior vector of patellar tendon force increases because of an increased P-TTR, which may constitute a risk factor for ACL ruptures. In our study, we did not measure the angle between the patellar tendon and other anatomic structures because we thought that it would be affected by ligament injuries and knee position. All other measurements except the APO were made on a single bone, and we thought that the APO would not be affected in a knee in full extension.
The risk of ACL ruptures is multifactorial, and it does not seem possible to explain all of this risk with anatomic factors. However, a good analysis of anatomic risk factors may provide information about the risk of ruptures or the need for osteotomy and may provide data on secondary anatomic risk factors for patients who are considered to have a low risk because of a low PTS.
Limitations
This study had some limitations. The first one is that the study was retrospective, and therefore, causality could not be determined. Another limitation is that the number of patients was small, and the groups were divided into subgroups; many comparisons were made, and some comparisons may occur by chance. Another limitation is that the body mass index and sport activity levels of the patients were unknown.
Conclusion
When investigating anatomic factors related to an ACL rupture, the evaluation of P-LTPR and P-TTR parameters related to the extensor mechanism of the knee and lateral tibial plateau may increase the predictive information provided by the PTS. P-LTPR may be especially useful in re-evaluating the risk of ACL ruptures in patients who are considered to have a high risk because of a high PTS but intact ACLs, and P-TTR may be useful in re-evaluating the risk of ACL ruptures in patients who are considered to have a low risk because of a low PTS. A 1° increase in the LPTS increased the risk of ACL ruptures by 1.44 times, a 1° increase in the MPTS by 1.81 times, a 0.1 increase in the P-LTPR by 4.04 times, and a 0.1 increase in the P-TTR by 4.07 times. These parameters may be suggestive about whether PTS-reducing procedures should be applied in ACL revision cases, but further studies are needed.
Footnotes
Final revision submitted January 4, 2025; accepted January 27, 2025.
The authors have declared that there are no conflicts of interest in the authorship and publication of this contribution. AOSSM checks author disclosures against the Open Payments Database (OPD). AOSSM has not conducted an independent investigation on the OPD and disclaims any liability or responsibility relating thereto.
Ethical approval for this study was obtained from Necmettin Erbakan University (196).