
Abstract
Background:
The factors contributing to osteoarthritis progression after anterior cruciate ligament (ACL) injury and reconstruction (ACLR) are not fully understood. Quantitative magnetic resonance imaging (MRI) offers a noninvasive way to evaluate cartilage biochemical composition using T1ρ mapping, thereby detecting early cartilage degeneration. The specific impact of preoperative quantitative MRI on long-term outcomes after ACLR remains underreported.
Purpose/Hypothesis:
The purpose of this study was to investigate the effects of various factors, including preoperative cartilage T1ρ values, on the 10-year outcomes after ACLR. It was hypothesized that individual differences in baseline cartilage degeneration would influence osteoarthritis progression at 10 years postoperatively.
Study Design:
Case series; Level of evidence, 4.
Methods:
This case series involved 13 patients with primary ACL injury who underwent anatomical double-bundle ACLR using hamstring tendon autograft between April 2012 and August 2013. All patients underwent preoperative quantitative MRI using a 3.0-T scanner with an 8-channel knee coil. Cartilage was divided into 18 compartments for compositional analysis, and average T1ρ values were calculated for each compartment. At the 10-year follow-up, 9 of the patients were available for patient-reported outcome (PRO) measures and radiographs.
Results:
The 9 patients (6 female, 3 male) had a mean age of 26.4 years and a mean body mass index of 23.3 at surgery. All patients exhibited favorable PRO scores at the 10-year follow-up, but 5 patients showed osteoarthritis progression according to Kellgren-Lawrence (KL) grade. Although preoperative T1ρ values did not significantly correlate with PRO scores, patients with KL grade progression had significantly higher preoperative T1ρ values in the posterolateral tibial cartilage than those without progression (P = .04).
Conclusion:
Ten years after anatomical double-bundle ACLR, most patients reported favorable outcomes. Preoperative T1ρ values were not directly correlated with PROs, although the presence of a patient subset with progressive KL grades suggests that preoperative posterolateral tibial cartilage condition may influence long-term osteoarthritis progression.
Keywords
After anterior cruciate ligament (ACL) injury, approximately 35% of patients will develop symptomatic posttraumatic osteoarthritis 10 years after the initial injury.17,24 ACL reconstruction (ACLR) is known to produce good short-term results; however, posttraumatic osteoarthritis can occur at medium- to long-term follow-up.1,7,26 Evaluating mid- to long-term outcomes is critical when assessing ACLR, and the occurrence of postoperative posttraumatic osteoarthritis can be reduced if the various factors influencing the outcome can be identified and targeted for intervention.
Magnetic resonance imaging (MRI) is often used to evaluate the knee joint, and conventional MRI has primarily been used to detect morphological changes in cartilage, such as cracking, peeling, and thinning of the cartilage surface.8,29 However, advances in MRI have made it possible to detect even the biochemical composition of tissues using quantitative MRI techniques such as T1ρ and T2 mapping.21,22 The T1ρ relaxation time has been found to correlate with proteoglycan content, and T2 relaxation time correlates with tissue collagen structure.21,22,31
The first studies using T1ρ and T2 mapping on ACL-reconstructed knees were published in 2011.23,38 Subsequently, T1ρ and T2 values for knees after ACLR have been reported from various points of view. ‖ From these reports, the use of quantitative MRI evaluation with T1ρ and T2 mapping is expected to be able to predict long-term knee outcomes after ACLR and has attracted much attention as a useful tool for very early postoperative evaluation.
Of the patient factors affecting outcomes after ACLR, older age and a preoperative waiting period of >1 year are cited as risk factors for future osteoarthritis. 13 Patient sex, smoking status, and concomitant articular cartilage or meniscal injuries are also associated with posttraumatic osteoarthritis. 14 Only a few reports on the relationship between preoperative quantitative MRI findings of cartilage degeneration and postoperative outcomes of ACLR have been published.12,23,36,37 Furthermore, only the short-term results of ACLR have been reported; to our knowledge, no reports on the effect of preoperative quantitative MRI findings of knee cartilage on the long-term results of ACLR exist.
The purpose of this study was to investigate the influence of various factors, including preoperative cartilage T1ρ values, surgical procedures, and functional and activity levels, on the 10-year outcomes after ACLR. We hypothesized that individual differences in baseline cartilage degeneration would influence osteoarthritis progression at 10 years postoperatively.
Methods
This was a follow-up study of a previous prospective single-hospital study. 31 The protocol for the current study received institutional review board approval, and all patients provided written informed consent before participating. All enrollments, examinations, data collection, and analyses were performed at a single institution, and all data were collected between October 2022 and September 2023. Enrolled were 13 patients diagnosed with primary ACL injury who underwent quantitative MRI scans a few days before ACLR, which occurred from April 2012 to August 2013. All patients underwent the same method of anatomical double-bundle ACLR with hamstring autograft. Patients who could not be contacted or who could not attend the 10-year follow-up visit were excluded from the study. Patients with multiple ligamentous injuries were also excluded.
Data Collection
Age at surgery, sex, weight, body mass index (BMI), preoperative Tegner activity score, and preoperative time from injury to surgery (months) were extracted from the medical records. The bone tunnel positions were measured using 3-dimensional (3D) computed tomography within 1 week after surgery. Femoral tunnel positions were measured using the quadrant method, and tibial tunnel positions were measured in a grid aligned with the medial-to-lateral and anterior-to-posterior anatomical tibial axes.10,18
Surgical Procedure and Postoperative Rehabilitation
All surgical procedures were conducted by a single knee surgeon (T. Sasho), who had >20 years of experience, either as a primary surgeon or as a supervisor. Anteromedial and anterolateral portals were created and a conventional arthroscopic examination was performed. If the meniscus was injured and unstable during probing, it was sutured when the surgeon determined that healing was expected or partially resected when suturing was not possible. The surgeon harvested the hamstring tendon autografts and prepared 2 double-stranded grafts. The anteromedial and posterolateral tunnels were created using the outside-in technique. EndoButton CLs (Smith & Nephew) were used for femoral graft fixation, whereas 2 staples (Smith & Nephew) were used for tibial graft fixation. During graft fixation, both grafts were fixed at 20° of knee flexion with 40 N of tension. The meniscus was sutured using an all-inside device (FastFix; Smith & Nephew) if the tear was unstable on probing and healing was expected, or partially resected if healing was not expected. Surgical details were extracted from the surgical records.
Active and assisted range-of-motion exercises were initiated immediately after the surgery. Partial weightbearing was allowed 2 weeks after surgery, and full weightbearing commenced 4 weeks after surgery. Running was allowed at 3 or 4 months, depending on muscle strength, and a return to previous sports was allowed ≥10 months from surgery.
Preoperative MRI Acquisition
All preoperative imaging examinations were conducted using a 3.0-T scanner (Discovery MR750 MR System; GE HealthCare Japan Corporation) with an 8-channel knee coil. T1ρ was performed with the Research Pack 3.0 from GE (GE Healthcare Japan Corp), which was distributed to several academic institutions for research purposes. Before processing the T1ρ maps, 3D MERGE (multiple echo recombined gradient-echo), 3D SPGR (spoiled gradient-echo), and 3D Cube were acquired to create precise cartilage mask images. 31
The imaging parameters for T1ρ acquisition were nearly identical to those reported by Souza et al. 35 Each sequence for the acquisition was as follows:
Sagittal 3D MERGE images: Repetition time/echo time (TR/TE) = 30/13.0 ms, flip angle = 5°, bandwidth = 50 kHz/pixel, echo train length = 3, field of view = 15 cm, slice thickness = 3.0 mm, and matrix = 320 × 320; the acquisition time was 4 minutes and 53 seconds.
Sagittal 3D SPGR images: TR/TE = 15.1/4.1 ms, flip angle = 20°, bandwidth = 31.2 kHz/pixel, field of view = 15 cm, slice thickness = 3 mm, and matrix = 512 × 512; the acquisition time was 2 minutes and 4 seconds.
Sagittal 3D Cube images: TR/TE = 1500/18.1 ms, flip angle = 90°, bandwidth = 62.5 kHz/pixel, echo train length = 50, field of view = 15 cm, slice thickness = 3 mm, and matrix = 320 × 320; the acquisition time was 2 minutes and 59 seconds.
T1ρ acquisition (T1ρ relaxation times obtained using a sagittal 3D fast spin-echo Cube sequences): TR/TE = 9/2.6 ms, time of recovery = 1500 ms, field of view = 15 cm, matrix = 320 × 320, slice thickness = 3 mm, bandwidth = 62.5 kHz, time of spin-lock (TSL) = 1/10/30/60/80 ms, and frequency of spin-lock = 500 Hz. The acquisition time was 10 minutes.
Cartilage Compartment Analysis
The cartilage was divided into 18 compartments: concerning the meniscus, the lateral femoral condyle (LFC) and medial femoral condyle (MFC) were divided into 5 compartments, and the lateral tibial plateau (LTP) and medial tibial plateau (MTP) were divided into 3 compartments. 23 The patella and trochlea were also defined (Figure 1).

Cartilage segmentation with T1ρ color maps on the lateral and patellofemoral compartments. The lateral femoral condyle (LFC) and lateral tibial plateau (LTP) of the meniscus were divided into 5 and 3 segments, respectively. The medial femoral condyle and tibial plateau were similarly divided. PAT, patella; TRO, trochlea.
Each compartment was manually segmented as the region of interest, and the mean T1ρ values in each of the 18 compartments were calculated using in-house software developed with MATLAB Version R2020a (MathWorks). 34 The color map image was checked and manually adjusted so that the surrounding water was not included in the segmentation. T1ρ values obtained for different TSLs were fitted pixel-by-pixel to the following equation: S(TSL) ∝ exp (TSL/T1ρ). We performed our primary analyses on the cartilage compartments MTP3, LTP3, MFC2, and LFC2, which are early-impact sites of clinical significance as sites of preoperative cartilage degeneration. 20 Other compartments were analyzed on an exploratory basis.
Follow-up Assessment
At the 10-year follow-up, patients underwent manual examinations, such as the Lachman test and pivot-shift test, side-to-side difference in anterior laxity measured using the KS Measure (a cruciate ligament function tester; KS Measure KSM-100; Nippon Sigmax Co Ltd), 25 a single-leg sit-to-stand (SL-STS) functional test,2,39 patient-reported outcome (PRO) questionnaires, and radiographs. The SL-STS outcome was defined as good when the patient could stand up from a sitting height of 30 cm and inadequate when the patient could not. Any additional postoperative surgeries undergone during the 10 years were also investigated.
PRO measures included the Knee injury and Osteoarthritis Outcome Score (KOOS), Lysholm score, Forgotten Joint Score–12 (FJS-12), ACL–Return to Sport after Injury (ACL-RSI) score, and postoperative Tegner score. Radiographs were obtained in the anteroposterior standing and lateral views of the affected side. The posterior tibial slope, medial proximal tibial angle (MPTA), and femoral tibial angle were measured on the 10-year postoperative radiographs.
The Kellgren-Lawrence (KL) grade for each knee on both the preoperative and the 10-year postoperative radiographs was determined by 2 orthopaedic surgeons (S.W. and T. Sakamoto). According to the KL grade, patients were divided into 2 groups: KL progression and no progression. We defined “progression” as a worsening of the KL grade from preoperatively to 10 years postoperatively.
Statistical Analysis
Differences between the KL progression and no-progression groups were compared using the 2-sided Welch t test. Areas compared included preoperative T1ρ values for each cartilage region and postoperative PRO scores. A 2-sided Welch t test was used also to compare the postoperative PRO scores between patients with versus without a lower postoperative Tegner score, those with versus without meniscectomy, and those with good versus inadequate SL-STS status. Finally, the 2-sided Welch t test was used to compare the preoperative T1ρ value for each cartilage region between patients with versus without a preoperative KL grade of ≥1.
A Spearman correlation analysis was conducted to investigate the association between postoperative PRO scores and preoperative T1ρ values, age, preoperative waiting period, BMI, and bone geometry (including MPTA and posterior tibial slope). The association between preoperative T1ρ values for each cartilage compartment and age, preoperative waiting period, BMI, and bone geometry was also investigated using the Spearman correlation coefficient.
Statistical significance was set at P < .05. All statistical analyses were performed using Stata Version 18 software (StataCorp).
Results
Study Patients
Three patients did not respond to our recruitment drive, and 1 patient was excluded because that patient underwent lateral collateral ligament reconstruction at the same time as the ACL surgery. Ultimately, 9 patients returned for examinations, PROs, and radiography at the 10-year follow-up and were included for analysis in this study. The mean age at surgery for the study patients (6 female and 3 male) was 26.4 ± 10.8 years, the mean BMI was 23.3 ± 2.9, and the mean preoperative Tegner score was 5.9. Preoperatively, 4 patients had a KL grade of 0, 4 patients had a KL grade of 1, and 1 patient had a KL grade of 2. Partial medial meniscectomy was performed in 3 patients (Table 1). The follow-up period was 117.7 ± 6.0 months.
Patient Data Before Surgery a

BMI, body mass index; F, female; KL, Kellgren-Lawrence; L, left; M, male; MM, medial meniscus; Preop, preoperative; R, right.
The femoral bone tunnel positions were 32.7% ± 4.4% for the anteromedial bundle and 55.9% ± 10.2% for the posterolateral bundle at height, and 24.8% ± 3.7% for the anteromedial bundle and 33.8% ± 6.6% for the posterolateral bundle at depth. The tibial tunnel positions were 48% ± 8.6% for the anteromedial bundle and 64.6% ± 8.1% for the posterolateral bundle as the anteroposterior anatomical axes of the tibia, and 47% ± 2.8% for the anteromedial bundle and 48% ± 2.9% for the posterolateral bundle as the mediolateral anatomical axis of the tibia.
Clinical Outcomes at 10-Year Follow-up
None of the patients underwent reoperation of the knee in the 10 years after surgery. At 10 years postoperatively, the mean Tegner score was 5.2. Three patients had a decreased Tegner score, but 6 of the 9 patients had the same level of activity as they had before surgery. The KL grade at 10 years after surgery showed progression in the medial compartment in 5 patients, and the SL-STS was inadequate in 3 patients who were unable to stand up from a sitting height of 30 cm. All 3 patients with inadequate SL-STS were part of the KL progression group. All 3 patients with decreased Tegner scores were also included in the KL progression group (Table 2). While only 1 of the 4 with preoperative KL grade of 0 progressed, 4 of the 5 with KL grade ≥1 progressed. No cases of lateral osteoarthritis were observed in this patient group.
Patient Data at 10-Year Follow-up a

–, negative test; +, positive test; FTA, femoral tibial angle; KL, Kellgren-Lawrence; MPTA, medial proximal tibial angle; Postop, postoperative; PTS, posterior tibial slope; SL-STS, single-leg sit-to-stand.
Ability to stand up from a sitting height of 30 cm.
The PROs at 10 years postoperatively were all favorable (Table 3). The KL-progression group scored significantly lower (ie, worse) compared with the no-progression group on the KOOS Quality of Life subscore (77.5 ± 16.3 vs 98.4 ± 3.1, respectively; P = .04) and the FJS-12 (57.9 ± 22.0 vs 89.1 ± 10.7, respectively; P = .03) (Table 3).
Patient-Reported Outcomes 10 Years After ACLR According to KL Progression Group a

Data are presented as mean ± SD. Boldface P values indicate statistically significant difference between the progression and no-progression groups (P < .05). ACL-RSI, Anterior Cruciate Ligament–Return to Sport after Injury scale; ACLR, anterior cruciate ligament reconstruction; ADL, Activities of Daily Living; FJS-12, Forgotten Joint Score–12; KL, Kellgren-Lawrence; KOOS, Knee injury and Osteoarthritis Outcome Score; QoL, Quality of Life; Sport/Rec, Sport and Recreation.
Preoperative Cartilage T1ρ Relaxation Times
The T1ρ relaxation times of the cartilage in each of the 18 compartments are shown in Table 4. In the comparison of KL progression versus no-progression groups, higher T1ρ values were seen in cartilage compartment LTP3 in the progression group (55.9 ± 6.4 vs 45.9 ± 6.0 ms; P = .04). However, no significant differences were observed in any of the other compartments.
Preoperative T1ρ Relaxation Times of Each Cartilage Compartment a

Data are presented as mean ± SD. Boldface P value indicates statistically significant difference between the progression and no-progression groups (P < .05).
Impact of Study Variables on 10-Year Postoperative Outcomes
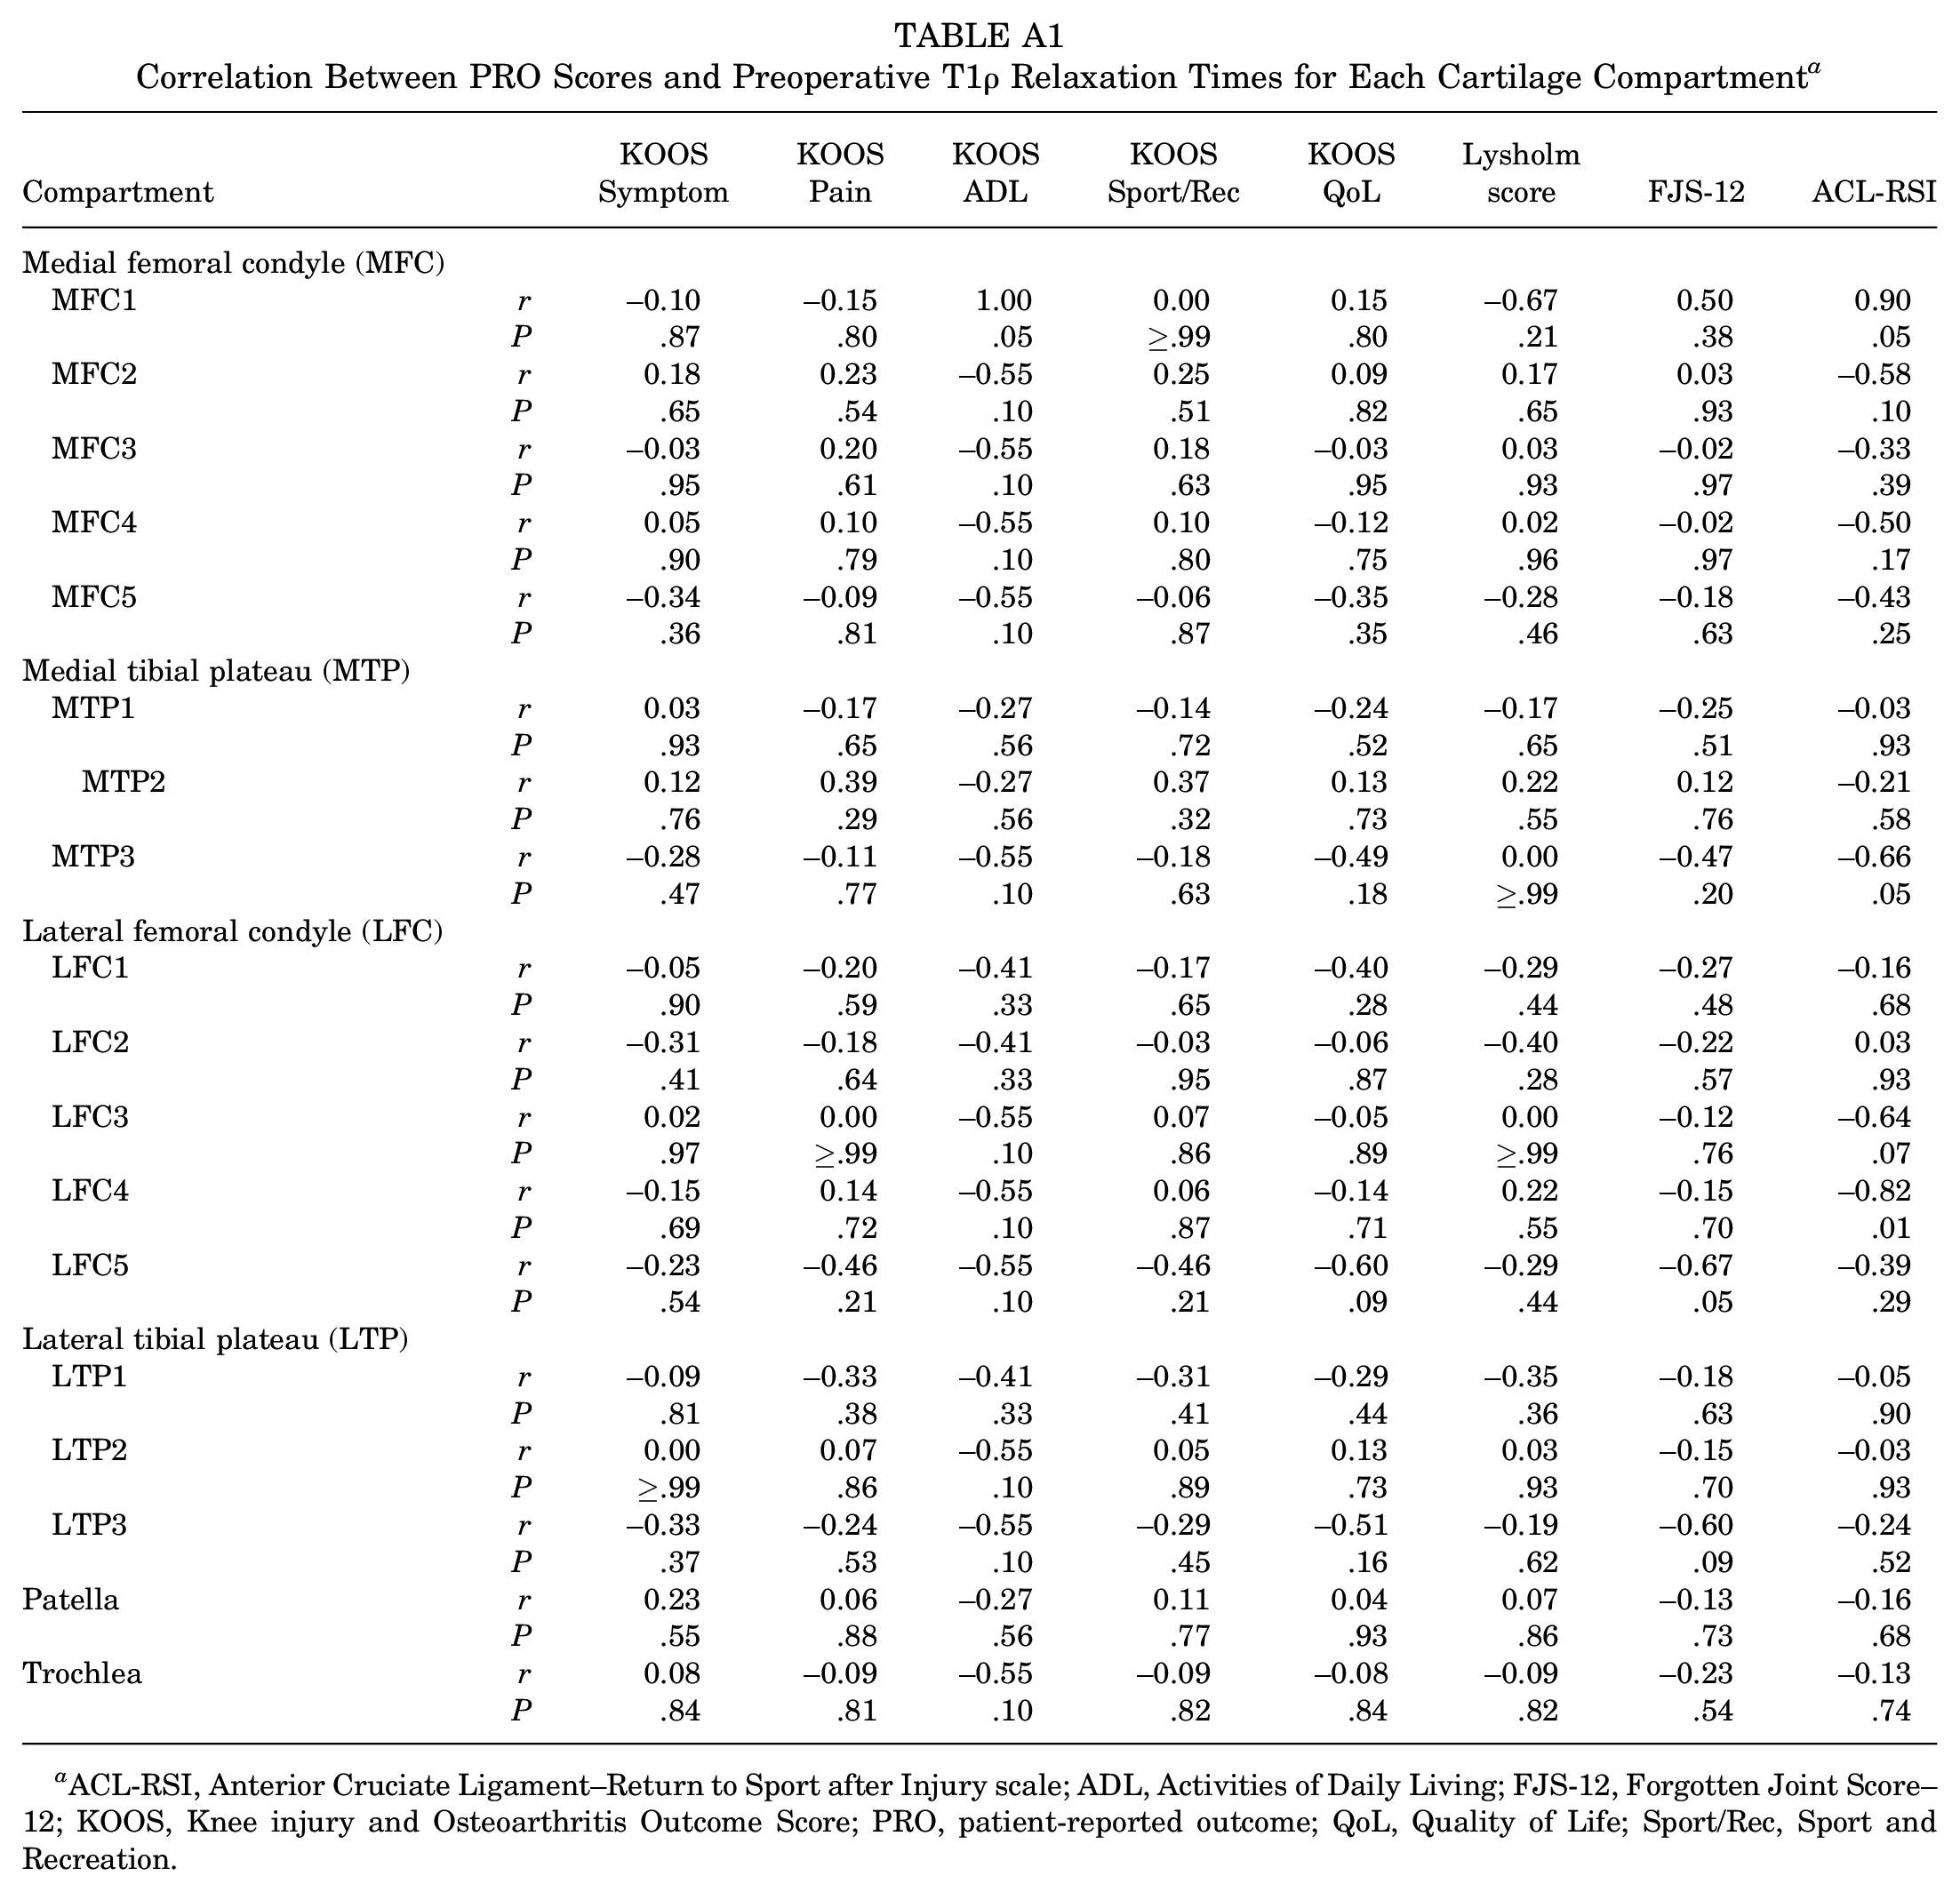
There was no correlation between the T1ρ values for any compartment and the 10-year postoperative PRO scores (AppendixTable A1). In addition, no significant differences were observed on any PRO score between the patients with versus without a lower Tegner score, with an SL-STS status of good versus inadequate, or patients with versus without meniscectomy. Regarding radiographic evaluation, however, all 3 patients with an SL-STS status of inadequate were part of the KL progression group, and all 3 patients with decreased Tegner scores were in the KL progression group. Among the 3 patients who underwent meniscectomy, 1 patient was included in the KL progression group (Table 2).
Relationship of Study Variables With Preoperative T1ρ Relaxation Times
Age at surgery was significantly associated with the T1ρ relaxation time for MTP3 (r = 0.700; P = .04), LFC5 (r = 0.752; P = .02), and LFC3 (r = 0.848; P = .008). BMI and preoperative waiting period was not associated with any of the compartments. Concerning bone geometry, MPTA was negatively correlated with the T1ρ value for MFC4 (r = −0.7524; P = .02). In other words, the stronger the tibial varus (smaller MPTA), the higher the T1ρ value, indicating cartilage degeneration. The femoral tibial angle and posterior tibial slope showed no correlations with T1ρ values for any compartment.
Patients with a preoperative KL grade of ≥1 had a higher T1ρ for LTP3 than patients with a preoperative KL grade of 0 (57.1 ± 5.1 vs 44.4 ± 3.3 ms; P = .002).
Discussion
Ten years after anatomical double-bundle ACLR, the PRO scores were favorable, but progression of the KL grade of osteoarthritis was observed in 5 of the 9 study patients. No factors that significantly affected PROs at 10 years postoperatively were identified, including preoperative T1ρ relaxation times. The patients with KL grade progression at 10 years postoperatively showed higher T1ρ values in the posterolateral tibial cartilage preoperatively compared with the patients without progression (P = .04). In this study, preoperative T1ρ values were correlated with age at surgery (T1ρ for MTP3: r = 0.700, P = .04; LFC5: r = 0.752, P = .02; and LFC3: r = 0.848, P = .008) and tibial varus (r = −0.7524; P = .02).
A large study with long-term follow-up reported that good KOOS and International Knee Documentation Committee scores were maintained for up to 2, 6, and 10 years. 26 Other studies have also reported good PRO scores over the first 10 years after surgery.6,16 Our results revealed relatively good outcomes. Meniscectomy is a strong risk factor for medial osteoarthritis occurring >10 years after ACLR.4,16 The present study included 3 patients who underwent meniscectomy, only 1 of whom showed a worsening of the KL grade.
Certain preoperative patient characteristics affect the occurrence of postoperative osteoarthritis.9,13 Patients who are older at the time of ACLR or who wait >1 year from injury to reconstruction were found to have a high risk of developing osteoarthritis 16 years after reconstruction.13,32 Among such reports, only a few studies have evaluated baseline patient characteristics using quantitative MRI. Li et al 23 reported that the T1ρ value of the posterolateral tibial cartilage was significantly elevated at baseline in ACL-injured knees versus control knees and had not fully recovered at the 1-year follow-up. A bone marrow edema–like lesion that develops after ACLR is often associated with increased T1ρ and T2 values of cartilage at the early postoperative stage. 12 Similarly, in a larger cohort, T1ρ values in the posterolateral tibial cartilage were reported to be significantly higher at baseline in ACL-injured knees than in control knees and had not fully recovered 2 years after ACLR. 36 The cartilage at this “kissing contusion” site showed extension in T2 mapping even 4 years after ACLR. 30 However, Hanypsiak et al 15 reported that it had disappeared at 12 years after ACLR, and that the presence of bone marrow edema did not affect clinical outcomes and was not associated with cartilage lesions at 12 years postoperatively. The present results are similar in that preoperative T1ρ values had little effect on the 10-year outcomes. Su et al 37 reported that the T1ρ value of posterolateral tibial cartilage at baseline was associated with KOOS Quality of Life subscores at 1 year after ACLR. This finding indicates that with ACLR, a relationship between quantitative MRI at baseline and postoperative PROs may exist.
In the present study, we investigated the relationship between preoperative T1ρ values and long-term postoperative results. No cases of progressive osteoarthritis at this kissing contusion site (the posterolateral tibia) were observed, and no effect on PROs was observed. However, T1ρ values were higher at the posterolateral tibia in patients with progressive medial osteoarthritis than in those with no progression. This finding may be indirectly related to the degree of knee subluxation at the time of the ACL injury. The high T1ρ value of LTP3 can indicate that the initial impact was severe, which might mean that other injuries (anterolateral ligament injury, capsule injury, etc) likely also occurred, resulting in high knee instability and increased medial stress.
Limitations
This study had several limitations. First, we had a small number of cases. This is a major limitation; the small number of cases was unavoidable, as this was a follow-up to a previous study. The possibility for type 2 error for other causative factors exists. However, previous studies provided some comparative data with control knees, which enabled interpretation of the results. Second, the lack of radiographs of the uninjured knee does not make it clear whether these were just patients prone to osteoarthritis regardless of the ACL injury. Third, we investigated only a single technique (double-bundle ACLR with hamstring autograft) and rehabilitation protocol, and thus the results cannot be generalized to ACLR with other techniques. Fourth, we did not perform a multivariate analysis. Finally, the longitudinal change in T1ρ was not investigated. We evaluated only the KL grade on radiography and PROs as postoperative outcomes. If quantitative MRI could be used for evaluation 10 years postoperatively, we may be able to detect such changes.
This is the first study to investigate the preoperative T1ρ and long-term postoperative outcomes of ACLR. Thus, this study contributes to our understanding of the impact of ACL injury on cartilage status and aids in the development of effective treatment strategies.
Conclusion
At the 10-year follow-up after anatomical double-bundle ACLR, the PROs were favorable; however, 5 of the 9 patients had a progressively worse KL grade. Preoperative cartilage T1ρ relaxation times did not affect PRO scores at 10 years postoperatively, but patients with KL grade progression showed higher preoperative T1ρ values in the posterolateral tibial cartilage compared with patients without progression.
Footnotes
Appendix
Correlation Between PRO Scores and Preoperative T1ρ Relaxation Times for Each Cartilage Compartment a
| Compartment | KOOS Symptom | KOOS Pain | KOOS ADL | KOOS Sport/Rec | KOOS QoL | Lysholm score | FJS-12 | ACL-RSI | |
|---|---|---|---|---|---|---|---|---|---|
| Medial femoral condyle (MFC) | |||||||||
| MFC1 | r | –0.10 | –0.15 | 1.00 | 0.00 | 0.15 | –0.67 | 0.50 | 0.90 |
| P | .87 | .80 | .05 | ≥.99 | .80 | .21 | .38 | .05 | |
| MFC2 | r | 0.18 | 0.23 | –0.55 | 0.25 | 0.09 | 0.17 | 0.03 | –0.58 |
| P | .65 | .54 | .10 | .51 | .82 | .65 | .93 | .10 | |
| MFC3 | r | –0.03 | 0.20 | –0.55 | 0.18 | –0.03 | 0.03 | –0.02 | –0.33 |
| P | .95 | .61 | .10 | .63 | .95 | .93 | .97 | .39 | |
| MFC4 | r | 0.05 | 0.10 | –0.55 | 0.10 | –0.12 | 0.02 | –0.02 | –0.50 |
| P | .90 | .79 | .10 | .80 | .75 | .96 | .97 | .17 | |
| MFC5 | r | –0.34 | –0.09 | –0.55 | –0.06 | –0.35 | –0.28 | –0.18 | –0.43 |
| P | .36 | .81 | .10 | .87 | .35 | .46 | .63 | .25 | |
| Medial tibial plateau (MTP) | |||||||||
| MTP1 | r | 0.03 | –0.17 | –0.27 | –0.14 | –0.24 | –0.17 | –0.25 | –0.03 |
| P | .93 | .65 | .56 | .72 | .52 | .65 | .51 | .93 | |
| MTP2 | r | 0.12 | 0.39 | –0.27 | 0.37 | 0.13 | 0.22 | 0.12 | –0.21 |
| P | .76 | .29 | .56 | .32 | .73 | .55 | .76 | .58 | |
| MTP3 | r | –0.28 | –0.11 | –0.55 | –0.18 | –0.49 | 0.00 | –0.47 | –0.66 |
| P | .47 | .77 | .10 | .63 | .18 | ≥.99 | .20 | .05 | |
| Lateral femoral condyle (LFC) | |||||||||
| LFC1 | r | –0.05 | –0.20 | –0.41 | –0.17 | –0.40 | –0.29 | –0.27 | –0.16 |
| P | .90 | .59 | .33 | .65 | .28 | .44 | .48 | .68 | |
| LFC2 | r | –0.31 | –0.18 | –0.41 | –0.03 | –0.06 | –0.40 | –0.22 | 0.03 |
| P | .41 | .64 | .33 | .95 | .87 | .28 | .57 | .93 | |
| LFC3 | r | 0.02 | 0.00 | –0.55 | 0.07 | –0.05 | 0.00 | –0.12 | –0.64 |
| P | .97 | ≥.99 | .10 | .86 | .89 | ≥.99 | .76 | .07 | |
| LFC4 | r | –0.15 | 0.14 | –0.55 | 0.06 | –0.14 | 0.22 | –0.15 | –0.82 |
| P | .69 | .72 | .10 | .87 | .71 | .55 | .70 | .01 | |
| LFC5 | r | –0.23 | –0.46 | –0.55 | –0.46 | –0.60 | –0.29 | –0.67 | –0.39 |
| P | .54 | .21 | .10 | .21 | .09 | .44 | .05 | .29 | |
| Lateral tibial plateau (LTP) | |||||||||
| LTP1 | r | –0.09 | –0.33 | –0.41 | –0.31 | –0.29 | –0.35 | –0.18 | –0.05 |
| P | .81 | .38 | .33 | .41 | .44 | .36 | .63 | .90 | |
| LTP2 | r | 0.00 | 0.07 | –0.55 | 0.05 | 0.13 | 0.03 | –0.15 | –0.03 |
| P | ≥.99 | .86 | .10 | .89 | .73 | .93 | .70 | .93 | |
| LTP3 | r | –0.33 | –0.24 | –0.55 | –0.29 | –0.51 | –0.19 | –0.60 | –0.24 |
| P | .37 | .53 | .10 | .45 | .16 | .62 | .09 | .52 | |
| Patella | r | 0.23 | 0.06 | –0.27 | 0.11 | 0.04 | 0.07 | –0.13 | –0.16 |
| P | .55 | .88 | .56 | .77 | .93 | .86 | .73 | .68 | |
| Trochlea | r | 0.08 | –0.09 | –0.55 | –0.09 | –0.08 | –0.09 | –0.23 | –0.13 |
| P | .84 | .81 | .10 | .82 | .84 | .82 | .54 | .74 |
ACL-RSI, Anterior Cruciate Ligament–Return to Sport after Injury scale; ADL, Activities of Daily Living; FJS-12, Forgotten Joint Score–12; KOOS, Knee injury and Osteoarthritis Outcome Score; PRO, patient-reported outcome; QoL, Quality of Life; Sport/Rec, Sport and Recreation.
Final revision submitted June 27, 2024; accepted July 3, 2024.
The authors declared that there are no conflicts of interest in the authorship and publication of this contribution. AOSSM checks author disclosures against the Open Payments Database (OPD). AOSSM has not conducted an independent investigation on the OPD and disclaims any liability or responsibility relating thereto.
Ethical approval for this study was obtained from Chiba University Hospital (reference No. M10439).