
Abstract
Background:
Ice hockey players have a high rate of hip pathology, which can lead to hip arthroscopy. Previous studies have not utilized team-based advanced performance statistics in the setting of hip arthroscopy in National Hockey League (NHL) players.
Purpose/Hypothesis:
The purpose of this study was to use team-based advanced performance statistics to evaluate postoperative performance after hip arthroscopy in NHL players in comparison with their preoperative performance and matched controls of uninjured skaters. It was hypothesized that there would be no significant difference between preoperative and postoperative performance after hip arthroscopy in NHL players, as well as no difference when compared with matched controls of uninjured players.
Study Design:
Descriptive epidemiology study.
Methods:
There were 56 eligible NHL players found through public records who underwent hip arthroscopy over 12 seasons. Team-based advanced performance statistics including icetime, Corsi, Fenwick, goal, and expected goal percentages were recorded for the preinjury season, index season, and first 2 years after return to play (RTP). Relative percentages of each statistic were collected to allow for intrateam comparisons. A control group of NHL players without injury was collected and matched 1:2 by age, years of play, and draft round.
Results:
The RTP rate after hip arthroscopy at the NHL level was 89% for 1 season and 70% for 2 seasons. There were no significant decreases in performance in any advanced statistics after RTP after hip arthroscopy in comparison with the preinjury season or versus a matched control group of uninjured players. There was a significant decrease in games played in the injury season and the first year after RTP versus the preinjury season and versus a matched control group without differences thereafter.
Conclusion:
The RTP rate after hip arthroscopy at the NHL level was 89% for 1 season and 70% for 2 seasons. There were no significant decreases in team-based advanced performance statistics after RTP from hip arthroscopy for NHL players versus their preinjury levels or versus a matched control group of uninjured players. This indicates that NHL players who RTP at the NHL level are likely able to return to their previous level of performance, albeit playing in fewer games the first season after surgery.
Numerous studies have demonstrated a high prevalence of femoroacetabular impingement (FAI), or other hip pathology including labral tears, in adolescent and elite level ice hockey players.2,3,9,10,16,17,22,27 In a hip preservation center registry, ice hockey was the most common sport for male players undergoing hip arthroscopy for FAI, 21 with Hanke et al 11 reporting that a cam morphology develops in the final growth spurt of the femoral head-neck junction in adolescent hockey players between 13 and 16 years of age. Furthermore, in a review of 1 National Hockey League (NHL) organization, Larson et al 16 reported rates of cam morphology between 85% and 89% based on alpha angle and head-neck offset, respectively. Finally, Epstein et al 9 reported that the most common intra-articular hip injury in NHL players was a labral tear.
Given the high rates of FAI and hip labral tears in hockey players, a few studies have evaluated performance and return to play (RTP) after hip arthroscopy for NHL players, with variable results.7,13,18,24,26 These studies all used a single performance score initially developed by Schroeder et al 25 that incorporates several factors into a single score. However, in our opinion, this formula might oversimplify hockey performance, because it relies on goals, game-winning goals, goals scored by special teams (power play or short-handed), plus-minus, and penalty minutes, all of which can be influenced by the quality of the team or a player's opportunity within a team. More recent studies have evaluated performance in NHL players for other injuries using team-based advanced performance statistics that are widespread in the hockey community. These include metrics based on team-based percentage of shots taken, goals scored, or expected percentage of goals scored while that player is on the ice (Table 1).1,4-6 Similarly, advanced statistics have been used in other studies for other sports for RTP analysis after injury, especially for professional baseball.8,14,15,19
Glossary of Team-Based Advanced Performance Statistics

At the current time, studies evaluating NHL performance after hip arthroscopy using team-based advanced performance statistics are lacking. Therefore, the purpose of the current study was to use team-based advanced performance statistics to evaluate the postoperative performance after hip arthroscopy in NHL players in comparison with both their preoperative performance and a matched control group of uninjured players. Our hypothesis was that there would be no significant difference between postoperative performance and preoperative performance after hip arthroscopy or compared with a matched control group of NHL players with no reported history of hip surgery.
Methods
A retrospective cohort study was performed by identifying all NHL players who underwent hip arthroscopy between the 2009-2010 and 2021-2022 seasons. The search was conducted through a review of public records in a manner similar to that of previous studies examining NHL injuries.1,5,7,10 In a manner similar to other similar studies, institutional review board approval was not required given that all data were collected using public data without access to any patient medical records.1,7,8,14,15
Hip Arthroscopy Group
This review first began by examining a public database (https://nhlinjuryviz.blogspot.com/2015/11/nhl-injury-database.html) that tracks every game missed by NHL players and identifies the type of injury leading to missed games. All players with a “hip, groin, or lower body” injury were then confirmed independently with additional public sources including injury reports, player profiles, and game summaries. 1 This search was performed separately by 2 authors (C.M.LaPrade and M.D.L). Three players were excluded for undergoing hip resurfacing, while 1 was excluded for a stress fracture. After exclusion criteria were applied, this search resulted in a cohort of 56 patients who underwent primary hip arthroscopy with a previous healthy season before injury for comparison. Exclusions included 6 skaters who were rookies or had injury while playing in minor leagues, 4 skaters who underwent revision arthroscopies, and 3 who missed the preinjury year due to another injury (Figure 1). Players were included if they underwent concurrent bilateral primary hip arthroscopy, as well as if they had a later contralateral hip arthroscopy in a staged manner. We also found 17 goalies who underwent hip arthroscopy in the study time period, of which only 9 would have been eligible (3 were injured during rookie year, 4 did not RTP, and 1 had an entire missed season in the previous year for other injury). Therefore, due to the paucity of goaltenders available, they were excluded in this current study.

Flowchart demonstrating final patient cohort for the current study. NHL, National Hockey League; RTP, return to play.
Control Group
A 1:2 matched control group of NHL players without a known history of hip injury or hip arthroscopy was created in a similar manner to previous studies.1,5 This matched control group was obtained by finding players with the same position and age (within 1 year) at the time of surgery. To further ensure players of similar talent levels were included, the players were also matched by draft round (within 1 round with the exception of first round picks, which were matched to another first round pick) and years of experience (within 1 year of experience) in the NHL before undergoing surgery.
Data Collection
The MoneyPuck database (https://moneypuck.com/stats.htm) 20 is a publicly available database that has been tracking advanced statistics of NHL players since the 2008-2009 season. Therefore, the time frame of this current study began in 2009-2010 to allow for a year of preinjury baseline performance. Similar to Andrews et al, 1 many of the commonly used advanced statistics used by the hockey community were collected from https://www.hockeyreference.com, 12 an online resource that collects official NHL data (Table 1). First, Corsi percentage (Corsi %; Table 1) was collected.1,5 As explained by Andrews et al, 1 a “Corsi percentage >50% indicates that the team produced more shot attempts than its opponent with the player on the ice, and a Corsi percentage >55% is considered elite.” In addition, we also collected Fenwick percentages (Fenwick %), which excludes blocked shots and may be viewed as a more refined statistic representing scoring opportunities. 1 Furthermore, the relative Corsi % and relative Fenwick % were collected, which allow for the opportunity to compare players in relation to their teammates (a positive relative score indicating a better than average performance versus teammates). The MoneyPuck database was also used to collect 4 previously unpublished advanced metrics: the share of possible icetime (Icetime %), on-ice goal percentage (G %), on-ice expected goal percentage (xG %), and relative xG %. 20 As described by MoneyPuck, 20 the xG % “predicts the probability of each shot being a goal. Factors such as the distance from the net, angle of the shot, type of shot, and what happened before the shot are key factors in the model. This model was built on over 50,000 goals and 800,000 shots in the NHL regular season and playoff games between the 2007-2008 and 2014-2015 seasons with location data. By adding up all the probabilities of a team's shots during a game, we can calculate the team's expected goals in that game.” Definitions of all these measured metrics are listed in Table 1. The Corsi % was the primary endpoint for this study.
Data were collected for each skater the year before surgery, the index (injury) season, and the first and second years after RTP to NHL level. The preoperative year was defined as a theoretically “healthy” year before the injury. The index year was defined as the year in which the injury occurred and included whether a player required hip arthroscopy after the completion of the season. The index year was compared with the preoperative year to see whether there were any diminishing effects on performance as the player played through the injury. All other comparisons for postoperative performance were made in comparison with the preinjury season.
Statistical Analysis
Sample size calculation was performed to determine the sample size required to detect a 5% change in Corsi % with a power of 0.8, yielding a required size of at least 12 players in each group. This 5% change in Corsi % was based on the statement by Andrews et al 1 that a “Corsi percentage >55% is considered elite.” Post hoc power analyses were conducted to ensure power >0.8 for statistical significance to be reported. Shapiro-Wilk test was used to assess normality of the data; all data followed a normal distribution and therefore were analyzed with parametric tests. Players were compared with controls using Student t tests. Analysis of variance and paired t tests were used to assess significant differences between seasons for both groups. Alpha was 0.05 and statistical analysis was performed using SPSS (version 29; IBM).
Results
RTP Data
A total of 56 players underwent hip arthroscopy with a RTP rate of 89% at the NHL level. For the 50 players who did RTP, 100 matched controls (1:2 ratio) were included in the study. Data were available for all 50 players in the year before injury, 49 players in the injury year (1 was injured in preseason of injury year), 50 players in the year after surgery, and 39 players in the second year after arthroscopy. Descriptive statistics were reported for players who underwent hip arthroscopy and the matched controls. There were no significant differences in demographics between the hip arthroscopy group and the matched controls (Table 2). There were no significant differences in demographics between players who underwent hip arthroscopy and were able to RTP and those who did not RTP (Table 3). Of the 11 who did not return for a second year in the NHL, 6 continued to play at a lower professional level.
Baseline Characteristics for Hip Arthroscopy and Control Groups a
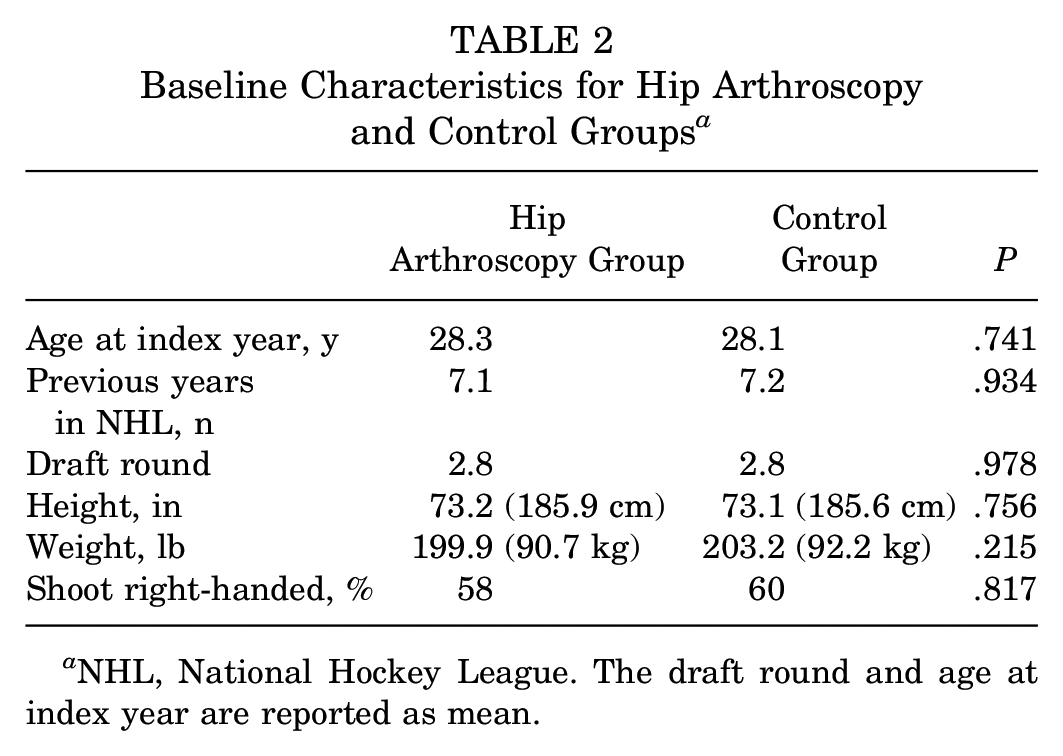
NHL, National Hockey League. The draft round and age at index year are reported as mean.
Baseline Characteristics for Hip Arthroscopy Group Who Did RTP and Did Not RTP a
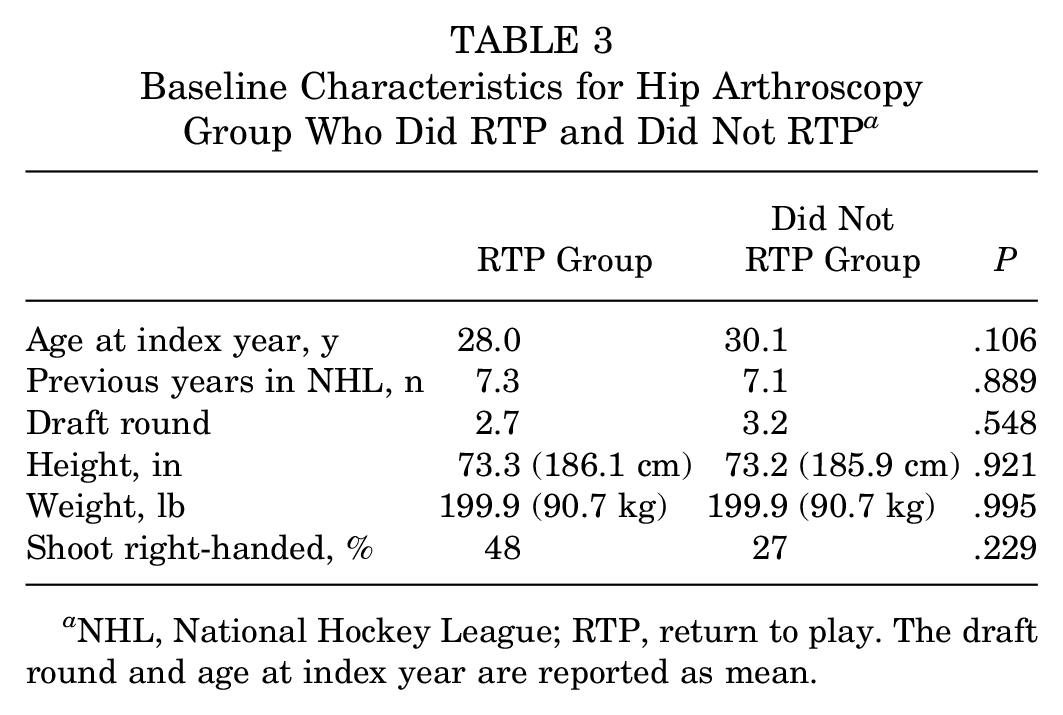
NHL, National Hockey League; RTP, return to play. The draft round and age at index year are reported as mean.
Preinjury Versus Injury Year and Postprocedure Years
In comparison with their preinjury year, there were a significantly decreased number of games played in the index (injury) season and the first year after RTP (Tables 4 and 5). There was no difference in games played between the preinjury and the second year after RTP.
Raw Team-Based Performance Statistics a

Data presented as mean ± SD. Glossary of all team-based statistics in Table 1. NHL, National Hockey League.
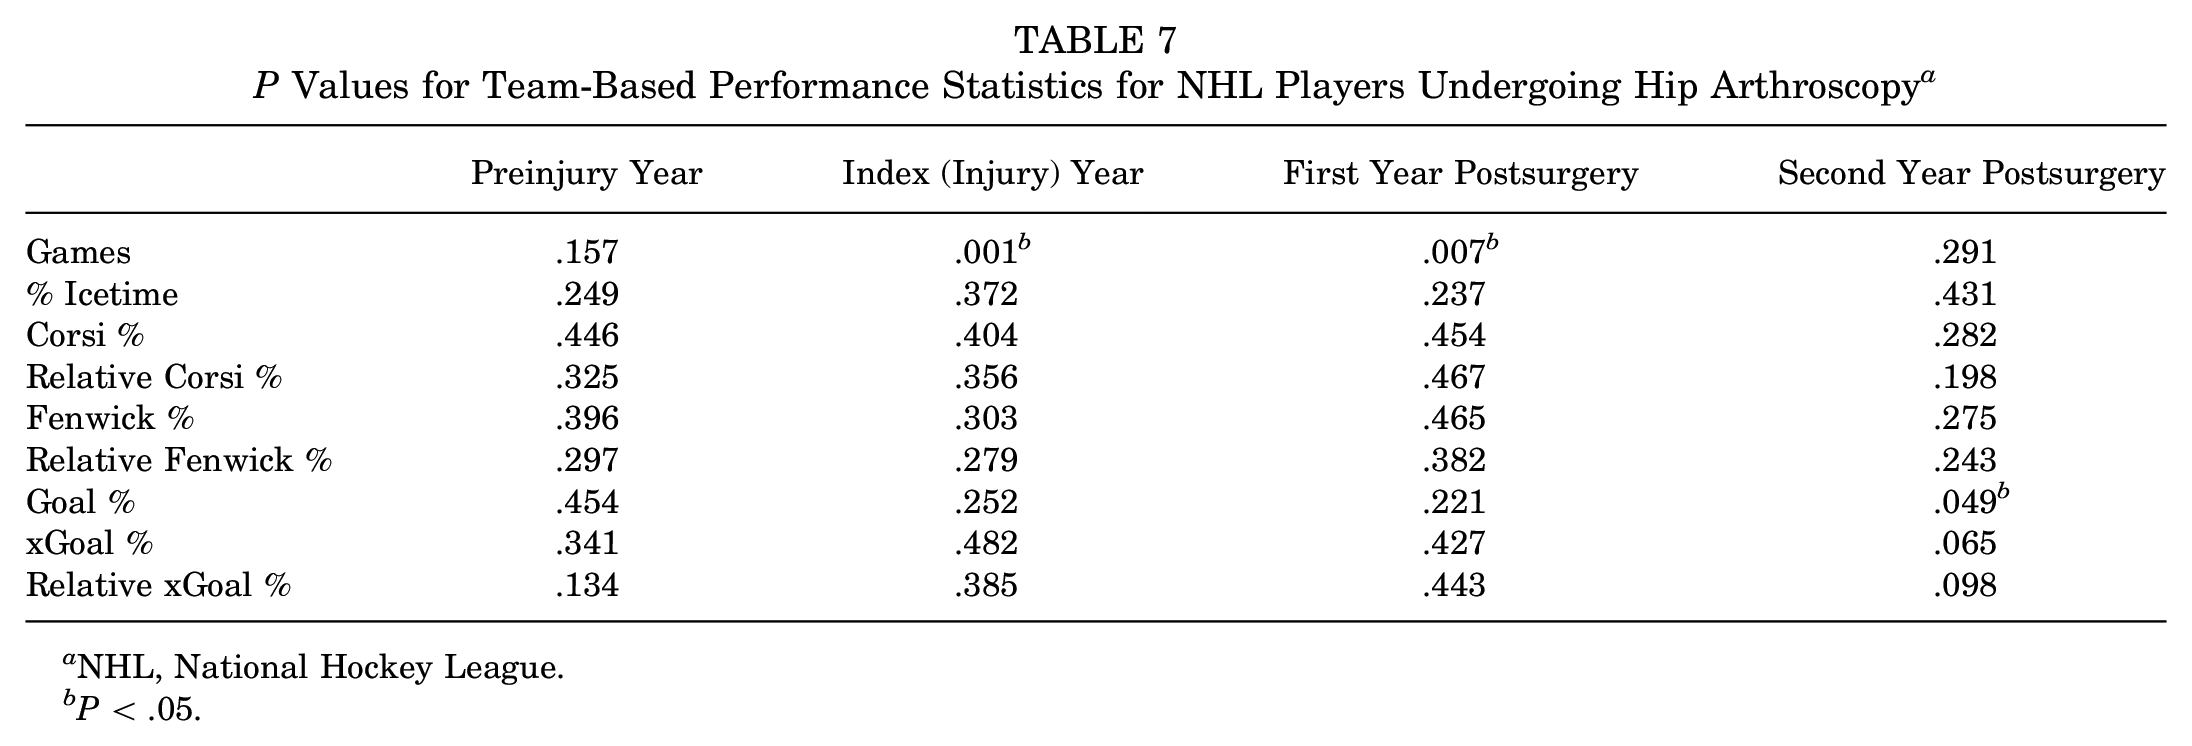
P Values for Team-Based Performance Statistics for NHL Players Undergoing Hip Arthroscopy a

Additional comparisons were made from the preinjury season versus the index (injury) year and the first and second years after return to play after hip arthroscopy. ANOVA, analysis of variance (across all years).
P < .05.
There were no significant differences in Icetime %, Corsi %, Relative Corsi %, Fenwick %, Relative Fenwick %, G %, xG %, or Relative xG % between the preinjury season and the index (injury) season, or years 1 or 2 after RTP.
Injury Group Versus Matched Controls
In comparison with a matched control group, there were a significantly decreased number of games played in the index (injury) season and the first year after RTP (Tables 6 and 7). There was no difference in games played in the preinjury or second year after RTP between the groups.
Raw Team-Based Performance Statistics for Matched Controls of NHL Players a

Data presented as mean ± SD. Glossary of all team-based statistics in Table 1. NHL, National Hockey League.
P Values for Team-Based Performance Statistics for NHL Players Undergoing Hip Arthroscopy a
NHL, National Hockey League.
P < .05.
There were no significant differences in Icetime %, Corsi %, Relative Corsi %, Fenwick %, Relative Fenwick %, xG %, or Relative xG % between the preinjury season and the injury season, or years 1 or 2 after RTP. There was a significantly increased (improved) G % in the second year after RTP from hip arthroscopy versus the control group.
Discussion
The RTP rate after hip arthroscopy at the NHL level was 89% for 1 season and 70% for 2 seasons. In addition, after hip arthroscopy, performance did not decrease significantly in any advanced statistic in comparison with the preinjury performance or versus a matched cohort of uninjured players. There was also no significant decrease in performance in the index season in which the injury occurred. In terms of games played, there was a significant decrease in games played after hip arthroscopy in both the index season and the first season after RTP, but this effect was not present in the second season after RTP.
Performance analysis after RTP in NHL players undergoing hip arthroscopy has conflicting results in previous studies. In contrast to our findings, most previous studies reported decreased performance after RTP,7,13,18,24 including up to year 2 or 3 after RTP.7,18 In contrast, Sochacki et al 26 found no significant decrease in performance after RTP. Jack et al 13 was the only study comparing performance with that of a matched control group and, similar to our study, did not find any significant differences in performance after RTP. We hypothesized that the difference between these studies and the current study is due, at least partially, to the fact that all previous studies used a single performance score, proposed by Schroeder et al, 25 that is not commonly used in describing hockey performance and may oversimplify performance in NHL players. This score included weighted averages that incorporated even strength goals, power play goals, shorthanded goals, game winning goals, assists, plus/minus, penalty minutes, and shots on goal divided by the number of games played. 25 We believe that using team-based advanced performance statistics that are widely used in the hockey community and used in the current study increases the generalizability of our findings.
In addition, previous studies have evaluated performance using RTP rates and games played in NHL players. Similar to our findings, other studies have reported a decrease in games played in the first year after RTP.7,18 The RTP rates across different studies previously ranged between 91% and 96%,7,26 which is similar to our study (89%).
Although this study is among the first to evaluate team-based advanced performance statistics in the setting of RTP after hip arthroscopy, recent studies have begun to incorporate these statistics in the setting of other injuries. Two previous studies used Corsi % and Fenwick % to evaluate performance after RTP from concussion,1,4 while Castle et al 5 used Corsi % and Fenwick % to evaluate performance after RTP from arthroscopic labral repair in the shoulder. Finally, Charest et al 6 used Fenwick % to evaluate performance in NHL players based on their travel distance and time zone changes. We propose that future studies should try to incorporate these statistics to increase the generalizability of findings and hopefully standardize findings across studies.
Limitations
We recognize that there are limitations to this current study. First, the study is reliant on publicly available information and does have the possibility of missing some players who underwent hip arthroscopy during an offseason or simply not being reported to the media as such. However, given that recovery after hip arthroscopy is extended, with mean time to return to skating drills being reported as 3.8 months, 23 with full RTP averaging 177 to 188 days,18,24 even an off-season injury would likely lead to a player missing some time and therefore ending up on an injury report. Second, it is possible that a player in the control group had hip-related issues or surgery in the offseason that were not reported in the media. However, short of having access to the official NHL electronic medical records database, we believe that the current study design with the search performed is consistent with the level of accuracy in previously published studies.7,13,18,24,26 In addition, we are unable to report on differences in extent of the injury, including possible concomitant groin or core muscle injury, presence or absence of labral pathology, or any associated hip dysplasia or osteoarthritis. In accordance with this, we are unable to know the exact procedure performed, which may theoretically range from a diagnostic arthroscopy to labral debridement, repair, or reconstruction, or how long the player was symptomatic before surgery. Finally, while team-based performance statistics are commonly used in the hockey community, they are not a perfect measure for performance. We also used relative measures for Corsi %, Fenwick %, and xG % to compare players within their own team to account for any statistics that were skewed by either a very strong or weak team. We did not find any significant differences in the relative statistics.
Conclusion
The RTP rate after hip arthroscopy at the NHL level was 89% for 1 season and 70% for 2 seasons. This study utilized team-based advanced performance statistics that may be more relevant to hockey performance in comparison with previous studies, and there were no significant decreases in team-based advanced performance statistics after RTP from hip arthroscopy for NHL players versus their preinjury levels or versus a matched control group of uninjured players. This indicates that NHL players who RTP at the NHL level were probably able to return to their previous level of performance, albeit playing in fewer games the first season after surgery.
Footnotes
Final revision submitted June 27, 2024; accepted July 3, 2024.
One or more of the authors has declared the following potential conflict of interest or source of funding: R.F.L. is a consultant for Ossur and Smith+ Nephew; has received royalties from Ossur, Smith+Nephew, and Elsevier; has received research grants from the Arthroscopy Association of North America, the American Orthopaedic Society for Sports Medicine (AOSSM), Ossur, and Smith+Nephew; has served on committees for AOSSM and the International Society of Arthroscopy, Knee Surgery, and Orthopaedic Sports Medicine; and has served on the editorial board for the American Journal of Sports Medicine, Knee Surgery, Sports Traumatology, and Arthroscopy, the Journal of Experimental Orthopaedics, the Journal of Korean Studies, the Journal of Orthopaedic and Sports Physical Therapy, and Operative Techniques in Sports Medicine. C.M.Larson. is a consultant for Responsive Arthroscopy and Smith & Nephew; has received stock options for Responsive Arthroscopy; and has received hospitality payments from Synthes GmbH. C.M.LaPrade. has received education payments from Evolution Surgical, Inc, Foundation Medical, LLC, Arthrex, Inc, and Smith+Nephew. M.D.L. has received education payments from Great Lakes Orthopedics. H.E.S. has received education and hospitality payments from Arthrex, Inc, Medwest Associates, Stryker, and Smith+ Nephew. AOSSM checks author disclosures against the Open Payments Database (OPD). AOSSM has not conducted an independent investigation on the OPD and disclaims any liability or responsibility relating thereto.
Ethical approval was not sought for the present study.