
Abstract
Background:
Knee osteoarthritis (OA) is a debilitating condition, and synovitis is a structural marker of disease progression that can be identified on magnetic resonance imaging (MRI). Nonsurgical therapies have been developed with the goal of targeting this inflammation to reduce pain and slow disease progression.
Purpose:
To review current randomized controlled trials (RCTs) that measured changes in pain outcomes and synovitis on MRI scans after nonsurgical treatment for persons with knee OA.
Study Design:
Systematic review; Level of evidence, 1.
Methods:
The PubMed database was searched using the terms “knee osteoarthritis AND (synovitis OR inflammation)” for RCTs published between 2012 and 2022. Included were studies that collected both pain outcomes and quantitative measurements of synovitis on MRI scan before and after treatment; studies that investigated surgical treatments were excluded. We calculated standardized response means (SRMs) to analyze the effect sizes of treatment on pain and synovitis outcomes; SRMs were classified as having low responsiveness to treatment if <0.5, moderate responsiveness to treatment if between 0.5 and 0.8, and large responsiveness to treatment if >0.8.
Results:
Included in the review were 9 RCTs. Vitamin D and exercise therapy were the only 2 treatments that improved both pain and synovitis outcomes in comparison with their respective control groups. Statistically significant group differences in favor of treatment were seen in changes in pain after lutikizumab (anti-interleukin-1α/β dual variable domain immunoglobulin; SRM, 0.22; P = .050), allogenic human chondrocytes transduced with retroviral vector encoding transforming growth factor-β1 (P = .0119 at 12 weeks, P = .120 at 52 weeks, and P = .0074 at 72 weeks), and Curcuma longa (turmeric; SRM, 0.35; P = .039 on the visual analog scale for pain and SRM, 0.47; P = .006 on the Western Ontario and McMaster Universities Osteoarthritis Index pain subscore). One study reported a statistically significant group difference in synovitis only after treatment with intra-articular methylprednisolone (P = .01 at 14 weeks and P = .0006 at 26 weeks).
Conclusion:
Only vitamin D and exercise therapy were found to improve pain and synovitis after treatment in this review. Further research is needed to validate these findings and investigate alternative treatments for reducing pain and synovitis in persons with knee OA.
Knee osteoarthritis (OA) is a debilitating condition that affects nearly 14 million persons in the United States, including >6 million people between 45 and 65 years of age who often wish to engage in sporting activity. 8 The worldwide prevalence of knee OA is estimated at >654 million persons aged ≥40 years. 5 Adults living with knee OA experience chronic pain and attendant physical limitations. 2 The pathogenesis of knee OA includes degradation of the articular cartilage, subchondral bone thickening, and formation of osteophytes. 22 Mechanical factors, including malalignment of the knee joint and varus thrust, contribute to knee OA disease progression.3,34 Although knee OA was regarded historically as a noninflammatory arthritis, synovitis (inflammation of the synovium) has also been shown to be important in the pathogenesis of OA. 27
Magnetic resonance imaging (MRI) has been established as a method for reliably and quantitatively measuring structural changes in knee OA, 17 including synovitis. 23 While inflamed synovium is best appreciated on contrast-enhanced MRI scans, effusion volume and inflammation in the Hoffa fat pad have been used as proxy measures of synovitis that can be assessed with noncontrast MRI studies.16,31 Studies of the associations between synovitis on MRI scans and pain in persons with knee OA have been inconsistent.6,7,14,15,36 In a meta-analysis, Dainese et al 6 observed considerable variability in reported correlations between pain and effusion synovitis (ES) on noncontrast-enhanced MRI scans, with correlation coefficients ranging from 0.19 to 0.61. Neogi et al 30 reported that extent of “synovitis and effusion” observed on noncontrast MRI scans were statistically and significantly associated with an increase in pain sensitization.
Because synovitis is an element of knee OA pathogenesis, investigators have attempted to target and diminish synovitis with therapeutic agents to slow structural progression and reduce pain. 32 We are not aware of published reviews investigating the effect of knee OA treatments on synovitis as measured on MRI scans. To fill this research gap, we launched this systematic review of the effect of OA treatments on synovitis and pain in persons with knee OA. The objective of this review was to identify treatments for knee OA that reduced both pain and synovitis markers on MRI scans, and the hypothesis was that few, if any, treatments would statistically significantly reduce both pain and synovitis.
Methods
Selection of Studies
Under Preferred Reporting Items for Systematic Reviews and Meta-Analyses (PRISMA) guidelines, PubMed was searched using the terms “knee osteoarthritis AND (synovitis OR inflammation)” for randomized controlled trials (RCTs) published between 2012 and 2022. The first author (J.G.) completed the search and reviewed all of the studies, applying the inclusion and exclusion criteria (Table 1). Duplicate studies were screened out in the initial search. To be included in the review, the study needed to be a clinical trial or subanalysis of a trial in which patients with knee OA were administered a treatment to improve their symptoms. The trial needed to collect both pain outcomes and quantitative measurements of synovitis (Hoffa fat pad synovitis [HS] and/or ES) on MRI scan. These pain and imaging outcomes had to be assessed before and after treatment to investigate the relationship between the treatment and both outcomes (pain and effusion or HS on MRI scan). Excluded were studies that investigated surgical therapies, were not published in English, did not include a control group, or were animal studies. We also excluded reviews and letters to the editor. After the inclusion and exclusion criteria were applied, we reviewed all references from the remaining studies for additional RCTs.
Inclusion and Exclusion Criteria for Studies a

MRI, magnetic resonance imaging.
Statistical Analysis
To analyze changes in outcomes (synovitis measured on MRI scan and pain scores) for each study, we calculated the standardized response means (SRMs) for studies that reported mean changes from baseline to follow-up. 21 SRMs were calculated by first recording the mean preintervention-to-postintervention changes in the treatment and control groups. We then divided the difference in these mean changes by the standard deviation of the mean changes. The standard deviation of the difference between mean changes was calculated by summing the square of the standard deviation from the mean change in pain from the treatment group and the square of the standard deviation from the mean change in pain from the control group and then taking the square root of this sum. When studies did not report standard deviations of the mean changes, the 95% CIs reported was used to derive these values. Standard deviations were calculated by multiplying the half-width of the 95% CI around the within-group change by the square root of the number of subjects in the group and dividing by 1.96. The square root of the total number of subjects in the respective group (treatment or control) was the numerator. 13 If standard errors were reported instead of standard deviations, the standard deviations were derived by multiplying the standard error by the square root of the total number of subjects in the respective group. When studies reported least-square means (LSMs) and least-square mean differences (LSMDs) instead of means and mean differences, we used the LSM instead of the mean difference and LSMD instead of the difference between means to calculate the SRMs, following the same calculations described previously.
SRMs were classified as having low responsiveness to treatment if <0.5, moderate responsiveness to treatment if between 0.5 and 0.8, and large responsiveness to treatment if >0.8. 4
Results
Search Results
The initial search yielded 189 results. After reviewing the abstracts and applying the inclusion and exclusion criteria, 166 studies were excluded. After reviewing the full text of the remaining 23 studies, 14 studies were excluded, leaving 9 studies that were included in the systematic review for analysis.# The review of the reference lists of these selected 9 studies did not provide any additional articles that met all the inclusion criteria. A flowchart of the study-inclusion process is shown in Figure 1. Table 2 provides a summary of each study, including the total number of participants in each trial, participant characteristics, distribution of participants in the treatment and control groups. Table 3 describes the treatment interventions used in each study.
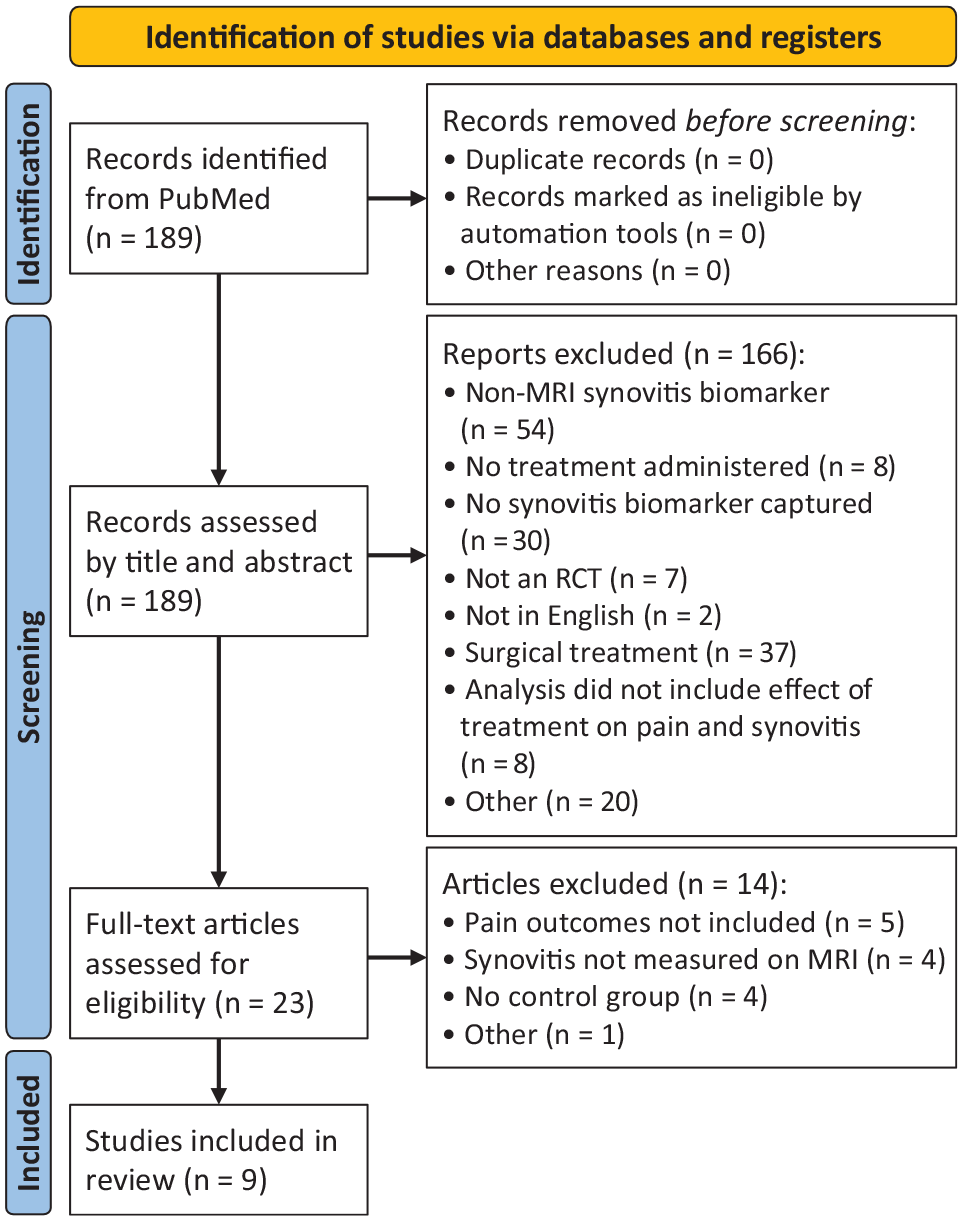
Preferred reporting items for systematic reviews and meta-analyses[PRISMA] flowchart of the study-inclusion process. MRI, magnetic resonance imaging; RCT, randomized controlled trial.
Characteristics of the Included RCTs a
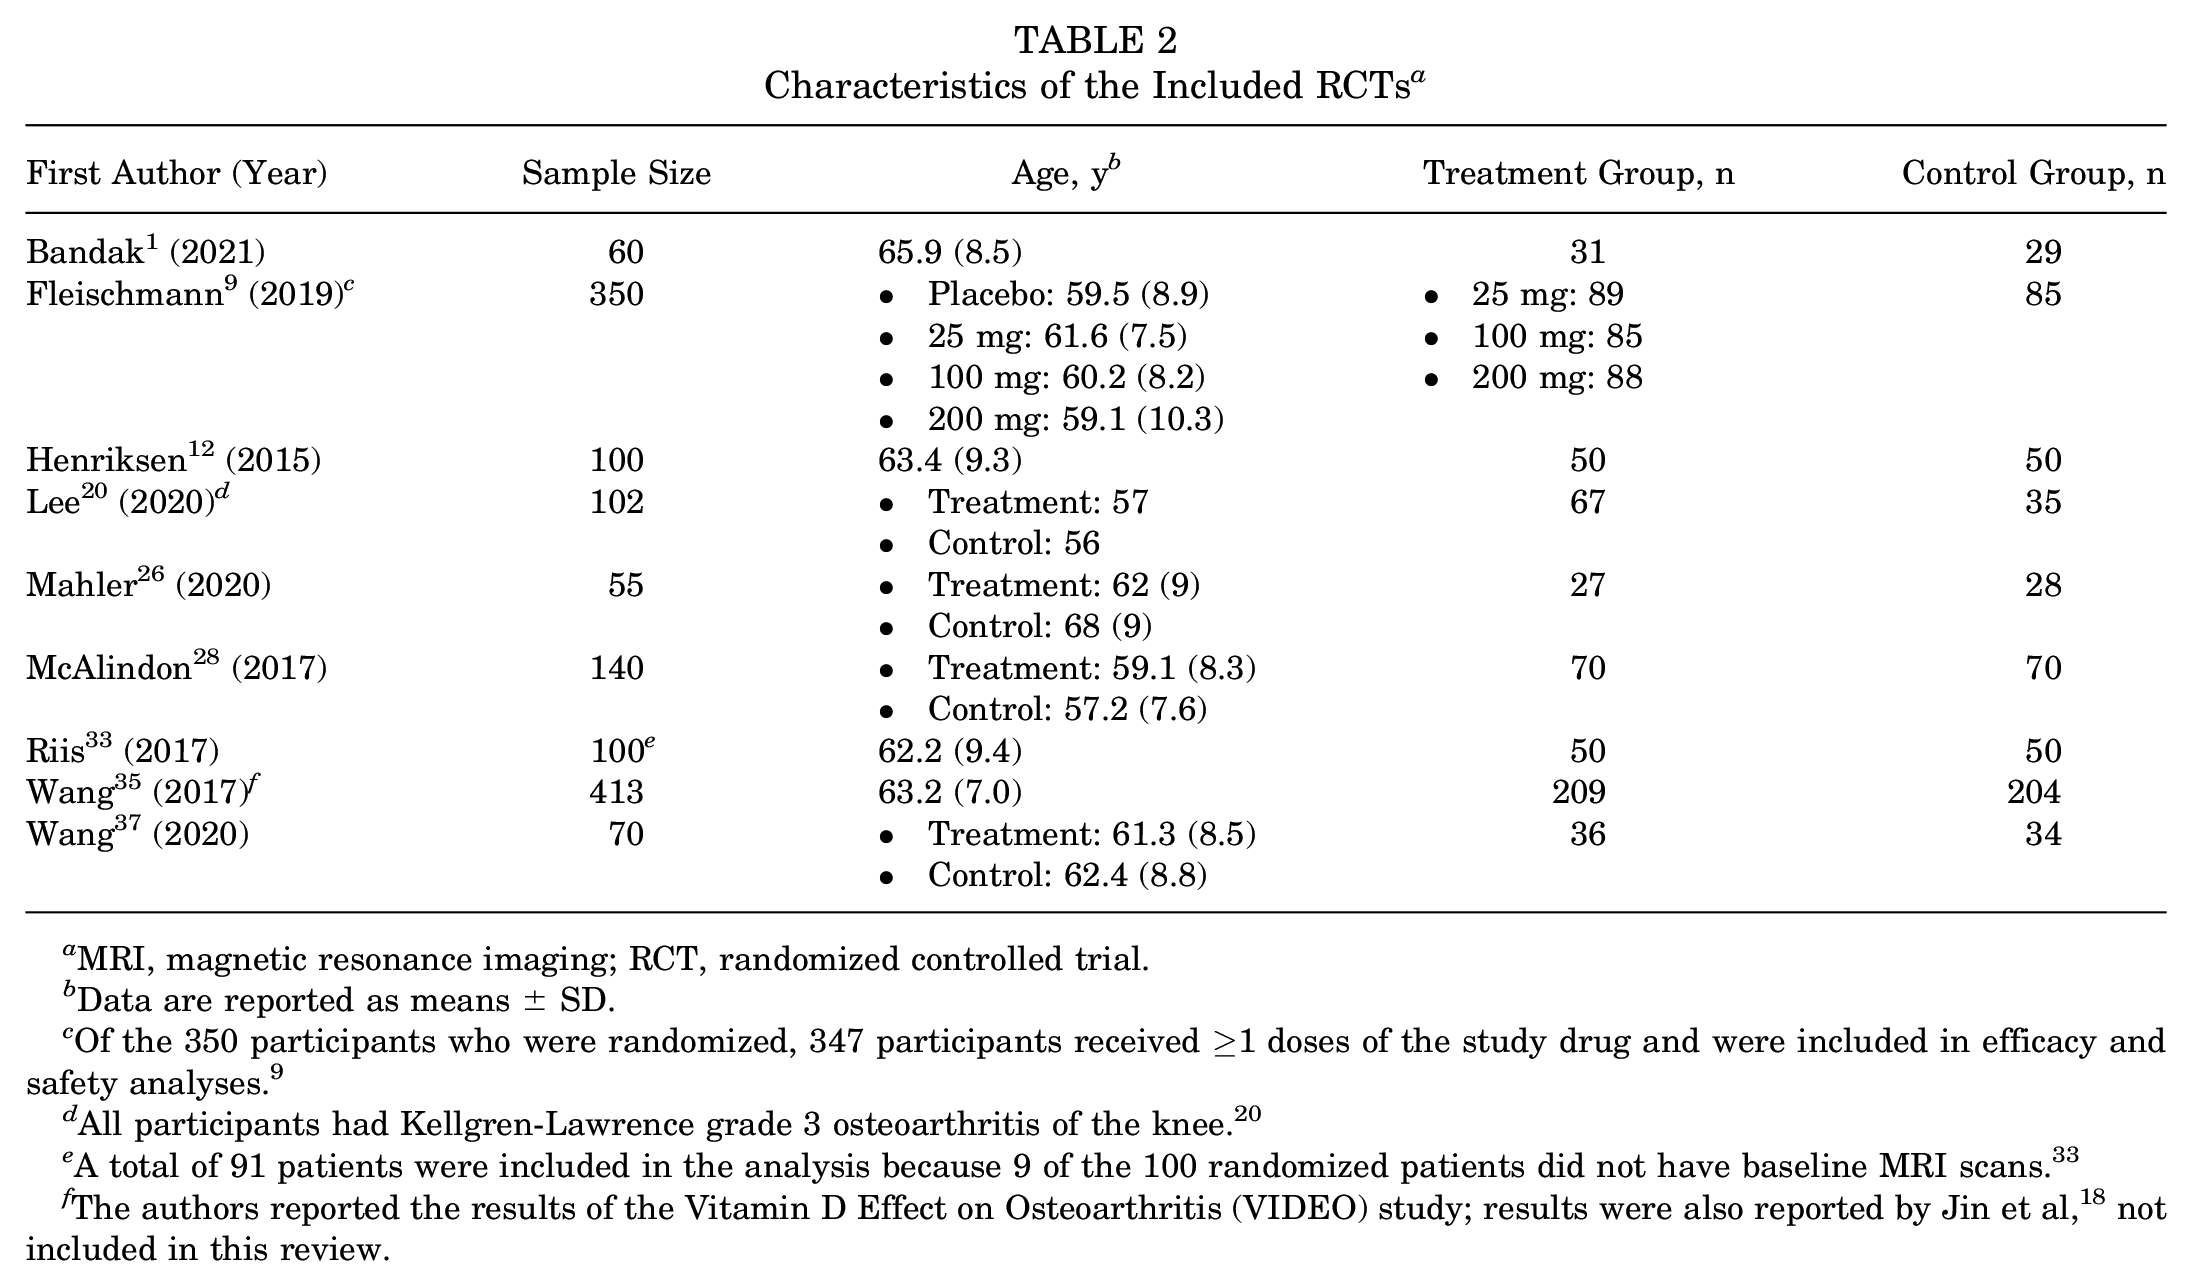
MRI, magnetic resonance imaging; RCT, randomized controlled trial.
Data are reported as means ± SD.
Of the 350 participants who were randomized, 347 participants received ≥1 doses of the study drug and were included in efficacy and safety analyses. 9
All participants had Kellgren-Lawrence grade 3 osteoarthritis of the knee. 20
A total of 91 patients were included in the analysis because 9 of the 100 randomized patients did not have baseline MRI scans. 33
The authors reported the results of the Vitamin D Effect on Osteoarthritis (VIDEO) study; results were also reported by Jin et al, 18 not included in this review.
Treatment Interventions a
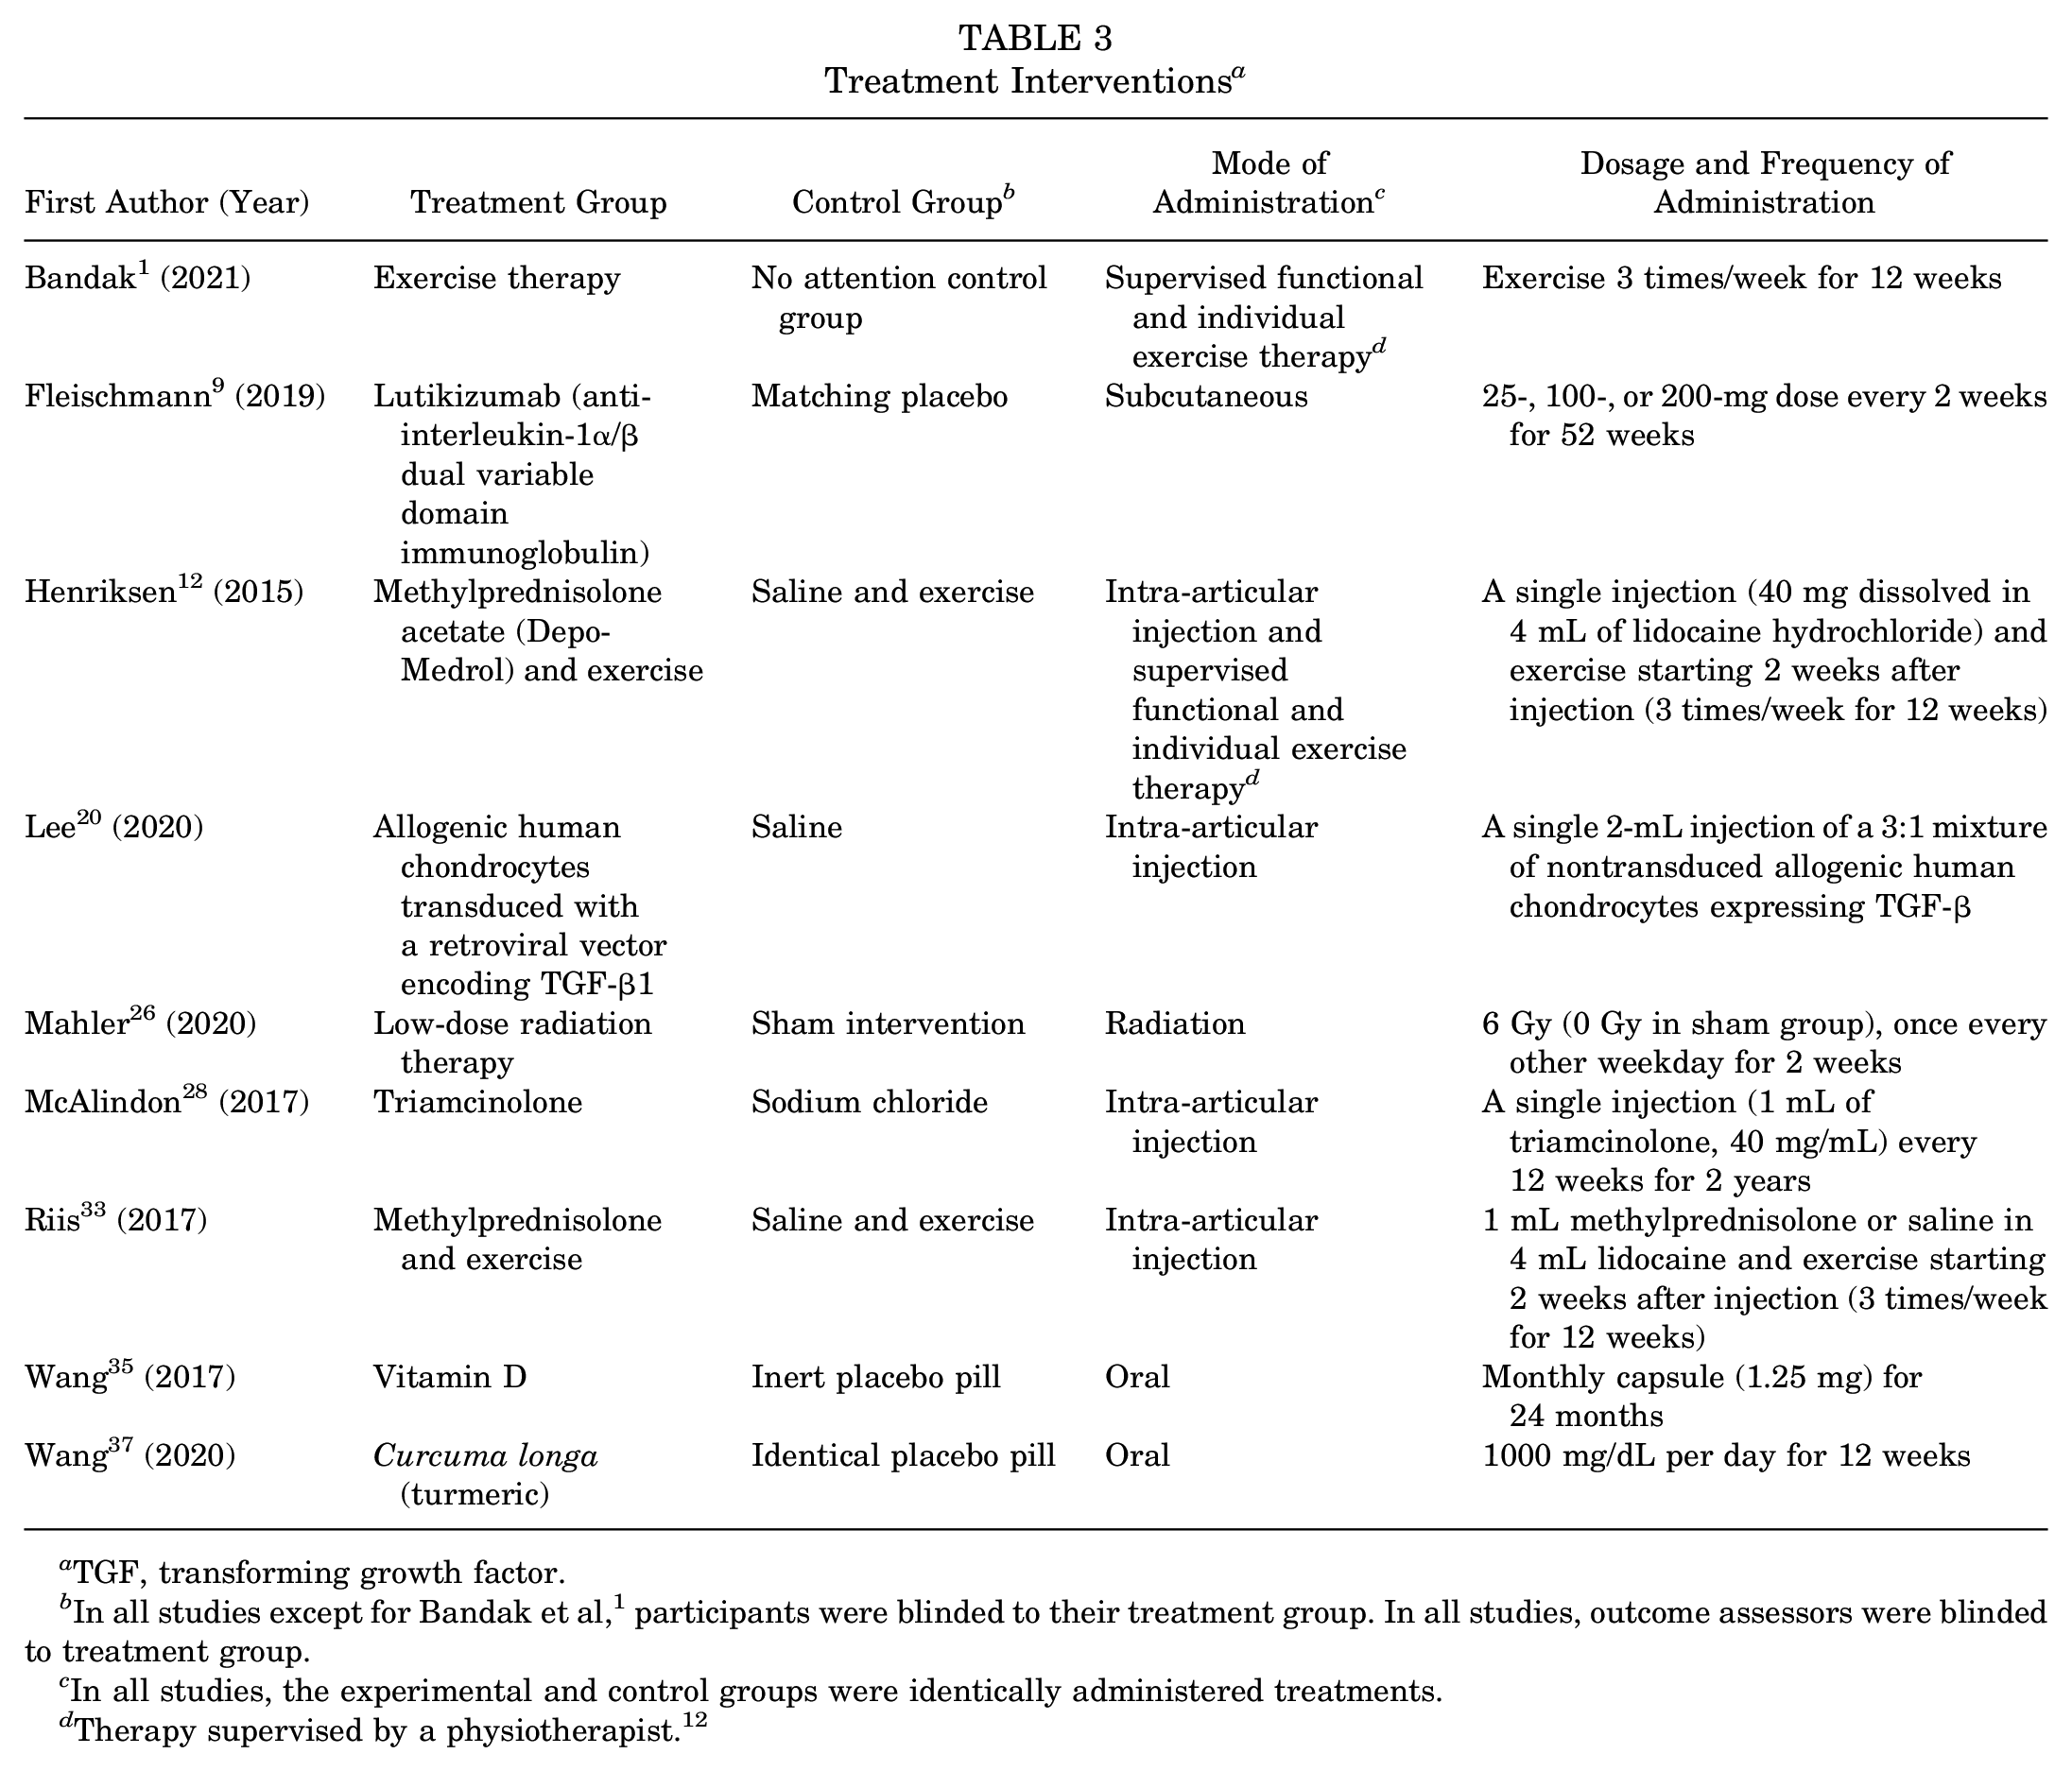
TGF, transforming growth factor.
In all studies except for Bandak et al, 1 participants were blinded to their treatment group. In all studies, outcome assessors were blinded to treatment group.
In all studies, the experimental and control groups were identically administered treatments.
Therapy supervised by a physiotherapist. 12
Two trials reported greater reduction in both pain and synovitis outcomes in the treatment group compared with the control group (Jin et al 18 and Wang et al 35 both reported results for the same trial, the Vitamin D Effect on Osteoarthritis [VIDEO] Study)1,18,35; 3 studies reported better pain outcomes but no difference in synovitis outcomes in the treatment group compared with the control group9,20,37; 1 study reported better outcomes in synovitis but no difference in pain in the treatment group compared with the control group 33 ; and the remaining studies showed no difference in either the pain outcome or synovitis outcome.12,26,28
A range of measures was used to report changes in synovitis on MRI scan, including the MOAKS (MRI in OA Knee Score),1,12,33 WORMS (Whole-Organ Magnetic Resonance Imaging Score), 9 ES volume,28,35,37 synovial membrane thickness, 9 BLOKS (Boston-Leeds OA Knee Score), 33 and contrast-enhanced and dynamic contrast-enhanced MRI (CE-MRI and DCE-MRI)1,33 (Tables 4 and 5). Further, authors assessed either ES9,28,35,37 or both ES and HS on MRI scan.1,12,20,26,33
Reported Mean Changes in Synovitis on MRI Scan a

Boldface text indicate variables with statistically significant improvement in synovitis (P < .05). AC, absolute change; AS, anterior synovium; BLOKS, Boston-Leeds OA Knee Score; CE-MRI, contrast-enhanced MRI; ES, effusion synovitis; HS, Hoffa synovitis; MRI, magnetic resonance imaging; OA, osteoarthritis; MOAKS, MRI in OA Knee Score; PA, percentage change per annum; PS, posterior synovium; SRM, standardized response mean; TS, total synovium.
The SRM was calculated by dividing the difference between means by the SD of the difference between means. The SD of difference between means were calculated by taking the square root of the sum of the SD of the treatment group squared and the SD of the control group squared.
Changes in ES volume reported as logs.
Higher scores reflect worse synovitis.
ES and HS were graded separately (0-3) for a total summed MOAKS synovitis score (0-6), with higher scores indicating worse synovitis.
Primary timepoint for MRI outcome.
Reported LSM Changes in Synovitis on MRI Scan a

CE-MRI, contrast-enhanced MRI; CI, confidence interval; ES, effusion synovitis; HS, Hoffa synovitis; LSM, least-squares mean; LSMD, least-squares mean difference; MOAKS, MRI in OA knee score; MRI, magnetic resonance imaging; OA, osteoarthritis; SRM, standardized response mean; WORMS, whole-organ MRI score.
The SD was calculated by dividing the product of the square root of the total participants in the specific group and the half-width of the CI by 1.96 (CIs were provided in the studies). If the SE was provided instead of the SD, the SD was calculated by multiplying the square root of the total participants in the specific group and the SE.
The SRM was calculated by dividing the difference between means by the SD of the difference between means. The SD of the difference between groups were calculated by taking the square root of the sum of the SD of the treatment group squared and the SD of the control group squared.
ES and HS were graded separately (0-3) for a total summed MOAKS synovitis score (0-6), with higher scores indicating worse synovitis.
Proposed by Guermazi et al 10 using postgadolinium sagittal T1-weighted turbo spin-echo MRI.
Primary timepoint for MRI outcome.
Vitamin D
The VIDEO Study, which was analyzed by Wang et al 35 and Jin et al 18 (not included in the review) was the only study that reported a significantly greater improvement in both pain and synovitis outcomes in the treatment group compared with the control group. In post hoc analyses, Jin et al 18 found that participants in the vitamin D group had a significant improvement in pain measured on visual analog scale (VAS) for pain when compared with participants in the placebo group (P = .048). Furthermore, this effect was evident only in patients with an ES score of ≥2 at baseline and not in patients without ES at baseline (ES was measured on a 0-3 scale, with higher numbers reflecting worse synovitis). Wang et al 35 reported significant group differences for both absolute change and percentage change per year in ES (P = .02 for both), with values remaining stable in the treatment group but increasing in the placebo group; however, the SRM value for synovitis was low (0.17) (Table 4). An SRM for pain was unable to be calculated because mean changes were not provided and only the P value was provided. 35 Jin and colleagues 18 reported the percentage of patients that achieved either 20% or 50% improvement in Western Ontario and McMaster Universities Osteoarthritis Index (WOMAC)-Pain subscores in the VIDEO Study (patient cohort analyzed by Wang et al 35 for changes in synovitis on MRI scan). At 24 months, 64% of participants in the vitamin D group and 57% of participants in the placebo group achieved a 20% improvement in WOMAC-Pain (P = .16), and 50% of participants in the vitamin D group and 39% of participants in the placebo group achieved a 50% improvement in WOMAC-Pain (P = .04, statistically significant difference). 18
Exercise Therapy
Bandak et al 1 reported a significant group difference in synovitis assessed on DCE-MRI in only the anterior synovium, across all measurements. These measurements included highly perfused voxels (P = .024), the initial rate of enhancement composite score (P = .044), and the maximal enhancement composite score (P = .015). The authors also reported that the exercise group had a significantly greater improvement in Knee injury and Osteoarthritis Outcomes Score (KOOS)-Pain subscores compared with the control group, with a group mean difference of -11.7 points (P = .0075) (Table 6). 1 The calculated SRM was 0.68, indicating moderate responsiveness of the outcome measure (improvement in KOOS-Pain). 4
Reported LSM Changes in Pain After Treatment a

Boldface text indicate variables with statistically significant improvement in pain (P < .05). LSM, least-squares mean; NA, not available; SRM, standardized response mean.
SDs were calculated by dividing the product of the square root of the total participants in the specific group and the half-width of the CI by 1.96 (CIs were provided in the studies). If SEs were provided instead of SDs, SDs were calculated by multiplying the square root of the total participants in the specific group and the SE. SRMs were calculated by dividing the difference between means by the SD of the difference between means. The SD of the difference between groups were calculated by taking the square root of the sum of the SD of the treatment group squared and the SD of the control group squared.
Primary timepoint for pain outcome.
The authors did not provide LSMs and SEs or SDs for either of the study groups; thus, SRMs were unable to be calculated.
Lutikizumab (Anti-Interleukin-1α/β Dual Variable Domain Immunoglobulin)
Fleischman et al 9 reported LSMDs for synovitis, with no significant improvement in synovitis after treatment (Table 5). Of the studies that reported the LSMDs in pain between treatment and control group after treatment, Fleischman et al 9 showed that a 100 mg dose of lutikizumab, an anti-interleukin-1α/β dual variable domain immunoglobulin, led to significantly improved WOMAC-Pain scores at 16 weeks (P = .050) (Table 6). The calculated SRM for this dose and timepoint was 0.22 - a low between-group effect size. 4
Allogenic Human Chondrocytes Transduced With Retroviral Vector Encoding TGF-β1
Lee et al 20 did not find significant differences between groups, although whole-knee MRI scans at 12 months showed less progression of infrapatellar fat pad synovitis and ES in the treatment group compared with placebo (9.6% vs 21.1%). Although the authors did not provide LSMs and LSMDs to calculate the SRM, they identified significant group differences in VAS pain scores at 12 and 72 weeks (P = .0119 and P = .0074, respectively) (Table 7).
Reported Mean Changes in Pain After Treatment a
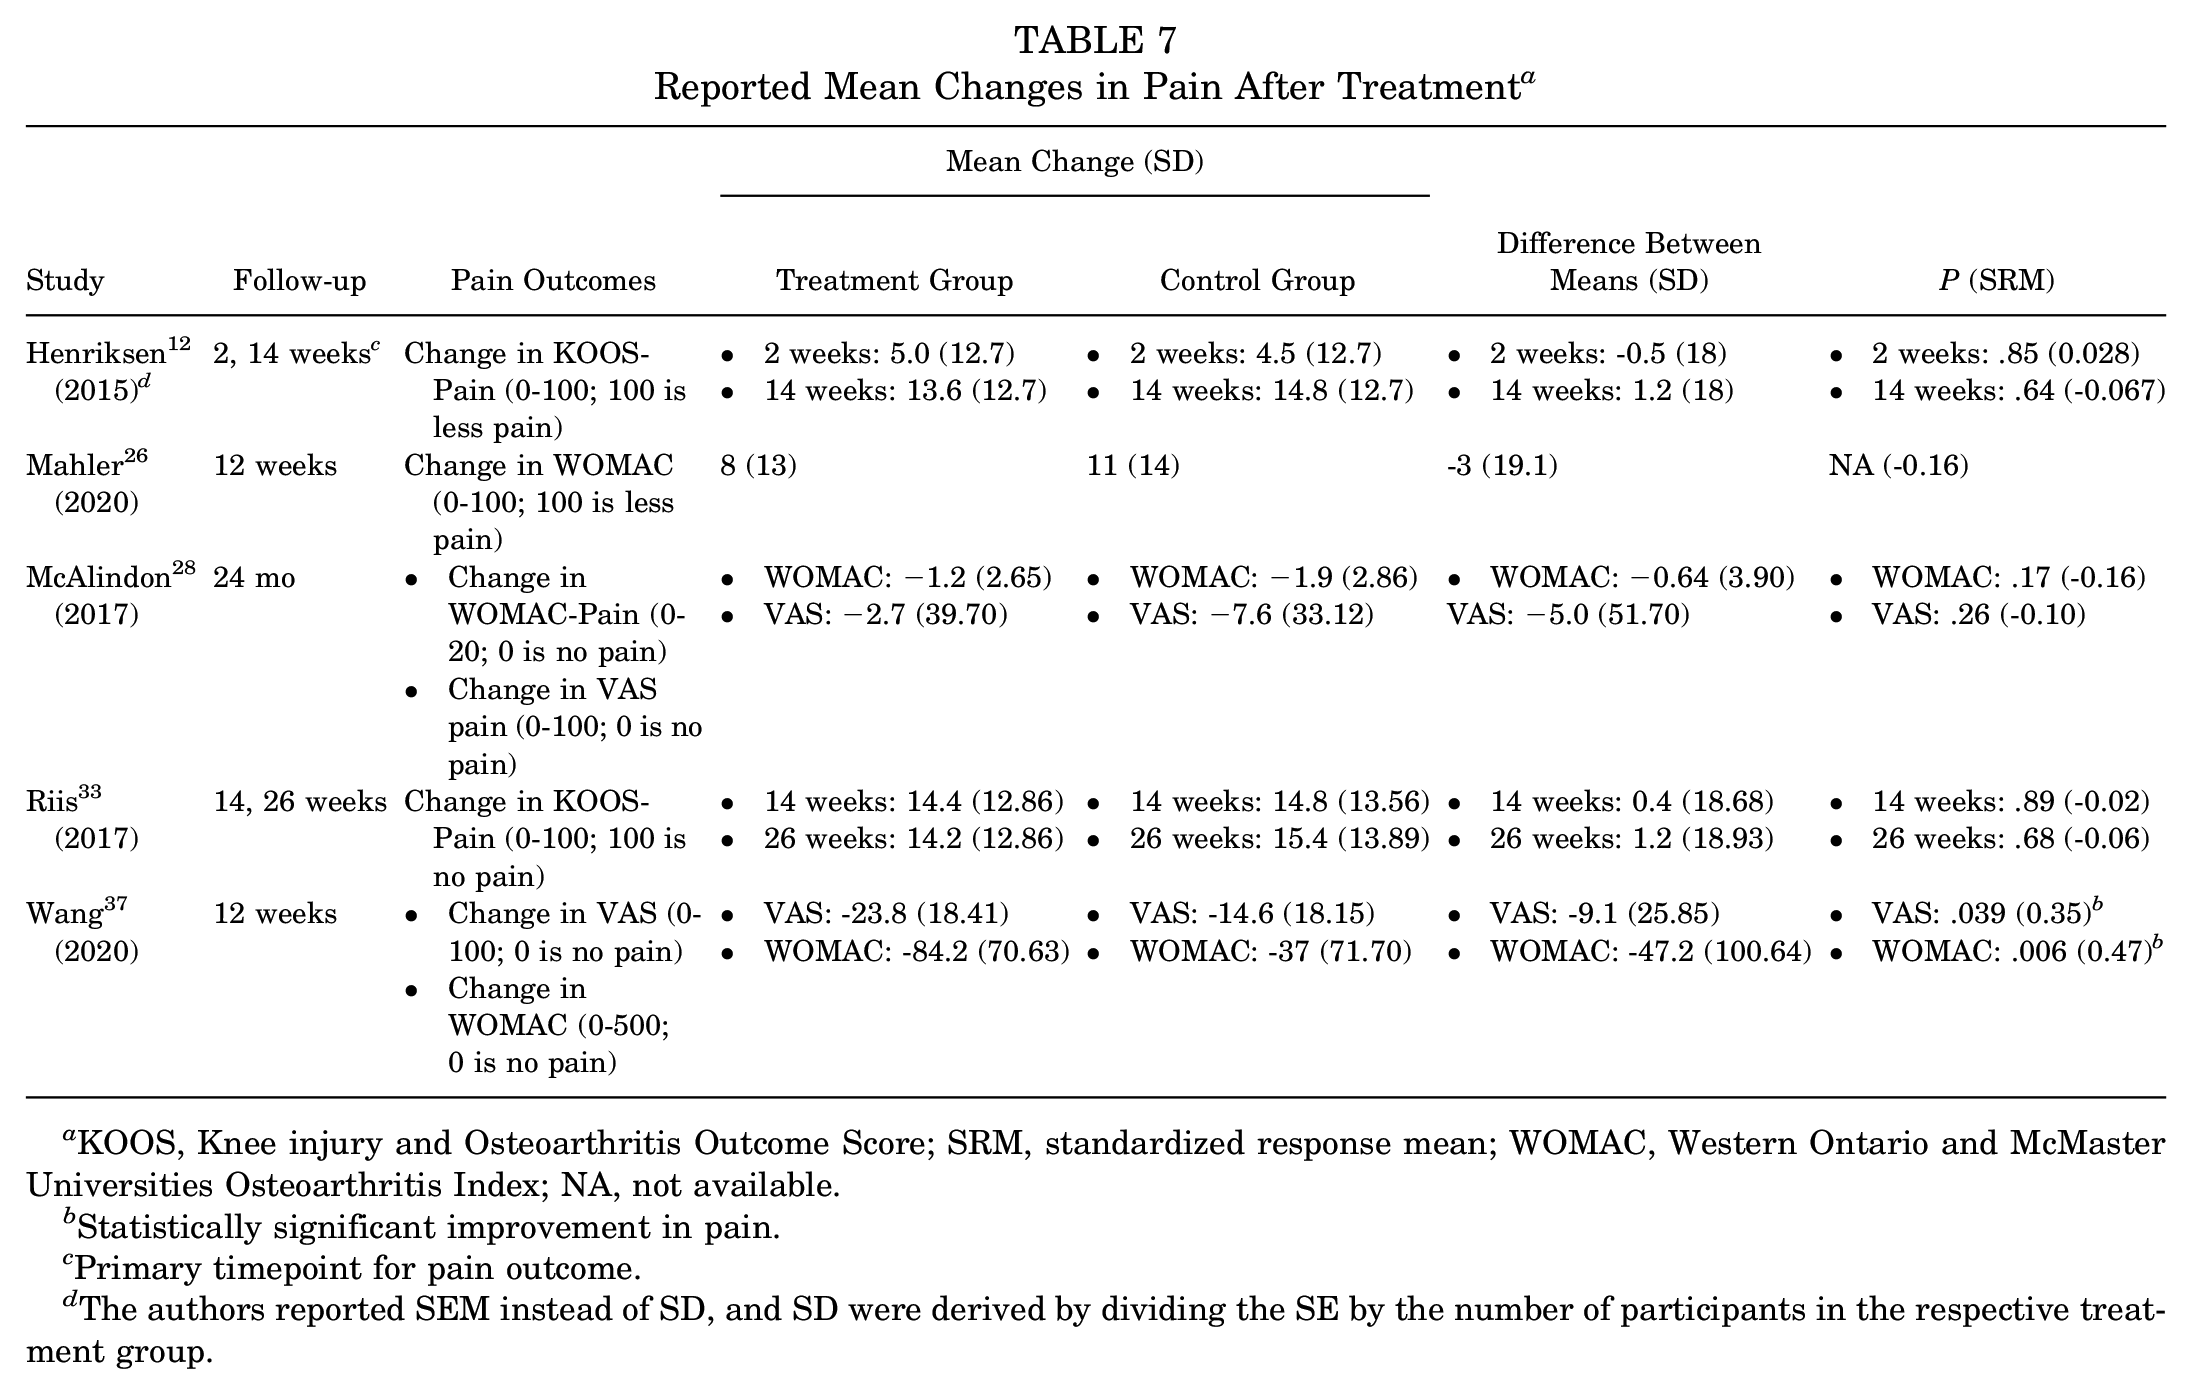
KOOS, Knee injury and Osteoarthritis Outcome Score; SRM, standardized response mean; WOMAC, Western Ontario and McMaster Universities Osteoarthritis Index; NA, not available.
Statistically significant improvement in pain.
Primary timepoint for pain outcome.
The authors reported SEM instead of SD, and SD were derived by dividing the SE by the number of participants in the respective treatment group.
Intra-Articular Methylprednisolone and Exercise
Among the studies reporting mean changes in synovitis,12,28,33,35,37 Riis et al 33 reported a significant group difference for the mean change from baseline in MOAKS for synovitis at weeks 14 and 26 (P = .01 and P = .0006, respectively) in favor of the treatment group. The authors also reported that change in synovitis on CE-MRI was significantly correlated with the change in KOOS-Pain scores at 26 weeks (r = -0.36). 33
Low-Dose Radiation Therapy
Mahler et al 26 did not find any group differences in ES and HS from the median and interquartile range values (both measured on scales ranging from 0 to 3, with higher scores indicating worse synovitis).
Curcuma longa Extract
Wang et al 37 reported significant differences in favor of the treatment group for pain on the VAS (P = .039) and WOMAC (P = .006). However, the SRMs on the VAS (SRM = 0.35) and WOMAC (SRM = 0.47) were low (Table 7).
Discussion
In this review of 9 RCTs that investigated nonsurgical treatments for knee OA,# only 2 treatments improved both pain and synovitis outcomes in comparison with the control group: vitamin D and exercise therapy.1,35 Of note, Bandak et al 1 showed a significant group difference for synovitis only when measured on DCE-MRI in the anterior synovium but not the total knee. Further, the VIDEO Study showed a significant improvement in VAS pain scores only in the vitamin D group in post hoc analyses. 18 Three different treatments showed a significant improvement in pain after treatment compared with the control group but not in synovitis; these treatments included lutikizumab, 9 allogenic human chondrocytes transduced with retroviral vector encoding TGF-β1, 20 and Curcuma longa. 37 One study reported a significant group difference in synovitis, 33 but no difference in pain in the treatment group (methylprednisolone followed by exercise) compared with the control group. These results are summarized in Table 8.
Treatments Associated With Statistically Significant Improvements in Pain and Synovitis on MRI Scan a

None of the studies included in this review reported that treatments significantly improved only synovitis on MRI scan. CDE-MRI, dynamic contrast-enhanced; MRI, magnetic resonance imaging; TGF, transforming growth factor; VAS, visual analog scale; VIDEO, Vitamin D Effect on Osteoarthritis.
Changes in VAS pain scores were only significant in the treatment group compared with the control group on post hoc analyses (P = .048). 18
Bandak et al 1 reported a significant difference between groups only when synovitis was measured on DCE-MRI in the anterior synovium.
The literature on the association between vitamin D and improvement in knee pain is conflicting. Vitamin D supplementation was shown to improve WOMAC-Pain scores in a meta-analysis that reviewed 6 studies in patients with knee OA. 39 However, a subgroup of patients with chronic knee pain were followed annually in the VITAL study, and WOMAC-Pain scores did not differ between the experimental (vitamin D) and control groups (omega-3 fatty acids) at any point during follow-up. 25 We also recognize that although vitamin D was associated with a significantly greater improvement in pain and MRI markers of synovitis compared with control (P = .02), the trial was large, and the effect size was quite small (SRM = 0.17). 35 Further, previous literature reviews summarize the relationship between multiple markers of inflammation and pain in patients with knee OA.6,27 In addition to measuring synovitis on MRI scan, these markers also include Baker’s cysts viewed on MRI scan, cytokines, and C-reactive protein. Kandemirli et al 19 reported that Baker’s cysts found on ultrasound were found more frequently in symptomatic knees and correlated with higher pain ratings on the VAS scale compared with asymptomatic knees and lower pain ratings. In our systematic review, we reported a similar finding from Riis et al, 33 who noted that changes in synovitis measured on contrast-enhanced MRI scans correlated with an improvement in KOOS-Pain scores. 33 Examining the association between pain and synovitis is difficult because there are multiple ways to measure synovitis and inflammation. For example, when synovial fluid white blood cell count and ES measured on MRI scans using the MOAKS score were compared, the sensitivity and specificity of the synovial fluid white blood cell count in identifying ES on MRI scans were limited. 24
One curious finding was elucidated in our systematic review. Bandak et al 1 reported that participants in the exercise group saw a significant improvement in synovitis variables measured on DCE-MRI in the anterior synovium in comparison with the control group. However, DCE-MRI variables for synovitis were not different between groups on the total synovium. It is unclear why anterior knee inflammation decreased after treatment more than other compartments of the knee. Further, no significant differences were seen on MOAKS or CE-MRI or in systemic proinflammatory cytokines from plasma. However, the finding by Bandak et al 1 that exercise did not affect local or systemic inflammation is supported in a trial by Messier et al 29 of obese participants with radiographic knee OA randomized to exercise, diet, and a combined regimen of exercise and diet. Plasma interleukin (IL)-6 levels (an inflammatory cytokine) did not decrease in the exercise group. 29 In a similar trial of exercise in participants with knee OA, Helmark et al 11 found that IL-10 (an anti-inflammatory cytokine) levels from synovial fluid increased significantly in the exercise group compared with the control group immediately after exercise. However, this difference in results between Helmark et al 11 and Bandak et al 1 could be due to a difference in exercise regimens. This difference could also be accounted for by the difference in measuring local inflammatory changes. Bandak et al 1 measured local inflammatory changes on MRI scans, while Helmark et al 11 measured IL-10 in the synovial fluid directly after exercise.
Limitations
We acknowledge that our systematic review has limitations. The pain scales and measurements of synovitis and inflammation on MRI scans in each study differed, rendering it difficult to compare findings across each trial. Each trial included also had a different follow-up period, which presented a challenge for comparing changes in pain and synovitis on MRI scan after treatment. In addition, each trial had a different sample size, and some of the trials had small sample sizes.26,37 This presented a challenge in comparing findings across studies. To make meaningful comparisons across studies, we calculated SRMs using mean changes and standard deviations of the mean changes, when presented, or by deriving the standard deviation from 95% CIs. This identical method was used when LSMs and LSMDs were presented. By calculating a comparable effect size across all studies, we were able to make meaningful comparisons. The studies included in this review were heterogeneous with respect to a number of design features including the outcome measure used, the intervention agent, and type of control, among others. We addressed the heterogeneity in outcome metrics by calculating standardized, unitless response means. To do this, we used mean changes and standard deviations of the mean changes when presented or by deriving the standard deviation from 95% CIs. To our knowledge, this is the first review to investigate the effects of treatments on pain and synovitis measured on MRI scans in persons with knee OA.
Conclusion
The findings in this review suggest the need for future research on the effect of knee OA treatments on pain and synovitis. Only vitamin D and exercise therapy were found to improve pain and synovitis after treatment.1,18,35 More trials are needed to validate whether vitamin D and exercise can improve both pain and synovitis in persons with knee OA. Such findings would allow researchers to identify whether synovitis is a mediator of pain in this patient population. More studies are needed to compare how different measurements of synovitis change after treatment. This summary review included only studies that measured synovitis on MRI, but studies that measured inflammation on ultrasound or with different biomarkers in blood, urine, or synovial fluid could provide rich datasets for understanding how different inflammatory phenotypes in persons with knee OA effect their pain ratings. Further, patients who experience sport- or exercise-related joint injury are at a higher risk for developing posttraumatic OA, which is associated with more rapid progression. 38 Studies that investigate treatments that slow or prevent the mechanical components of disease progression, such as joint space narrowing, in addition to pain and inflammation, would be useful for this population and have the potential to improve how these patients prevent the progression of OA.
Footnotes
Final revision submitted January 21, 2024; accepted February 23, 2024.
One or more of the authors has declared the following potential conflict of interest or source of funding: M.H.J. has received consulting fees from Regeneron Pharmaceuticals and is on the advisory board for Regeneron and Biosplice. AOSSM checks author disclosures against the Open Payments Database (OPD). AOSSM has not conducted an independent investigation on the OPD and disclaims any liability or responsibility relating thereto.