
Abstract
Background:
The limb symmetry index (LSI) is a metric of strength restoration. It is key to successfully return to sports after anterior cruciate ligament (ACL) reconstruction. The threshold for return to sports is generally considered an LSI of ≥85%.
Purpose:
To develop a statistical model for predicting the recovery of knee extension and flexion strength (with LSI ≥85%) at 6 months after ACL reconstruction.
Study Design:
Case-control study; Level of evidence: 3.
Methods:
Patients who underwent arthroscopic ACL reconstruction between November 2015 and December 2020 were included. The patients were classified into 2 groups: “pass” if the LSI at 6 months postoperatively was ≥85% and “fail” if the LSI was <85%. Factors in 25 categories with 74 levels, including patient characteristics, periarticular procedures, intra-articular lesions and treatment, and perioperative management, were collected. A multivariable logistic regression combined with backward variable elimination was used to determine the predictive parameters for recovery of knee extension and flexion strength.
Results:
A total of 948 patients were included. Graft site, preoperative isokinetic strength, treatment of meniscal injury, and injured side (left vs right) were identified as general predictors for both knee extension and flexion strength. For knee extension strength, age at injury and partial weightbearing duration were identified as additional predictors. For knee flexion strength, type of meniscal injury, surgeon volume, cartilage procedures, and periarticular procedures were identified as additional predictors. The Nagelkerke R2 of the final model was 0.178, and the c-statistic was 0.716 (95% CI, 0.676-0.754). The Hosmer-Lemeshow test indicated good calibration (P = .879).
Conclusion:
Several factors including preoperative isokinetic strength, treatment of meniscal injuries, left vs. right side and graft site were found to predict recovery of ≥85% LSI in knee extension and flexion strength. Despite the numerous factors that were analyzed, the predictive power was moderate (c-statistic = 0.716), indicating there were other nonincluded factors that significantly influence strength performance at 6 months postoperatively.
Rehabilitation after anterior cruciate ligament (ACL) reconstruction is framed by biological healing and the recovery of biomechanical performance. This culminates in a time- and criterion-based progression and return to sports (RTS). 3 In the clinical context, isokinetic knee extensor and flexor strength is used to illustrate the neuromuscular integrity and active stabilization of the joint, as it is a key criterion to determine if an athlete is ready for RTS. 13 Knee joint torques are commonly compared between the injured and the uninjured sides to detect persisting (a)symmetries. Therefore, limb symmetry indices (LSIs) remain the most commonly used criteria for RTS decision-making and are widely supported by scientific evidence.18,39,72 When deciding whether a patient is ready to accelerate their rehabilitation, an LSI of >85% in the respective test category e.g. for knee extension and flexion at 6 months postoperatively is a recognized threshold.13,67,69
Prospective and meta-analytical evidence suggests a range of factors that may be associated with proper articular and functional recovery after ACL reconstruction. The factors can be grouped into 14 major categories: (1) revision status3,6,26,37,56; (2) meniscal injuries and their respective surgical treatments separated into medial, lateral, combined and root tears14,70; (3) the primary, secondary, and tertiary graft sites 51 ; (4) existence and treatment of medial collateral ligament injuries 30 ; (5) the duration of partial weightbearing and articular movement limitation 12 ; (6) extra-articular procedures; (7) cartilage procedures; (8) surgeon experience; (9) type of anaesthesia20,74; (10) duration of surgery; (11) duration of ACL insufficiency (ie, time from injury to surgery)34,75; (12) leg dominance and type of activity 8 ; (13) anthropometrics including sex and age 54 ; and (14) psychological readiness. 71
In the current, we developed a multivariable prediction model that considered evidence-based periclinical, surgical, and patient factors to identify and quantify the variables associated with an increase or decrease in the LSI of thigh muscle strength.57,58,65 Specifically, the following objectives were addressed: (1) prediction of the future occurrence of LSI ≥85% and LSI <85% 6 months postoperatively, targeting preventive intervention; (2) discrimination of patient and clinical characteristics associated with an LSI ≥85% for knee extensors and flexors; and (3) quantification of identified predictors and their impact on the outcome knee extensor and flexor strength.
Methods
Study Population and Data Collection
After receiving approval for the study protocol from the local ethics committee, we conducted a retrospective review of patients who had sustained a traumatic ACL rupture and undergone arthroscopic ACL reconstruction at a single-center sports orthopaedic hospital between November 2015 and December 2020. The study inclusion criteria were any surgery involving an insufficiency of the ACL (eg, augmentation, repair, and reconstruction) and follow-up of at least 7 months. Exclusion criteria were not applied in this retrospective complete case design.
Isokinetic Strength Measurement
The primary outcomes were knee extension strength LSI and knee flexion strength LSI at 6 months postoperatively. LSI values are reported as percentages and were calculated as (affected limb/unaffected limb) × 100. These values were then dichotomized into two groups based on the established cutoff13,40: “pass” if the LSI was ≥85% and “fail” if the LSI was <85%.
Knee extensor and flexor strength were assessed using an isokinetic dynamometer (Humac/Norm Testing & Rehabilitation System; Computer Sports Medicine) according to Li and Wu. 43 After calibration, warmup, and 3 test trials, each participant was placed in a sitting position, the trunk at 100° leaning against the back rest of the testing table, fixed by straps across the chest and a horizontal pad over the thighs. The knee joint axis was aligned with the mechanical axis of the dynamometer. The shin pad was placed just superior to the medial malleolus.
Data were assessed during concentric-concentric contractions at 60 deg/s angular speed, in the full individual range of motion due to its high test-retest reliability. 27 Two sets of 3 repetitions with maximum effort were executed with a rest period for 1 minute. The better of the 2 sets was selected.
Predictor Variables
The patients’ data were analyzed and categorized according to a previously defined set of factors, which were selected according to the most recent literature.6,9,13,25,28,29,42,53 The final table comprised 23 categories/predictors with a total of 74 levels, organized as follows:
Patient characteristics: The age, sex, height, weight, body mass index, injured side, dominant leg, and primary type of activity performed by the patients were recorded. The types of activity were categorized into 4 groups: (1) activities of daily living; (2) low-level athletic activities; (3) straight-ahead sports; and (4) pivoting sports. In addition, the preoperative isokinetic knee strength was included when this measurement had been performed (n = 628/948 patients).
Operative characteristics: The experience of the surgeon was divided into high (>30 ACL reconstruction procedures per year), medium (10-30 procedures per year), and low volume (<10 procedures per year). The time between injury and surgery was extracted and clustered in 3 groups: (1) acute (<6 weeks); (2) subacute (6 weeks to 6 months); and (3) chronic (>6 months). The surgery duration was assessed in minutes. The anesthesia used was divided into general and spinal. ACL surgery type was noted as primary or revision. If it was a revision, the tendon used during the primary surgery was noted. The graft site was subdivided as follows: (1) isolated semitendinosus (ST) tendon; (2) semitendinosus and gracilis (ST-G) tendon; (3) allograft; (4) quadriceps tendon; (5) contralateral ST tendon; (6) dynamic intraligamentary stabilization 1 ; (7) remnant augmentation using gracilis tendon; and (8) bone–patellar tendon–bone (BPTB).
Associated lesions and treatment; postoperative management: The types of meniscal injury were divided into (1) none, (2) medial, (3) lateral, (4) medial and lateral, and (5) root tears. Meniscal treatment was divided into (1) no intervention, (2) meniscal repair, (3) root repair, and (4) partial meniscectomy. Medial collateral ligament (MCL) injury was categorized as (1) none, (2) grade 1 or 2 tear, and (3) grade 3 rupture. Cartilage treatment included (1) debridement and trimming of superficial cartilage flaps, (2) microfracture, (3) autologous cartilage transplantation (ACT), and (4) membrane-associated cartilage induction (MAC). Additional extra-articular procedures included (1) no additional procedures (partial synovectomy, resection of scar tissue, and resection of the plica mediopatellaris were included as “no additional procedure” during statistical analysis because the exact differentiation or a quantification of these interventions was not possible retrospectively and they were considered irrelevant to the postoperative proceedings); (2) anterolateral ligament reconstruction (modified Lemaire); (3) high tibial osteotomy; (4) lateral collateral ligament reconstruction (modified Larson); and (5) medial patellofemoral ligament reconstruction using gracilis tendon autograft. The duration of partial weightbearing (15 kg) was divided into (1) full weightbearing within the first week, (2) up to 4 weeks, and (3) >4 weeks. The range-of-motion limits were categorized as (1) no restriction; (2) 2 weeks at 30°, 60°, and 90° each, using a stabilizing orthosis; and (3) 3 weeks at 45° and 90° each, also wearing an orthosis.
Rehabilitation Protocol
Standardized postoperative treatment was achieved by a homogenous, controlled, time-and evidence-based rehabilitation protocol. It was identical for all patients and executed with both the injured and noninjured legs as previously published.60,76 The criterion-based rehabilitation scheme of the present study contained a clustering into 4 phases with a progressive therapy algorithm respecting the vulnerability of the bony and ligamentous tissue. Exercises ranged from monoarticular passive treatment to multiarticular active strengthening up to functional tasks with high load.60,76 Patients and therapists followed written information about the procedure, exercises, and progress criteria by the surgeon. For each of the included participants, rehabilitation protocols were checked for consistency, and compliance of the patient was controlled by the physiotherapist.
Candidate Predictors
Candidate predictors were chosen based on the following criteria: those found to be significantly and consistently associated with outcomes in previous literature 4 and those potentially clinically relevant based on the physicians’ clinical experience.5,14,22,23,70 Two candidate predictors were excluded because they were highly correlated (correlation coefficient r > 0.8) to each other. The primary tendon used in graft ruptures was excluded because of its high correlation with the factor revision, and age at injury was also highly correlated with the age at surgery, which is why the latter was excluded.
Statistical Analysis
The TRIPOD (Transparent Reporting of a multivariable prediction model for Individual Prognosis Or Diagnosis) statement 15 was followed for the development of the model.
Missing Data
The missing-at-random assumption was fulfilled, which infers that the probability of data missing for a particular variable is not influenced by the data itself. Hence, missing data were handled using multiple imputation using the mice package in R (The R Project for Statistical Computing, version 4.1.1). 66 Following the recommendations for handling missing data, 36 we constructed 50 imputed data sets, because 50% of the cases had at least 1 missing value, which mainly was the preoperative isokinetic knee strength measurement. Predictive mean matching was used to impute continuous variables. Logistic and polytomous regression were used to impute binary and categorical data, respectively. The imputed data's accuracy and acceptability were assessed using distribution plots and propensity plots. All further analyses were pooled over the imputed data set.
Sample Size Estimation
To avoid model overfitting, a rule of thumb for binary logistic regression analysis is that roughly 10 events (patients who RTS) are necessary per predictor variable.31,55 The sample size needed was calculated based on the number of predictors in the model. We wanted to test 23 predictor variables in the model; thus, we needed at least 230 events.
Descriptive Statistics
Descriptive statistics were reported as means with standard deviations (SD) for normally distributed continuous variables and medians with interquartile ranges for non-normally distributed data. Categorical variables were reported as frequencies and percentages.
Modeling
A multivariable logistic regression analysis was performed to evaluate the relationship between the predictors and each outcome in each imputed data set to preserve data integrity and prevent bias induced by imputation. 45 In each case, all candidate predictors were considered in the global model, and a backward stepwise selection method was used, with an entry and removal P value of .157 according to the Akaike information criterion.15,33 This threshold, adopted from Heinze et al, 33 was chosen to avoid overfitting of the model, meaning that only variables with a relatively stronger relationship with the outcome were included in the final model. The pooling method used during predictor selection was the pooled sampling variance (D1) method, so as to pool the imputed data and then decide which variable was to be included in the final model.21,50 The linearity assumptions of continuous variables were evaluated and when the assumption was not met, restricted cubic splines were added to the model. A nomogram was constructed to facilitate easy calculation of risk scores and probabilities of RTS.
Statistical analysis was performed in R Studio Version 4.1.1 (Posit PBC). Model development and internal validation were performed with R-package psfmi Version 1.0.0 35 ; and nomogram construction was performed using R-package rms. 32
Calibration and Model Performance
Calibration is defined as the extent to which the model correctly estimates the absolute risk; this was evaluated using the Hosmer-Lemeshow goodness-of-fit statistic tests in each of the imputed data sets. 2 A P value of >.10 was considered evidence of good calibration (ie, the model fits the observed data). 31 In addition, model calibration was assessed by plotting predicted individual outcomes against observed outcomes. Here, participants were grouped into deciles based on their predicted probability for RTS. The prevalence of the endpoint within each decile represents the observed probability.
The model performance was evaluated across the imputed data sets as the explained variance or overall performance using the Nagelkerke R2, and the discriminative performance using the area under the curve (AUC; c-statistic). The discriminative performance of the model was considered acceptable if the AUC (c-statistic) was ≥0.7 and good if the AUC was ≥0.8.
Shrinkage
To correct overfitting of the final model, the estimated slope value (after cross validation) was used as a shrinkage factor that was multiplied with the pooled coefficients, and a new intercept value was determined that aligned with the shrunken coefficients.
Internal Validation and Adjusted Performance Measures
Each model was internally validated using cross-validation. In each imputed data set, 5 folds samples were drawn. In each sample, the developed model was re-estimated using backward stepwise selection. 32 The performance was evaluated and pooled using Rubin's rules.45,61
Sensitivity Analysis
A complete case analysis was performed for all outcome variables as a sensitivity analysis.
Results
Sample Characteristics
A total of 948 patients were included in the study. Of these patients, 356 (38%) successfully achieved ≥85% in LSI for knee extension strength; 464 patients (49%) remained <85% in LSI for knee flexion strength. Table 1 shows the data for the predictor variables and the percentage of missing data in each potential variable.
Distribution of the Potential Predictors of Achieving ≥85% in LSI in Isokinetic Strength at 6 Months Postoperatively a

Data are presented as n (%), mean ± SD, or median (IQR) unless otherwise indicated. ACLR, anterior cruciate ligament reconstruction; ACT, autologous cartilage transplantation; ALL, anterolateral ligament; BPTB, bone–patellar tendon–bone; IQR, interquartile range; LCL, lateral collateral ligament; LSI, limb symmetry index; MAC, membrane-associated cartilage induction; MCL, medial collateral ligament; MPFL, medial patellofemoral ligament; ROM, range of motion; ST, semitendinosus; ST-G, semitendinosus and gracilis.
Examples: walking, hiking.
Examples: running, cycling, cross-country skiing.
Examples: football, skiing, handball.
Model Development, Performance, and Internal Validation
All patient-reported and physician-reported predictors were used in the model. For an overview and negative and positive predictive factors, refer to Figures 1 and 2.

Plot showing odds ratios of the isolated factors predicting LSI ≥85% for knee extension strength at 6 months postoperatively. LSI, limb symmetry index; MM, medial meniscus; QT, quadriceps tendon; ST, semitendinosus.

Plot showing odds ratios of the isolated factors predicting LSI ≥85% for knee flexion strength at 6 months postoperatively. LSI, limb symmetry index; QT, quadriceps tendon; ST, semitendinosus.
Model for LSI Knee Extension Strength
The final model consisted of 6 predictors: medial meniscal treatment; graft site; partial weightbearing; preoperative isokinetic strength of the injured leg; injured side (left vs. right); and age at injury. The pooled regression coefficients, standard errors, odds ratios as well as the manually optimized and corrected regression coefficients of the final model are shown in Table 2. The Nagelkerke R2 was 0.18, and the c-statistic was 0.72 (95% CI, 0.68-0.75). The Hosmer-Lemeshow test showed a P value of .879.
Regression Coefficients of the Internally Validated Model for Knee Extension Strength LSI a
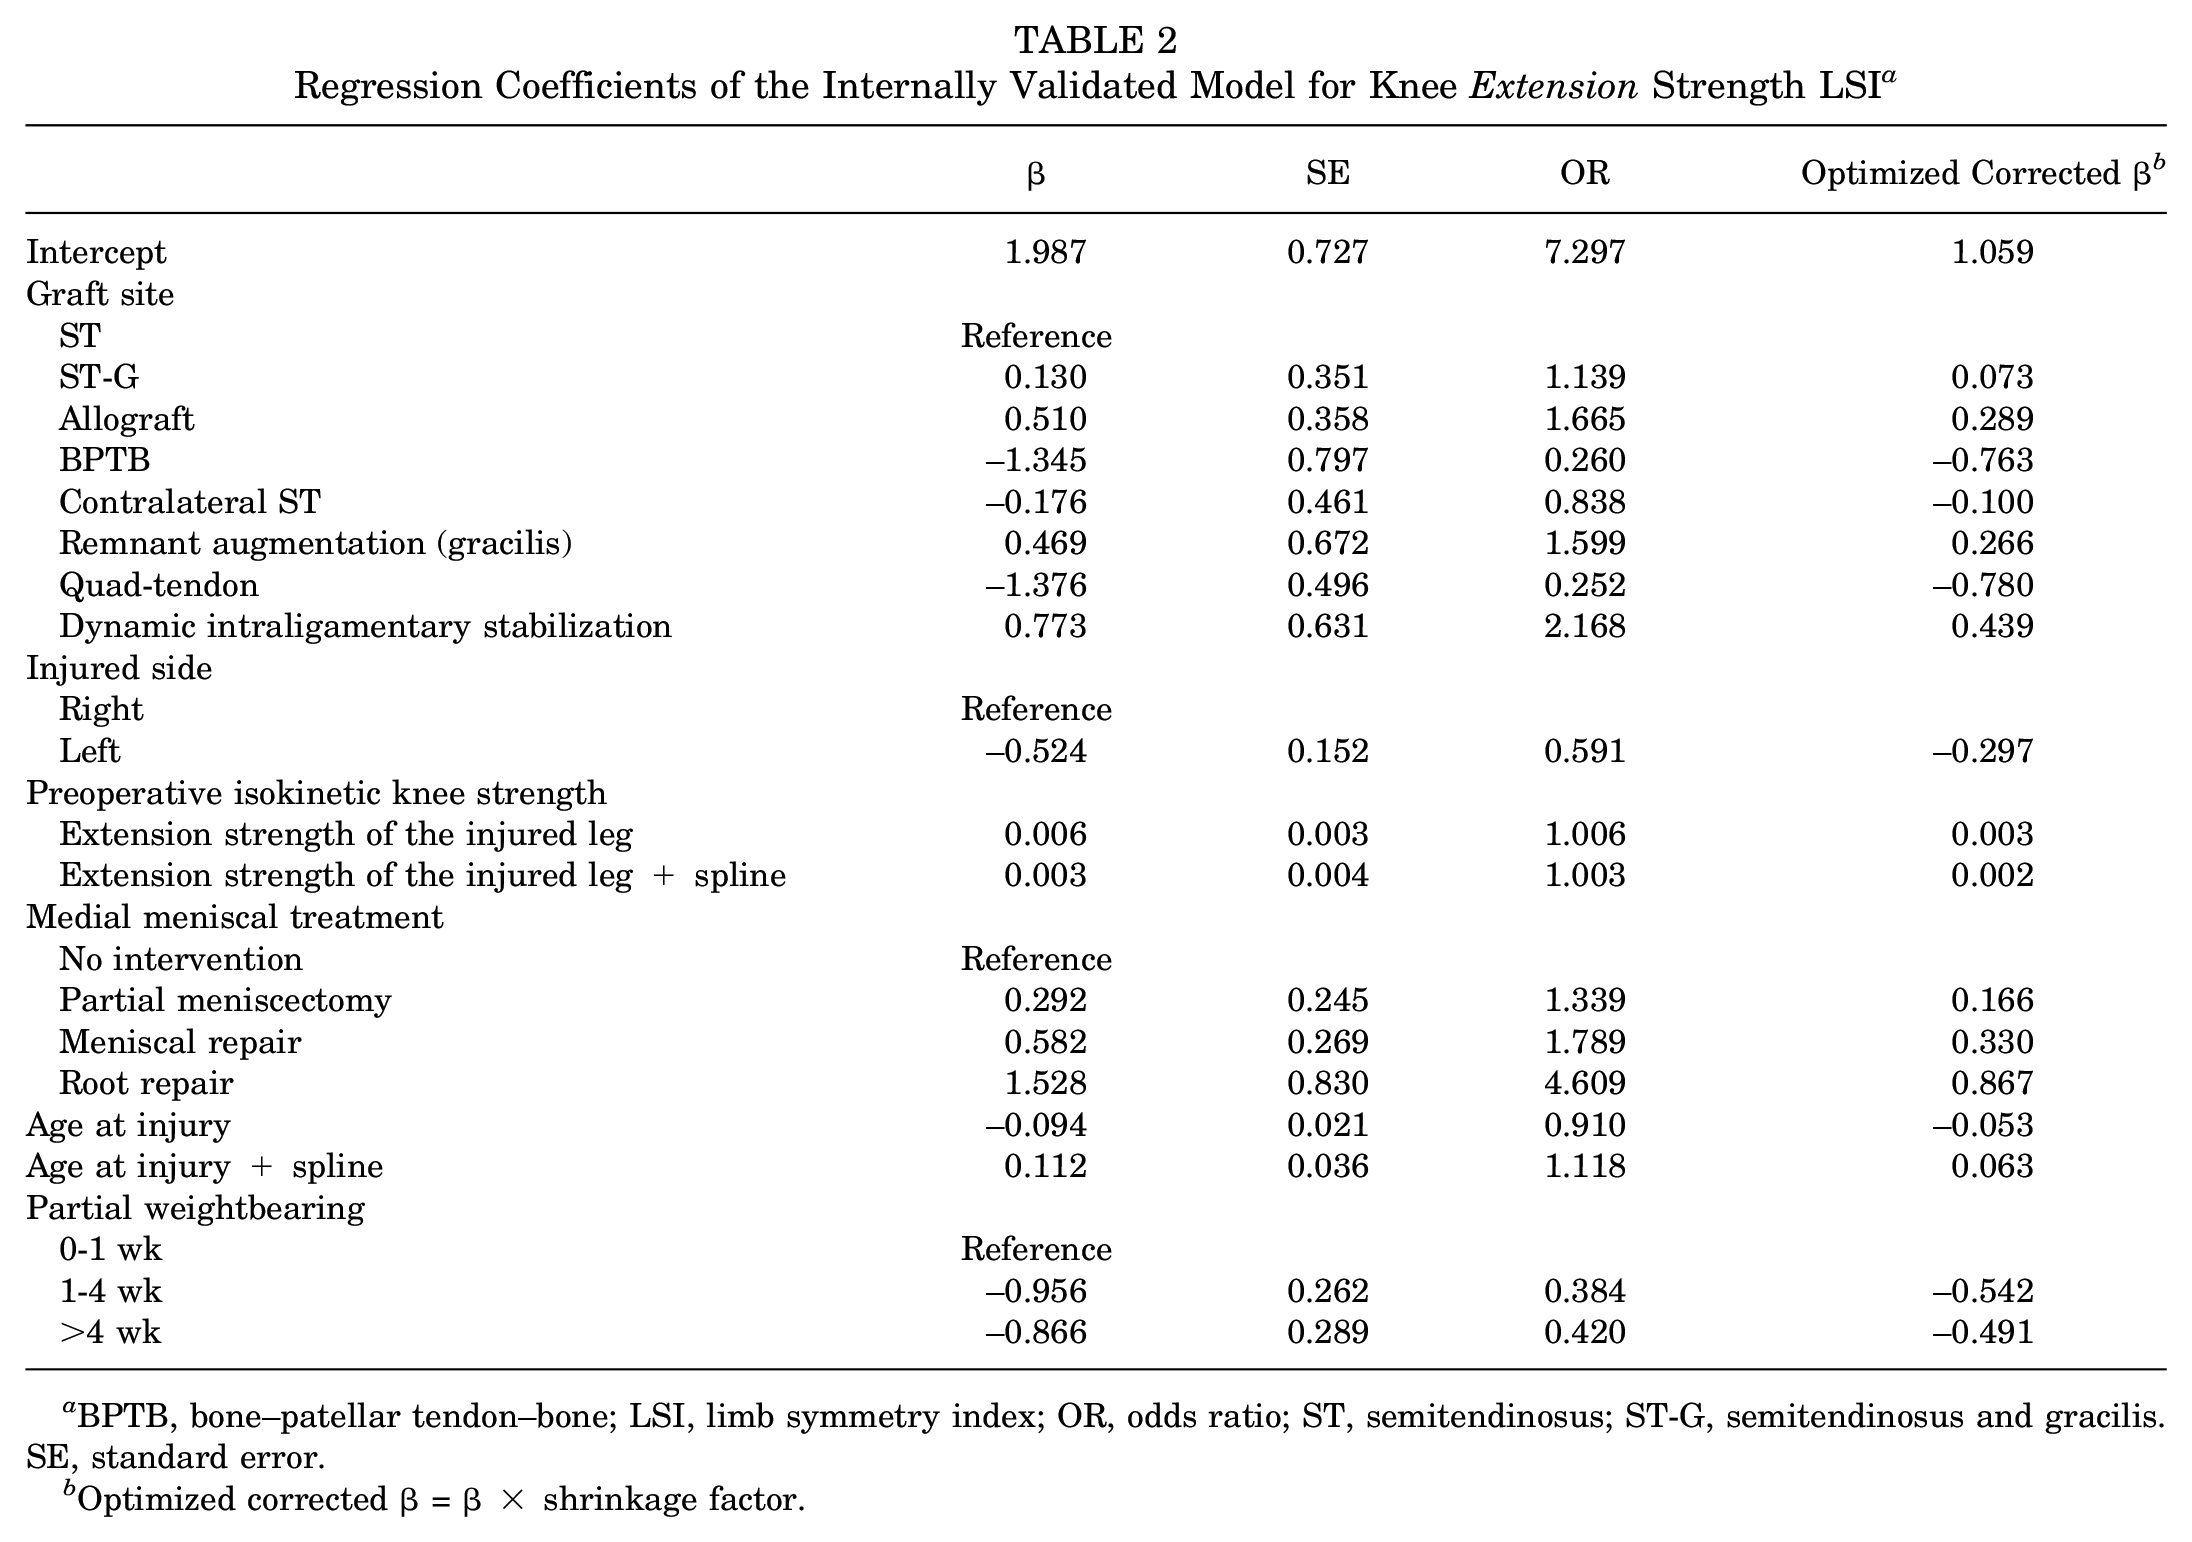
BPTB, bone–patellar tendon–bone; LSI, limb symmetry index; OR, odds ratio; ST, semitendinosus; ST-G, semitendinosus and gracilis. SE, standard error.
Optimized corrected β = β× shrinkage factor.
Model for LSI Knee Flexion Strength
The final model consisted of 8 predictors: injured side (left vs right); treatment of lateral meniscal injury; graft site; surgeon volume; preoperative isokinetic flexion strength of the injured leg; type of meniscal injury, additional intervention, and cartilage intervention. The pooled regression coefficients and standard errors and odd ratios of the final model are shown in Table 3. The Nagelkerke R2 was 0.18, and the c-statistic was 0.71 (95% CI, 0.66-0.74). The Hosmer-Lemeshow test showed a P value of .954.
Regression Coefficients of the Internally Validated Model for Knee Flexion Strength LSI a

BPTB, bone–patellar tendon–bone; LSI, limb symmetry index; MAC, membrane-associated cartilage induction; MPFL, medial patellofemoral ligament; OR, odds ratio; ST, semitendinosus; ST-G, semitendinosus and gracilis. SE, standard error.
Optimized corrected β = β× shrinkage factor.
Internal Validation
The optimized and corrected regression coefficients and intercepts are shown in Tables 2 and 3. The optimized-corrected Nagelkerke R2 and c-statistic were 0.10 and 0.66 (95% CI, 0.61-0.70), respectively, for the model for knee extension strength and 0.06 and 0.65 (95% CI, 0.60-0.69), respectively, for the model for knee flexion strength.
Model Application
As an example, we include the following application of the calculation (optimized-corrected β-coefficients) of failing or passing knee extension strength LSI at 6 months postoperatively. A 35-year-old patient sustained an ACL injury on the left knee and underwent a hamstring ACL reconstruction and a suture of a medial meniscal tear. The preoperative isokinetic knee extension strength was 150 N·m. Postoperatively, the patient was partially weightbearing for 3 to 4 weeks.
The final odds radio for achieving an LSI of ≥85% can be calculated for this individual case using the following formula: 1.059 – 0.053 × 35 [age at injury] + 0.063 × 35 [age at injury spline] – 0.297 [injured side, left] + 0.073 [graft type, hamstring (ST-G)] + 0.330 [meniscal repair] – 0.542 [partial weightbearing, 1-4 weeks] + 0.003 [preoperative isokinetic strength, injured leg] + 0.002 [preoperative isokinetic strength, injured leg spline] = 1.723
Discussion
In this study, graft site, preoperative isokinetic knee strength, and treatment of meniscal injury and injured side (left vs right) were identified as general predictors for recovery of both knee extension strength and flexion strength (LSI ≥85%) at 6 months after ACL reconstruction. For knee extension strength, age at injury and duration of partial weightbearing were identified as additional predictors. For knee flexion strength, meniscal injuries, surgeon volume, cartilage procedures, and periarticular procedures were identified as additional predictors.
Isokinetic strength is among the most broadly investigated outcomes after ACL reconstruction, and it correlates well with perceived function and potential risk of reinjury.4,17,57,58 Frequently around six months after ACL reconstruction, a medical diagnostic test is carried out to decide whether sport-specific training at a higher intensity is possible.10,13,17,64 It is noteworthy that the factors predicting the likelihood of the LSI existing do not necessarily represent a causal relationship. The predictive model must be applied as the sum of the individual factors. The general factors that determine the LSI of the knee extensors as well as the flexors are presented individually below.
Predictors for Knee Extension and Flexion Strength
Graft Site
With regard to postoperative strength deficits, the graft choice has been the most widely investigated factor. 57 Comparable to the findings in the literature, 57 the grafts from the extensor muscles (BPTB, quadriceps tendon) negatively affected LSI in extension strength, while hamstring tendon autografts had a negative effect on the odds of passing flexion strength LSI (see Tables 2 and 3). In line with this observation was the fact that harvesting the contralateral ST had a positive impact on flexion strength LSI; however, it needs to be kept in mind that the contralateral ST is harvested mainly in revision ACL reconstruction, which may confound the effect.
Injured Side
The finding that patients undergoing ACL reconstruction on their left leg had poorer odds to clear LSI at 6 months seems to be novel to the literature. Although discussions on the role of leg dominance, including the sidedness in asymmetric sports, have been present in recent studies,8,48,72,77 there is little evidence about the left leg being less favorable in the recovery of limb symmetry. Two findings can be derived from the general studies dealing with the imbalance of power between the sides: first, the dominant limb in pivoting sports has greater strength, while second, the nondominant limb responds quicker to strength training after injury.7,19,68 However, the distribution of left versus right and dominant versus nondominant was not significantly different between the groups of this study; therefore, this observation requires further research.
Preoperative Isokinetic Strength
The predictive value of preoperative strength has been investigated with regard to the best timing of surgery, since the initial injury reduces the ability to activate the periarticular muscles, which is suspected to delay the early phase of postoperative recovery.16,41,59 Preoperative quadriceps strength has been identified as a predictor for subjective and objective knee function for as long as 2 years after ACL reconstruction.16,38,59,60 This was underlined by the findings of the current study and can be applied to limb symmetry in knee flexion and extension strength as well. Furthermore, these findings show that preoperative function is also a major predictor for the recovery of objective function, which, in terms of patient-reported outcomes, has been shown to maintain its predictive value for as long as 10 years. 63
Meniscal Injury and Treatment
Interestingly, medial meniscal injury was found to be a predictor for knee extension strength, while lateral meniscal injury and treatment was of predictive value for knee flexion strength. Even though meniscal repair seemed to be favorable in terms of the recovery of LSI, this effect was outweighed by the negative effect of partial weightbearing, which has a very high collinearity with medial meniscal repair. On the other hand, partial meniscectomy effectively increased the odds of achieving an LSI ≥85% because it is generally not followed by a longer period of partial weightbearing. The effect of meniscus root tears and root repair should be interpreted with caution because of the low number of absolute cases (9 medial and 27 lateral root tears) and thus a comparably high standard error. It has previously been shown that meniscal repair in general does not decrease the ability to recover thigh muscle strength.42,73 However, combined medial and lateral meniscal injury was found to have a negative impact on achieving an LSI ≥85%, which is in line with previous findings. 73
Predictors for Knee Extension Strength Only
The factors age at injury and the duration of partial weightbearing significantly predicted the outcome variable knee extension strength LSI ≥85% in addition to the aforementioned general factor. Concerning the factor of patient age, evidence in the literature confirms that the performance and outcome are not altered in patients aged >50 years; however, the age at injury in this study reduced the odds of achieving ≥85% symmetry of knee extension at 6 months. 62 The detrimental effect of partial weightbearing on muscular strength has been described before and was found in this study as well. 46 The finding that a period of up to 6 weeks of partial weightbearing affects patient outcomes 6 months later, despite extensive later rehabilitation, underscores the importance of this initial restriction. 54
Predictors for Knee Flexion Strength Only
Factors including surgeon volume, cartilage intervention, and periarticular procedures significantly predicted the outcome variable knee flexion strength LSI ≥85% in addition to the aforementioned general factor. Notably, microfracturing and all of the other additional procedures had a negative effect on the odds of achieving an LSI ≥85% in flexion strength. Although scar tissue and irreparable cartilage lesions may generally be associated with a greater degree of joint degeneration, 49 the other procedures entail different load and movement restrictions during the early phase of rehabilitation. However, it cannot be inferred from these results that the procedure itself is causative for this observation. Possibly, it is also the necessity of any of these procedures due to the severity of the pathology or the initial impact that may cause these unfavorable odds. The effect of surgeon volume may be a result of selection bias, as surgeons who operate less frequently may preferably perform more isolated ACL reconstructions as a standard procedure as compared to surgeons with a high volume who execute more complex surgeries.
Factors Not Included in the Prediction Model
Aiming at the best possible prediction, this study used backward elimination to identify the most powerful factors. Nevertheless, it is noteworthy to consider the factors that did not seem to play an important role in predicting an LSI of ≥85%. Even though current evidence suggests that postoperative care and recovery in revision ACL surgery is slower than in primary ACL reconstruction,37,47 revision surgery did not turn out to be a necessary predictor in this present work. When considering the findings of the Multicenter Orthopaedic Outcomes Network 63 (MOON) and Multicenter ACL Revision Study 44 (MARS) studies, it may be concluded that revision ACL reconstruction has a negative long-term effect; however, second-stage ACL reconstruction was not a significant predictor of failing RTS at 6 months. In addition, we had summarized the primary graft sites in second-stage ACL ruptures, but neither of the reruptured grafts could be identified as predictive factors. Although it has been shown that female sex is linked to a worse perceived function at 10 years, 11 sex did not appear to have predictive value in our study.
Leg dominance and potential physiological asymmetries in certain sports have found little consideration in RTS research, even though recent studies have raised the discussion whether RTS criteria of limb symmetry need to be interpreted with respect to individual sidedness.8,18,52 In the present analysis, it was not of predictive value whether the injury was on the dominant or non-dominant leg, which is in line with current observations. 24 In the study by Farmer et al, 24 there was a significant difference in hop test symmetry but not in isokinetic quadriceps strength. This allows for the interpretation that isokinetic strength can be equally trained for during the 6 months of rehabilitation, while hop testing still shows asymmetries due to limb preference that are highly relevant when deciding upon RTS.
Limitations
Looking at a single factor is preliminary and potentially suggestive, but a causal relationship cannot be inferred from this prediction model, and the final odds ratio should only be applied based on the overall study results. Another limitation is the imputation of data into the prediction model, which always carries a risk of bias, especially for variables that are underrepresented in the original data set. A few of the levels or categories had a small number of cases despite the >900 cases in total. Essentially, this may limit the statistical relevance of these factors due to the small sample. Another limitation is the lack of different functional testing as factors, such as balance and jumping tests that are considered important to resuming functional readiness for RTS 6 months postoperatively.
Conclusion
The findings of this study illustrate the complexity of postoperative recovery of thigh muscle strength after ACL reconstruction. Preoperative strength, age, and the duration of partial weightbearing were found to predict a recovery of LSI ≥85%. However, the c-statistic of approximately 0.72 shows that there must be several nonincluded factors influencing the recovery of strength. Several factors reflecting upon the magnitude of the injury, the restoration of the structural integrity of the joint, or perioperative decision-making as included in this study only constitute a minor part of later functional performance.
Footnotes
Acknowledgements
The authors thank Janine Riesterer, Aurora Giuliani, and Max Behrens for their support throughout the data-acquisition and analysis process.
Final revision submitted December 13, 2023; accepted February 2, 2024.
One or more of the authors has declared the following potential conflict of interest or source of funding: This study was partially financed by Praxisklinik Rennbahn M.W. was supported by the Berta-Ottenstein Program for clinician scientists of the Faculty of Medicine at the University of Freiburg. AOSSM checks author disclosures against the Open Payments Database (OPD). AOSSM has not conducted an independent investigation on the OPD and disclaims any liability or responsibility relating thereto.
Ethical approval for this study was obtained from Ethikkommission Nordwest und Zentralschweiz (ref No. 2017-01825).