
Abstract
Background:
Adequate graft size and length are crucial factors in anterior cruciate ligament (ACL) reconstruction. Accurate identification of patients who may be at risk for an insufficient length or size of the hamstring tendon (HT) can aid surgeons in preoperative planning.
Purpose:
To evaluate whether magnetic resonance imaging (MRI) or ultrasound could more accurately predict the size of the semitendinosus tendon (ST) and gracilis tendon (GT) and to investigate the correlation between anthropometry, graft size, and imaging measurements to find a predictive formula.
Study Design:
Cross-sectional study; Level of evidence, 3.
Methods:
Included in the study were 36 patients who underwent ACL reconstruction with HT autograft at our institution between July 2021 and May 2022. Anthropometric data and MRI and ultrasound measurements were collected preoperatively. The length and diameter of the HT were recorded intraoperatively. Correlations between anthropometry, graft size, and imaging measurements were analyzed. Linear regression analysis was performed to construct a prediction formula.
Results:
The intraoperative graft diameters of the ST and GT were weakly to moderately associated with their cross-sectional areas as measured by MRI and ultrasound. MRI and ultrasound interpreted 11.9% to 15.7% and 18.4% to 41.7% of the variation in the graft diameter of the HT, with an accuracy of 50.0% to 55.6% and 69.4% to 86.1%, respectively. The intraoperative lengths of the ST and GT were both associated with patient height and tendon lengths as measured by ultrasound. Additionally, intraoperative GT length was associated with patient weight. Four formulas combining relevant anthropometric parameters and imaging measurements were calculated from multilinear regression analysis, explaining up to 46.3% of the variance in the size of HT.
Conclusion:
Ultrasound and MRI alone showed limited ability to predict the graft diameter of the ST and GT, while ultrasound could more accurately predict the graft size than MRI. Among the different anthropometric variables, height was the most influential in predicting tendon length.
Numerous factors influence the failure rate of anterior cruciate ligament (ACL) reconstruction, including surgical techniques and the type and size of the graft.15,24,25 Hamstring tendon (HT) autografts have been frequently used in ACL reconstruction for >20 years.16,19 Due to considerable anatomic variation among individuals, it is often difficult to predict the diameter and length of the autograft. 30 This difficulty may affect the surgical procedure, as the use of an undersized graft should be avoided. Smaller graft size could lead to an increased risk of graft failure,6,22,27 leaving patients to undergo a revision surgery. Therefore, accurate identification of patients who may be at risk for an insufficient autograft can aid surgeons in preoperative planning. For example, if predictive factors indicated that the size of the semitendinosus tendon (ST) or gracilis tendon (GT) may be insufficient, the peroneus longus tendon, quadriceps tendon, or a bone-tendon-bone autograft could be planned as a supplement. 32
Though the results have been conflicting, researchers have attempted to predict graft size preoperatively using anthropometry5,12 or various imaging techniques.2,5,9 Among the different imaging techniques, magnetic resonance imaging (MRI) has been found to be more accurate than patient demographics to predict the size of autograft.1,6 Despite its potential advantage of accuracy over demographics, measurements on MRI could be affected by the degree of magnification or the image resolution, 3 and sole reliance on MRI measurements still has some potential limitations due to considerable variability. 1 Additionally, MRI is a relatively expensive examination due to the cost of image acquisition. Recently, ultrasound has begun to attract attention for preoperative measurement of the autografts due to its easy availability and cost-effectiveness.18,23
This study aimed to (1) evaluate whether MRI or ultrasound could more accurately predict the size of the HT and (2) find a formula integrating all potentially relevant parameters to predict autograft size. We hypothesized that (1) ultrasound would more accurately predict tendon size and (2) a formula combining imaging measurements and patient characteristics would be able to predict tendon size.
Methods
Study Population
After receiving approval from our hospital's ethical review board, we included 36 patients who underwent ACL reconstruction at our institution between July 2021 and May 2022. The inclusion criteria were (1) double-bundle ACL reconstruction with autograft and (2) preoperative ultrasound and MRI examinations. Patients were excluded if they had (1) previous knee surgery or hamstring injuries, (2) multiligamentous knee injuries or knee dislocation, or (3) knee extension or flexion deficit that precluded anthropometric measurements or ultrasound and MRI examinations.
Anthropometry and Demographics
Anthropometric and demographic data were collected preoperatively. The parameters were age, sex, height, weight, body mass index, and thigh circumference (10 cm above the proximal pole of the patella).
Ultrasound
Ultrasound scans were performed by a single experienced musculoskeletal ultrasonographer (J.C.). The midportion of the ST was first determined in cross section. The probe was then traced along the proximal and distal ends of the ST to determine the muscle-tendon intersection and the insertion point at the pes anserinus. The proximal and distal ends were then marked on the patient’s skin, and the length of the ST was measured. The cross-sectional area (CSA) of the ST was measured by ultrasound at the level of knee joint 28 (Figure 1). The length and CSA of the GT were assessed in a similar way.

The cross-sectional area of the semitendinosus tendon at the knee joint level on ultrasound. The blue outline areas shows the cross-sectional area of the semitendinosus tendon at the knee joint level on ultrasound. “A”, “B”, and “C” were marker points help to outline the cross-sectional area of the semitendinosus tendon.
Magnetic Resonance Imaging
The 3.0-T Siemens Prisma scanner (Siemens) was used in all cases to obtain the proton-density fat-suppressed MRI scans. The RadiAnt Digital Imaging and Communications in Medicine Viewer software was used to assess the CSA of the ST and GT. The chosen level of CSA measurement was at the widest point of the medial femoral epicondyle8,30 (Figure 2). Two sports medicine fellowship–trained orthopaedic surgeons (C.X., S.Z.) were involved in taking the measurements. The interrater agreement between the reviewers was assessed using the intraclass correlation coefficient (ICC).

Axial magnetic resonance imaging slice of a left knee with the semitendinosus tendon (ST) and gracilis tendon (GT) outlined in green.
Tendon Harvesting
All graft harvest procedures were performed as reported by Zhao et al 33 and Zhao and Huangfu. 34 For the ST and GT, a 2- to 3-cm longitudinal incision was made medial to the tibial tubercle and the distal insertion points of the ST and GT. The tendons were removed with a closed tendon stripper. After scraping off the muscle, the tendon was truncated at a site where the tendon volume was about 50% of its thickest part. The length of the tendon was recorded. The ST and GT were each then prepared for a 4-strand graft separately based on the method reported by Xie et al. 31 The diameter of the proximal end of the ST and GT grafts was measured with a closed-hole sizing block ranging from 5 to 10 mm with 0.5-mm increments. The final diameter analyzed in this study was the smallest sized hole via which the proximal end of the graft could be pulled with maximum manual force.
Statistical Analysis
All statistical analyses were performed in SPSS (Version 26.0; IBM Corp). Simple linear regression was conducted to predict the graft diameters from the CSAs as measured by ultrasound and MRI. The optimal measurement cutoff was determined to identify an adequate graft diameter (>8 mm 17 ). The specificity, sensitivity, positive predictive value (PPV), and negative predictive value (NPV) of each imaging method was calculated. A Pearson correlation analysis was performed to analyze the relationship of the intraoperative graft diameters and tendon lengths with patient characteristics. Multiple linear regression analysis was performed, with relevant predictor variables based on the results of the Pearson correlation analysis. The level of statistical significance was set at P < .05.
A post hoc power analysis of correlation indicated that with r = 0.345 (the smallest r value) and α = .05, a power of 99% was achieved.
Results
A total of 36 patients were included. The median age was 29 years old (range, 16-39 years old). Detailed patient demographics are provided in Table 1. The measured parameters (CSA and length of tendons) showed good agreement, with ICCs >0.78. The CSAs of the ST and GT as measured by ultrasound and MRI and the graft lengths of the ST and GT as measured by ultrasound and intraoperatively are provided in Table 2. Patients with different diameters of 4-strand ST and GT grafts in each group are presented in Table 3. The results of correlation analysis between the intraoperative measurements and patient characteristics are displayed in Table 4.
Patient Characteristics (N = 36) a

Data are expressed as mean ± SD unless otherwise indicated. BMI, body mass index.
CSA and Graft Lengths of the ST and GT on MRI, on Ultrasound, and Intraoperatively a

CSA, cross-sectional area; GT, gracilis tendon; MRI, magnetic resonance imaging; ST, semitendinosus tendon.
Diameters of the 4-Strand ST and GT Grafts a

Data are expressed as No. of grafts. GT, gracilis tendon; ST, semitendinosus tendon.
Correlation Between Intraoperative Measurements and Patient Characteristics a
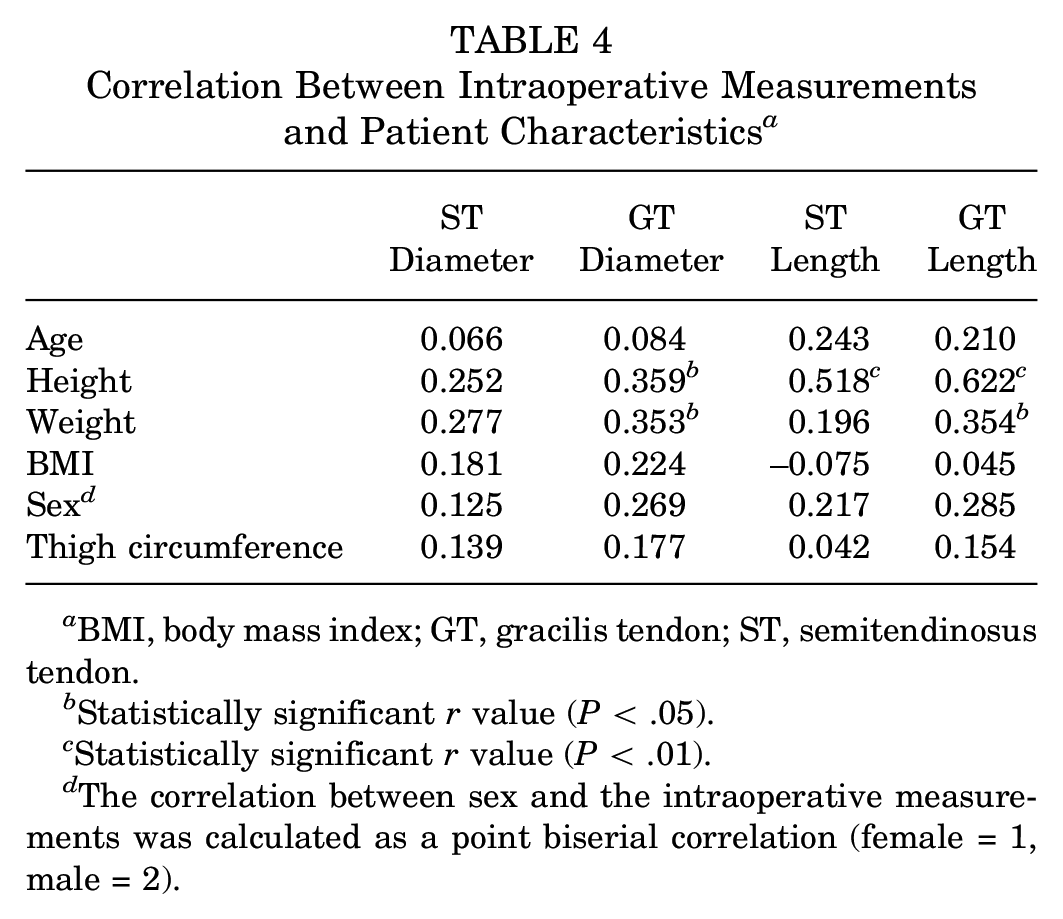
BMI, body mass index; GT, gracilis tendon; ST, semitendinosus tendon.
Statistically significant r value (P < .05).
Statistically significant r value (P < .01).
The correlation between sex and the intraoperative measurements was calculated as a point biserial correlation (female = 1, male = 2).
ST Graft Diameter
Simple linear regression indicated that CSA measured by MRI and ultrasound interpreted 11.9% and 41.7% of the variation in ST graft diameter, respectively. ST graft diameter could be predicted by the following formulas, as derived from simple linear regression analysis:


Regarding the predictive value of ST CSA, a cutoff of 10.5 mm2 for ultrasound and 11.5 mm2 for MRI was determined by confidence interval. When the CSA on ultrasound was >10.5 mm2, 28 of the 33 patients had a true ST graft diameter >8 mm, yielding a sensitivity of 85%. For those with a true ST graft diameter of <8 mm, 3 of 3 patients were correctly categorized, yielding a specificity of 100%. The PPV was 28 of 28 (100%), while the NPV was 3 of 8 (37.5%). Similarly, the sensitivity, specificity, PPV, and NPV for CSA on MRI were 52%, 100%, 100%, and 16%, respectively. The ultrasound method was more accurate than the MRI method (accuracy: 86.1% vs 55.6%) (P = .001). Multiple linear regression indicated that the combination of MRI and CSA on ultrasound could interpret approximately 42.6% of the variation in ST graft diameter. The formula derived is as follows:

GT Graft Diameter
Simple linear regression indicated that CSA measured by MRI and ultrasound interpreted approximately 15.7% and 18.4% of the variation in GT graft diameter, respectively. GT graft diameter could be predicted by the following formulas, as derived from simple linear regression analysis:


With respect to the predictive value of the GT CSA, a cutoff of 7.5 mm2 for ultrasound and 5.8 mm2 for MRI was adopted. Regarding the GT CSA on ultrasound, the sensitivity, specificity, PPV, and NPV were 63%, 100%, 100%, and 35%, respectively. Regarding the GT CSA on MRI, the sensitivity, specificity, PPV, and NPV were 47%, 100%, 100%, and 27%, respectively. Ultrasound was more accurate than MRI (accuracy: 69.4% vs 50.0%) (P < .001). Multiple linear regression indicated that a combination of MRI and ultrasound CSA were able to interpret approximately 22.6% of the variation in GT graft diameter. This percentage increased to 29.3% when adding the correlated patient height and weight. The formula derived is as follows:

ST Length
Simple linear regression indicated that patient height and ST length measured by ultrasound interpreted approximately 26.8% and 19.7% of the variation in ST length, respectively. A combination of patient height and ST length on ultrasound was able to explain approximately 35.9% of the variation in ST length as indicated by multiple linear regression analysis. The formula derived is as follows:

GT Length
Simple linear regression indicated that patient height, patient weight, and GT length on ultrasound interpreted approximately 38.6%, 12.5%, and 31.6% of the variation in GT length, respectively. A combination of these 3 predictors was able to explain approximately 46.3% of the variation in GT length. The formula derived is as follows:

Discussion
The most important finding of the present study was that ultrasound and MRI alone showed limited ability to predict the graft diameter of ST and GT, although ultrasound could more accurately predict the graft size than MRI. Four formulas combining relevant anthropometric parameters and measurements by ultrasound and MRI were calculated to predict the diameters and lengths of the ST and GT, explaining up to 46.3% of the variance. Among the different anthropometric variables, as one might anticipate, patient height was found to be the most influential in predicting the autograft length.
Various studies have noted the use of anthropometric parameters to predict graft diameter, but the results have been inconclusive. Height has often been considered the strongest predictor of graft diameter,4,21 while others have noted the greatest correlation with thigh circumference or weight. 29 In the present study, height and weight were correlated with GT graft diameter, which was partially in line with most previous studies, whereas no correlation was found for other variables such as thigh circumference. These findings add further inconsistency to the discussion about anthropometry and suggest that the potential of anthropometric factors alone to adequately predict graft diameter might be limited due to inconsistent results. Our results demonstrated that patient height was the only factor associated with the length of both autografts, interpreting 26.8% to 38.6% of the variance in graft length, which was consistent with the results of Xie et al 31 and Janssen et al. 12
The conflicting results pertaining to anthropometric predictors have stirred interest in MRI and ultrasound for preoperative prediction of graft diameter.10,11,14 In spite of promising early results, the literature has been heterogeneous and limited, and few studies have evaluated which imaging modality could more accurately predict the graft diameter of the ST and GT. The concepts of sensitivity and specificity were applied in the current study to compare the results of MRI and ultrasound in accurately discerning insufficient and sufficient graft diameters. High-sensitivity tests are optimal since they reduce the number of patients with undetected inadequate grafts. In the present study, ultrasound was found to be more sensitive and accurate than MRI.
Ultrasound has often been employed to evaluate soft tissue structures such as ligaments and tendons.13,26 Ozçakar et al 20 indicated that minimal experience is required for the accuracy and reproducibility of ultrasound examination of tendinous structures. In clinical practice, it is common for patients to have received MRI examinations at other medical institutions. In these situations, the easy availability and cost-effectiveness make ultrasound a valuable tool to predict the graft diameter preoperatively, thus avoiding the need for additional MRI and saving patients cost and time. Regarding tendon length, our results indicated that the length as measured by ultrasound was able to predict the intraoperative length, with an interpretation of 19.7% to 31.6% of the variance. Tendon length is an important aspect of attaining the ideal graft dimensions in the planning of ACL reconstruction. For instance, to create a 4-strand ST with a minimum length of 60 mm, a minimal tendon length of 24 cm (4 × 60 mm) is necessary. 7 Due to the limitation of imaging sites, MRI could not be used to measure the tendon length, making ultrasound a better modality. Additionally, since most patients with an ACL injury might have simultaneous lesion to the hamstring or patellar tendon that could affect the durability of the graft, 14 an ultrasound examination would be beneficial to check for potential scars or tears in the donor tendon, functioning in the same way as MRI.
Studies that have evaluated both anthropometry and imaging-based prediction are scarce.9,10 As anthropometric factors alone are limited in their ability to adequately predict graft diameter, imaging measurements were combined in this study to better predict both the length and diameter of the autograft. Four formulas were developed to predict the length of the ST and GT as well as the diameter of the ST and GT. The interpretation of variance for graft length and diameter was up to 46.3% (29.3%-46.3%), which is higher than the anthropometric factors alone indicated by Xie et al 31 (9.2%-37%).
Limitations
Our study has several limitations. First, the median age of recruited participants was 29 years old, and the majority were male patients. It may be difficult to generalize our findings to a younger, typically higher risk population. Second, the CSA of the tendons was measured at a single level, though the cross-sectional shape of tendons varies at different sites. Calculations from several points along the tendons may yield a better correlation with the graft diameters. Furthermore, the CSA was not measured at the same level on the ultrasound- and MRI-derived images. Third, the length of the autograft was only measured through ultrasound and intraoperatively and not on MRI, due to the limitations in MRI scan range. Additionally, length measurement by ultrasound on the skin might induce error.
Conclusion
Ultrasound and MRI alone showed limited ability to predict the graft diameter of ST and GT, although relatively speaking, ultrasound more accurately predicted the graft size than MRI. Among the different anthropometric variables, height was found to be the most influential in predicting tendon length.
Footnotes
Final revision submitted October 7, 2023; accepted November 13, 2023.
One or more of the authors has declared the following potential conflict of interest or source of funding: This work was supported by the Exploratory Research Program of Shanghai Jiao Tong University Affiliated Sixth People's Hospital (grant YNTS202001), the Basic Research Program of Shanghai Sixth People's Hospital (grant YNMS202105), the National Natural Science Foundation of China (grant 82272579), and the Shanghai Science and Technology Committee (grant 22dz1204700). AOSSM checks author disclosures against the Open Payments Database (OPD). AOSSM has not conducted an independent investigation on the OPD and disclaims any liability or responsibility relating thereto.
Ethical approval for this study was obtained from Shanghai Sixth People’s Hospital (ref No. 2021-KY-038 (K)).