
Abstract
Background:
The tibial tubercle–trochlear groove (TT-TG) distance is a measurement used to quantitatively assess tibial tubercle lateralization (TTL), and it has important reference value for the treatment of patellar dislocation (PD). However, TT-TG distance accuracy has been questioned, so many new parameters have been proposed.
Purpose:
To compare which of the TT-TG, tibial tubercle–midepicondyle (TT-ME), tibial tubercle–Roman arch (TT-RA), tibial tubercle–tibial intercondylar midpoint (TT-TIM), and tibial tubercle–mid inter-epicondyle trochlea intersection (TT-MIELTI) distances better reflect TTL in patients with PD.
Study Design:
Cohort study (diagnosis); Level of evidence, 3.
Methods:
A total of 96 patients who had undergone surgery for PD and 96 patients without PD (controls) were included in the study. The patients had all undergone computed tomography examination. The TT-TG, TT-ME, TT-RA, TT-TIM, TT-MIELTI distances and the TTL distance were measured independently by 2 surgeons in a blinded and randomized fashion. The t test was used to detect whether the parameters were significantly different between the 2 groups. The TTL distance was used as a reference value for lateralization of tibial tubercle. Pearson correlation coefficients were calculated to determine correlations between the defined measurements.
Results:
The intra- and interobserver reliability of the defined measurements was excellent. All parameters except for TT-TIM distance were significantly larger in the PD group than the control group (P < .01 for all). There was a moderate correlation (r = 0.601) between the TT-TG distance and TTL, and other parameters were less correlated with TTL.
Conclusion:
Among 5 the parameters tested, the TT-TG distance still had the highest correlation with TTL and was able to reflect TTL better in patients with PD. The role of TT-TIM distance in the assessment of PD needs further study.
Keywords
Patellar dislocation (PD) is a common knee injury in children and young adults.3,33,12,16 Patients with PD have higher rates of patella alta, increased tibial tubercle–trochlear groove (TT-TG) distance, rotational deformity, and trochlear dysplasia compared with people without a history of PD. 31
The TT-TG distance is an important evaluation index for TT osteotomy (TTO) decision-making. In patients who show TTL with an increased TT-TG distance, osteotomy of the TT can be used to reduce the TT-TG distance and reduce the risk of recurrence of lateral PD. 11 Dejour et al 6 proposed that pathological TT-TG distance was >20 mm. TTO is recommended when the TT-TG distance is >20 mm, but recently many studies have suggested that other parameters may be better substitutes for evaluating TTL.7,10,18,19,24,27,34,41 First, whether TT-TG distance can be representative of the relationship between TT and TG is controversial. Paiva et al 26 indicated that increased TT-TG distance is due to medialization of the TG but not TTL. Other studies have shown that TT-TG distance is an amalgamated measure of TTL and knee joint rotation.1,20,28 Second, a flat TG makes it difficult to determine the deepest portion of the TG and therefore the TT-TG measurement can be biased, leading to the inaccurate assessment of PD.9,37 In addition, Nizic et al 24 proposed that the tibial tubercle–tibial intercondylar midpoint (TT-TIM) distance is an alternative imaging test for TTL, unbiased toward knee rotation. Xu et al 41 deemed that, compared with TT-TG distance, the tibial tubercle–Roman arch (TT-RA) distance is a more reliable parameter for identifying the relative position of the TT in patients with trochlear dysplasia. The tibial tubercle–midepicondyle (TT-ME) distance put forward by Iseki et al 18 was a better indicator than the TT-TG distance to predict the risk of recurrent instability after isolated medial patellofemoral ligament reconstruction performed for patellar instability because it could solve the difficulty in determining the deepest point of the trochlea when measuring the TT-TG distance. The mid inter-epicondyle trochlea intersection (MIELTI) accurately identifies the deepest portion of the trochlea, so the TT-MIELTI distance is a reliable alternative to the TT-TG distance in the prediction of PD as well. 19 However, these studies have shown that other parameters were better than the TT-TG distance only in some aspects, and they did not directly compare their utility in assessing patients with PD. While the TT-TG value may be influenced by several factors, it is still the parameter used most commonly in clinical guidance for the treatment of PD; indeed, some studies have shown that the TT-TG distance is still better than other parameters.4,35
Preoperative measurement of the anatomic reference distance is helpful in choosing the appropriate treatment for assessing PD. 23 TTL has important guiding significance for TTO. Therefore, it is also important to assess the ability of these measurements to reflect TTL while using them to choose surgical option for PD. Our study aimed to (1) confirm the difference in TT-TG, TT-ME, TT-RA, TT-TIM, and TT-MIELTI between patients with and without PD and (2) explore the efficacy of these parameters in reflecting TTL. On the basis of the above views, we hypothesized that TT-TG would still be an appropriate measure of TTL.
Methods
Participants
This study was approved by the ethics committee of our institution. Patients in the study group were selected from the electronic medical records system for PD patients who were hospitalized from January 1, 2018 to May 31, 2021. The inclusion criteria were clinical PD at least twice and a history of PD surgery. The control group included patients with meniscal or ligamentous injury whose patella was radiologically confirmed to be in the TG and who were negative for the moving patellar apprehension test. Imaging showed that there was no osteoarthritis, fracture, or malalignment of the patellofemoral joint in patients in the control group. The control subjects were matched for age with the subjects with PD. Patients with a history of trauma or amputation of the affected limb or difficulty in determining anatomic references of knee joints were excluded from the study. We initially enrolled 100 patients with PD (study group). In the study group, 4 patients were excluded because 1 had missing identity information and 3 patients’ images were not clear enough to determine anatomic references of the patellofemoral joint. To match age in the study group, we selected 96 hospitalized patients with meniscal or ligamentous injury as the control group. In the end, data were obtained from 192 knees of 192 patients (96 in the study group and 96 in the control group). All patients had images measured by computed tomography (CT) in the supine position with the knee fully extended and the right and left forefeet closed together at the level of metatarsophalangeal joints with straps placed over the thigh and lower leg in the previous diagnosis and treatment.15,22,30 Data were measured by 2 experienced orthopaedic surgeons (Z.D. and G.J.) who were blinded to the patient information and study hypothesis. The observers remeasured the parameters of all patients after a 2-week interval. The average values measured by the 2 observers were used for comparison.
CT Protocol
The patients enrolled in the study were all scanned by a 16-detector row CT scanner (SOMATOM Sensation 16; Siemens Medical Solutions). These CT scans were acquired using the following parameters: 512 × 512 matrix, 120 kV, 100 mA, 1-second rotation time, 1-mm slice thickness, 0-mm slice skip, 14-cm field of view, and bone kernel. The CT images obtained were then imported into a personal computer for us to carry out measurements using RadiAnt DICOM software (Medical Ltd; accuracy of 0.1° and 0.1 mm. This system allows linear and angular measurements to be made on images and marked while scrolling through successive axial CT images.
The parameters were measured as follows:
TT-TG distance: Defined as the transverse distance between the highest point of the TT and the TG (Figure 1). The position of the proximal TG and the TT were determined according to the method used by Pace et al. 25 An axial image showing the maximum distance between the medial and lateral femoral epicondyles was selected.
TT-ME distance: Defined as the transverse distance between the highest point of the TT and the midpoint of the anatomic transepicondylar line (Figure 2). 18
TT-RA distance: Defined as the transverse distance between the highest point of the TT and the highest point of the Roman arch (Figure 3). 41
TT-TIM distance: Defined as the transverse distance between the highest point of the TT and the tibial intercondylar midpoint (Figure 4). 24
TT-MIELTI distance: Defined as the transverse distance between the highest point of the TT and the intersection of the intercondylar midpoint and trochlea (Figure 5). 19
TTL distance: Calculated by dividing the lateralized distance of the TT by the tibial width (Figure 6). 36

The distance between the line perpendicular to the PCRL through the deepest portion of the TG and the line perpendicular to the PCRL through the TT is the TT-TG distance. PCRL, posterior condylar reference line; TT-TG, tibial tubercle–trochlear groove.

The distance between the line perpendicular to the anatomic femoral transepicondylar line through the red dot and the line perpendicular to the anatomic femoral transepicondylar line through the TT is the TT-ME distance. The red dot is the midpoint of the anatomic transepicondylar line. TT-ME, tibial tubercle–midepicondyle.

The distance between the line perpendicular to the PCRL through the red dot and the line perpendicular to the PCRL through the TT is the TT-RA distance. The red dot is where the parallel lines of the PCRL intersect with the Roman arch. PCRL, posterior condylar reference line; TT-RA, tibial tubercle–Roman arch.

The distance between the line perpendicular to the tibial PCRL through the red dot and the line perpendicular to the tibial PCRL through the TT is the TT-TIM distance. The selected slice of TIM was the first axial CT image when the top of the fibula head was no longer visible when rolling upward from the TT. The red dot is the midpoint of the intercondylar. The selected plane was the first axial CT image when the top of the fibula head was no longer visible when rolling upward from the TT. CT, computed tomography; PCRL, posterior condylar reference line; TT-TIM, tibial tubercle–tibial intercondylar midpoint.

The distance between the line perpendicular to the PCRL through the red dot and the line perpendicular to the PCRL through the TT is the TT-MIELTI distance. The yellow dot is the midpoint of the transepicondylar line. The red point is where the line that passes through the yellow point and is perpendicular to the transepicondylar line intersects with the TG. PCRL, posterior condylar reference line; TT-MIELTI, tibial tubercle–mid inter-epicondyle trochlea intersection.

The TTL (d/D) was calculated as the distance (red line, d) between lines b and c divided by the distance (red line, D) between lines a and c. Lines a, b, and c are perpendicular to the tangential line of the posterior condyle of the tibia plateau. Line a is tangent to the medial margin of the tibia plateau. Line b passes through the TT. Line c is tangent to the lateral margin of the tibia plateau. TTL, tibial tubercle lateralization.
Trochlea Morphology
The most proximal image with the full width of the trochlea on axial CT was selected for evaluation. Trochlear dysplasia was classified as follows:
Type A: A shallow trochlea with a sulcus angle >145°;
Type B: A flat or convex trochlea;
Type C: Lateral facet convexity and medial facet hypoplasia on axial images;
Type D: A trochlea with a cliff-forming asymmetry of the facet. 42
Statistical Analysis
Variables were expressed as means and standard deviations. The intraobserver and interobserver reliability of the measurements was calculated using the intraclass correlation coefficient (ICC). The chi-square test was used for analyzing the difference in the classification of trochlear dysplasia and sex. The risk factors of PD were analyzed by univariate logistic regression analysis. The data were checked for normal distribution by Kolmogorov-Smirnov test and Shapiro-Wilk test. P values were all >.05, which proved to be a normal distribution. The length parameters included in this study were normalized to minimize the influence of individual differences in the results. The independent-samples t test was used to verify whether there was a significant difference in parameters between the study group and the control group; P < .05 was considered statistically significant. Pearson correlation coefficients were calculated to determine correlations between the defined measurements. The a priori calculated sample size (G-Power 3.1, effect size 0.5, a-error 0.05, power 0.95, N2/N1 = 1) revealed that a minimum of 88 knees was required in the study and control groups, relatively. A post hoc power analysis revealed an adequate sample size with an achieved power of 96% (effect size 0.5, a-error 0.05, N2 = N1 = 96).
SPSS (version 26; SPSS) and GraphPad Prism (version 8.0) were used for statistical analysis and plotting.
Results
Participant Characteristics
There were 23 male and 73 female participants ranging from 5 to 29 years old (mean age, 16.4 ± 4.8 years) in the study group and 26 male and 70 female participants ranging from 8 to 30 years old (mean age, 16.8 ± 5.0 years) in the control group. There was no significant difference in age or sex between the 2 groups (P = .529) (Table 1).
Demographic Characteristics of the Study and Control Groups a

Age data are expressed as mean ± SD. NS, no significance.
Reliability Assessment for Measurement
The ICCs for both intraobserver and interobserver reliability were all >0.7 (Table 2), meaning the reliability was excellent.
ICC Calculation Results Used to Assess Reliability a
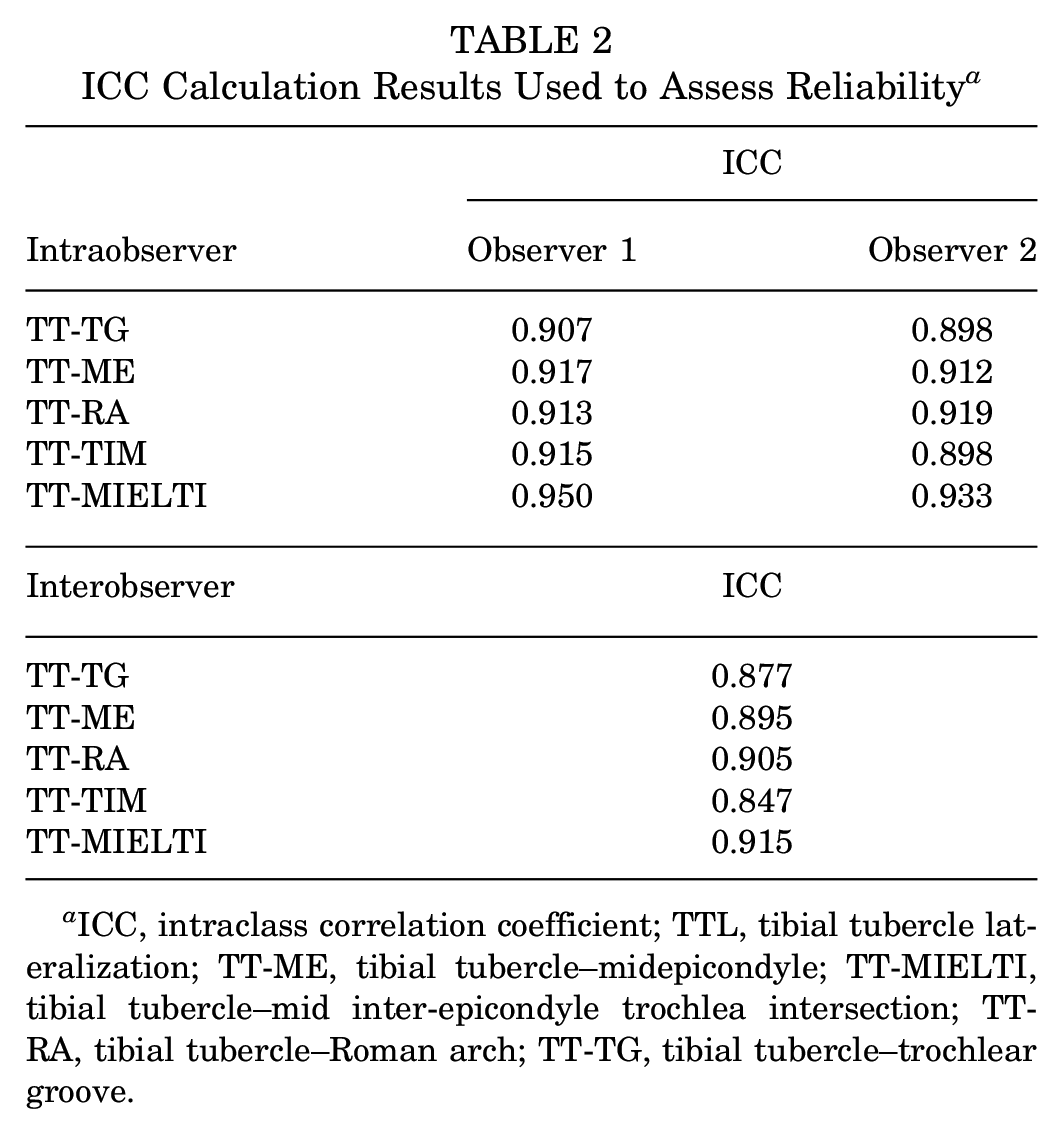
ICC, intraclass correlation coefficient; TTL, tibial tubercle lateralization; TT-ME, tibial tubercle–midepicondyle; TT-MIELTI, tibial tubercle–mid inter-epicondyle trochlea intersection; TT-RA, tibial tubercle–Roman arch; TT-TG, tibial tubercle–trochlear groove.
Analysis of Parameters in PD
All the parameters measured in PD were distributed normally. The TT-TG, TT-ME, TT-RA, and TT-MIELTI distances were significantly different between the 2 groups. There was no significant difference in TT-TIM between the control group and the study group. All the numerical data are presented in Table 3. The TT-TG, TT-ME, TT-RA, and TT-MIELTI distances in the study group were all larger than those in the control group (P < .01 for all). Because TT-TIM was not statistically different between the 2 groups, it was excluded from further data analysis.
Comparison of Parameters Between the Study and Control Groups a

Data are expressed as mean ± SD.TTL, tibial tubercle lateralization; TT-ME, tibial tubercle–midepicondyle; TT-MIELTI, tibial tubercle–mid inter-epicondyle trochlea intersection; TT-RA, tibial tubercle–Roman arch; TT-TG, tibial tubercle–trochlear groove.
The remaining 4 parameters were all significantly correlated with TTL (P < .01). There was a moderate correlation (r = 0.601) between the TT-TG distance and TTL, with the other parameters being less correlated with TTL (Figure 7).
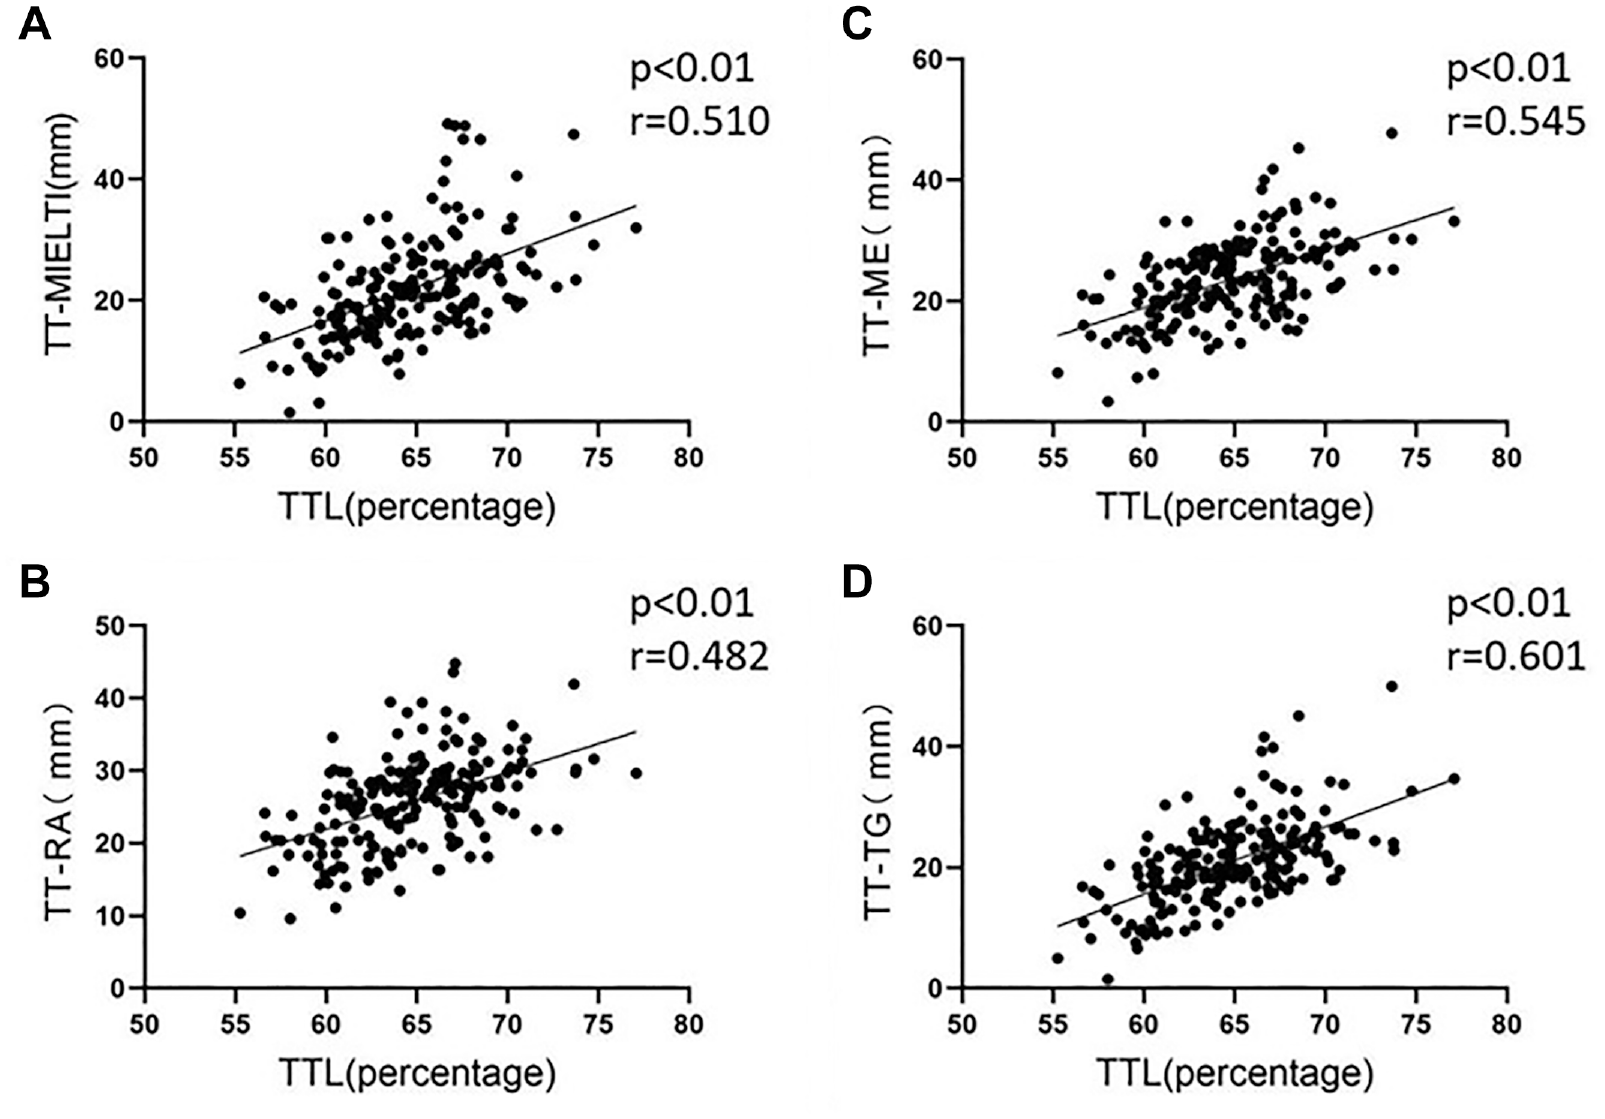
Distribution of TT-MIELTI, TT-ME, TT-RA, and TT-TG with regard to TTL. TTL, tibial tubercle lateralization; TT-ME, tibial tubercle–midepicondyle; TT-MIELTI, tibial tubercle–mid inter-epicondyle trochlea intersection; TT-RA, tibial tubercle–Roman arch; TT-TG, tibial tubercle–trochlear groove.
In the subsequent univariable analysis for the TT-TG distance, using 20 mm as the cutoff value, an approximately 17-fold increase in incidence was found in patients with a TT-TG distance of >20 mm (odds ratio, 18.833; 95% confidence interval, 9.115-38.913; P < .001).
Discussion
Our study compared the TT-TG, TT-ME, TT-RA, TT-TIM, and TT-MIELTI distances to explore the relationship of these parameters in reflecting TTL. The test showed that the TT-TG, TT-ME, TT-RA, TT-MIELTI distances all were significantly different between the study group and the control group, but TT-TIM was not. Further correlation analysis showed that TT-TG distance had the highest correlation with TTL.
Lateral TT can force the patella to shift laterally and may jeopardize normal patellar tracking.29,32 An increased TT-TG distance is widely recognized as one of the most important factors for PD.2,17,21,39,43 TT-TG distance is a measurement used to quantitatively assess TTL and is a key indicator in determining whether distal realignment surgery is necessary. 38 In our study, the incidence of patients with a TT-TG distance of >20 mm was 18.8 times that of the general population, indicating that the risk of PD occurring will be greatly increased in those with an increased TT-TG distance.
However, TT-TG distance can be affected by knee rotation, which is one of the most important factors affecting PD.1,5,14,20,28,40,44 TT-TG distance has often been questioned when evaluating TTL.
Preoperative planning is important for patients with PD. Increased TT-TG distance is often treated with TTO, and although the resulting bony correction is only for tibial side deformity, its postoperative outcome is still substantial. 13 In fact, many surgeons would like to look for a better measure to reflect TTL and thus guide TTO, but in our study, after putting these measures to the test again, we found that none of them correlated with TTL as well as TT-TG distance , which may indicate that this parameter is still a better indicator to reflect TTL and guide TTO.
TT-TG distance may not reflect TTL satisfactorily in patients with extreme trochlear dysplasia. Xu et al 41 divided TGs into 4 categories according to Dejour classification when studying TT-RA distance. The ICCs of TT-RA distance and TT-TG distance in trochlear classified type D were 0.996 and 0.114, respectively. 41 TT-TG distance lost its original accuracy when severe trochlear dysplasia (type D) happened. In our study, the ICCs for TT-TG distance measurement were excellent. Indeed, unless extremely flat TGs occur, the TT-TG distance still remains the best indicator for TTL.
It is also worth considering that in our study, TT-TIM distance did not increase significantly in patients with PD. Nizic et al 24 suggested that TT-TIM distance was an excellent indicator of TTL because it was less affected by other anatomic variations. But he focused on the interaction of TT-TIM distance with other anatomic factors and did not study changes in TT-TIM distance in patients with PD. In our study, the TT-TIM distance was not significantly different between the study group and the control group. The other 4 parameters related the TT to the femur, while the TT-TIM distance ignored this relationship between the TT and femur. Pace et al 25 proposed that there was no difference in the medial to lateral position of the TT on the proximal tibia. It is worth thinking that perhaps the simple lateralization of TTs is not the main cause of PD. More attention should be paid to the relationship between the tibia and femur when studying the causes of PD. The study of TTL may also need to focus on TTL relative to the femur.
The TT-TG, TT-ME, TT-RA, TT-TIM, and TT-MIELTI distances have rarely been compared in previous studies, and our study is the first to summarize these parameters and compare their correlation with TTL. Since the TT-TG distance was proposed, it has been controversial. For example, Dong et al 7 indicated that the TT–posterior cruciate ligament distance was better than the TT-TG distance to predict PD in patients with severe trochlear dysplasia. Nevertheless, some researchers still consider TT-TG distance to be the better indicator.8,35,42 Our study once again demonstrated that TT-TG distance remains a reliable indicator for the assessment of TTL.
Limitations
This study had some limitations. Many other parameters to measure TTL have been proposed in recent studies. We could not analyze them all, but we selected a few of the most representative parameters. PD occurs mainly in teenagers, so we might have included patients with both skeletal maturity and immaturity. Traditional studies have suggested that the measurement method is not affected by bone maturation, but whether it further affects the results remains to be investigated. In addition, trochlear dysplasia may reduce the accuracy of all parameters. In this study, the majority of patients included had mild trochlear dysplasia. Better performing parameters may be found if trochlear dysplasia is further classified. Although we minimized this deviation by using 2 experienced observers, we lacked an experienced radiologist. In addition, CT and magnetic resonance imaging measurements may also differ from each other so our results may be not exactly the same as in other studies.
Conclusion
Among the 5 parameters evaluated in the current study, the TT-TG distance still had the highest correlation with TTL, which may reflect TTL better in patients with PD. The TT-ME, TT-RA, and TT-MIELTI distances may have their own advantages when the trochlea is severely dysplastic. However, the use of TT-TIM distance in the assessment of PD was not satisfactory and needs further study.
Footnotes
Final revision submitted September 27, 2023; accepted October 5, 2023.
One or more of the authors has declared the following potential conflict of interest or source of funding: this work was supported by the National Natural Science Foundation of China (grant No. 81873983) and Key Program of Natural Science Foundation of Hebei Province (grant no. H2019206694). Natural Science Foundation of Hebei Province (grant no. H202106093) Key research and development project of Hebei Province (grant no. 20377731D). AOSSM checks author disclosures against the Open Payments Database (OPD). AOSSM has not conducted an independent investigation on the OPD and disclaims any liability or responsibility relating thereto.
Ethical approval of this study was obtained from the Medical Ethics Committee of the Third Hospital of Hebei Medical University (Acceptance No. Ke2023-002-1).