
Abstract
Background:
Available conventional tibial tubercle lateralization (TTL) parameters fail to account for individual patient size or anatomy.
Purposes:
To evaluate the predictive ability of individualized TTL parameters and clarify the best predictor of patellar dislocation (PD) and to determine the relationship of the best predictor with other risk factors of PD with quadriceps isotonic contraction.
Study Design:
Cohort study (diagnosis); Level of evidence, 2.
Methods:
A total of 15 patients with PD (28 knees) and 14 controls (28 knees) underwent 4-dimensional computed tomography, and the image with the knee fully extended and quadriceps isotonically contracted was selected for evaluation. The following TTL parameters were measured on the images: tibial tubercle–trochlear groove (TT-TG) distance, tibial tubercle–Roman arch distance, and tibial tubercle–posterior cruciate ligament distance, as well as their ratios to femoral condylar width and patellar width (PW). In addition, the following parameters were measured: Insall-Salvati ratio, Blackburne-Peel ratio, Caton-Deschamps ratio, modified Insall-Salvati ratio, bisect offset index, congruence angle, lateral patellar tilt, lateral trochlear inclination, sulcus depth, sulcus angle, trochlear groove medialization, patella–patellar tendon angle, patellofemoral axis angle (P-FAA), patellar articular facet–patellar tendon angle, patellar articular facet–femoral axis angle (PA-FAA), and patellar shape according to Wiberg type. The area under the receiver operating characteristic curve (AUC) was calculated to access the diagnostic accuracy of the TTL parameters for PD, and the TTL parameters with high diagnostic ability were evaluated for correlation with the remaining parameters.
Results:
The TT-TG/PW ratio had the best diagnostic ability for PD (AUC = 0.890). The TT-TG/PW ratio was positively correlated with bisect offset index, congruence angle, lateral patellar tilt, P-FAA and PA-FAA (r = 0.610, 0.465, 0.635, 0.553 and 0.418, respectively; P≤ .027 for all), and TT-TG/PW ratio was greater in knees with type II versus type III patella (P = .017).
Conclusion:
With the knee fully extended and quadriceps isotonically contracted, the TT-TG/PW ratio was found to be the best predictor of PD and reflected individualized TTL, which helps with clinical preoperative planning.
Keywords
Patellar dislocation (PD) is a common knee disorder, especially prevalent in female adolescents.19,23,37 However, treatment of PD remains challenging due to multifactorial etiology. Several contributing factors have been reported, such as tibial tubercle lateralization (TTL), patella alta, trochlear dysplasia, medial patellofemoral ligament insufficiency, and knee valgus and rotational deformity.15,16,20,26,30 Of these, the TTL has long been recognized as an important anatomic risk factor for PD. Accurate and reliable evaluation of the true TTL is essential for surgical planning. The tibial tubercle–trochlear groove (TT-TG) distance of >20 mm is generally considered an indication for tibial tubercle osteotomy.16,21 Given that the measurement of the TT-TG distance is influenced by trochlear morphology and knee rotation,17,18 modified parameters such as the tibial tubercle–posterior cruciate ligament (TT-PCL) distance 41 and tibial tubercle–Roman arch (TT-RA) distance 46 have been proposed. Notably, none of them takes individual patient size or anatomy into consideration. 9 On the other hand, it has been demonstrated that the available conventional TTL parameters are variable among individuals according to patient size.27,39 With reference to other orthopaedic measurements that overcome this shortcoming by using the ratio of the measured parameter to a patient-specific anatomic measurement, individualized TTL parameters have been proposed.12,28 In order to better individualize surgical procedure, it is important to determine individualized TTL parameters with excellent predictive ability. Furthermore, the relationship between individualized TTL parameters and other risk factors of PD is unclear.
The stability of the patellofemoral joint relies on a complex interaction of osseous structure and soft tissue. 1 Grant et al 22 found that assessment of the patellofemoral joint with quadriceps activation improves the ability to diagnose malalignment. Therefore, an increasing number of researchers are advocating the analysis of patellar instability under dynamic and weightbearing conditions.40,42 Several studies have performed patellofemoral assessment with static quadriceps isometric contraction and revealed that isometric contraction of the quadriceps often creates a more pathological displacement and tilt of the patella.4,25 Some studies also reported decreased TT-TG in weightbearing functional status by affecting tibiofemoral torsion.29,34 In fact, dynamic isotonic contraction of the quadriceps can truly reflect the physiological exercise of the patellofemoral joint and provide objective functional data for evaluating patellar instability. 8 With the advancement of imaging technology, the image with the knee fully extended and quadriceps isotonically contracted during the knee flexion-extension movement can be obtained via 4-dimensional computed tomography (4D-CT).
The present study obtained 4D-CT images with the knee fully extended and quadriceps isotonically contracted to (1) evaluate the predictive ability of individualized TTL parameters and clarify the best predictor of PD and (2) determine the relationship of the best predictor with other risk factors of PD. It was hypothesized that the individualized parameters related to the anatomic measurements contributing to patellar instability would yield the best diagnostic predictors for PD.
Methods
Participants
The protocol for this study received ethics committee approval by our institution. Participants were recruited consecutively from January to October 2021. Two senior orthopaedic surgeons took a history and conducted the physical examination. The PD group included patients meeting the following criteria: (1) PD diagnosed by senior orthopaedic surgeons based on history and clinical examinations and (2) no cruciate or collateral ligament injury seen on magnetic resonance imaging examination. The exclusion criteria were as follows: (1) a history of knee surgery; (2) severe tibiofemoral joint deformity (valgus and varus deformity >15°); (3) patellofemoral and/or tibiofemoral osteoarthritis with Kellgren-Lawrence grade of ≥3; and (4) patients who could not undergo CT examination (eg, pregnant women, those preparing for pregnancy, and those who could not perform the knee movement). The control group included patients requiring CT scanning (eg, injury, tumor), with the healthy side as well as the side needing CT scans not involving the patellofemoral joint. The exclusion criteria for the control group were the same as those used for the PD group.
Imaging Protocol
The 4D-CT was performed on a wide detector CT scanner with 320 0.5-mm detectors (Aquilion ONE; Canon Medical Systems). The dynamic CT continuous scan mode (no table feed) was used to obtain 3-dimensional kinematic images. Patients were placed in a supine position with the calves suspended in the gantry and asked to perform continuous active knee flexion and extension, completing approximately 1.5 cycles of knee motion (flexion-extension-flexion) during a 10-second scan. The active knee motion was slow and uniform, with the thighs remaining stable and the knees and feet kept together during the scanning process (Figure 1). A total of 21 continuous images were acquired, and the image with the knee fully extended (flexion angle of −5° to 0°) was selected for evaluation. The imaging protocol was as follows: time interval, 0.5 seconds; display field of view, 500 × 500 × 160 mm; slice thickness, 0.5 mm; slice spacing, 0.5 mm; tube rotation, 0.35 seconds; and tube output, 100 kV and 70 mA. During imaging, each participant was covered with a lead protector from the neck to the proximal thigh.

The scanning process during 4-dimensional computed tomography. (A) Maximum knee flexion and (B) full knee extension.
Measurement of Parameters
Two fellowship-trained musculoskeletal radiologists (Y.C. and W.T., with 2 and 9 years of clinical experience, respectively) independently performed the measurement analysis after all the data of the 2 groups had been blinded and randomly distributed. All measurements were then repeated by one of the radiologists (W.T.) after ≥4 weeks in order to assess intraobserver reliability.
Tibial Tubercle Lateralization
TTL was measured using the TT-TG distance 16 (Figure 2A), TT-RA distance 46 (Figure 2B) and TT-PCL distance 41 (Figure 2C). Individualized TTL was measured using the ratio of each of these distances to the femoral condylar width (FCW; measured as the distance between tangent lines perpendicular to the posterior condylar tangent line through the most prominent point on the medial and lateral facets of the femoral condyle on the most proximal slice displaying the posterior condyles with the classic Roman arch) (Figure 2A), and the patellar width (PW; measured as the maximum width of the patella) (Figure 2F): TT-TG/FCW ratio, TT-TG/PW ratio, TT-RA/FCW ratio, TT-RA/PW ratio, TT-PCL/FCW ratio, and TT-PCL/PW ratio.
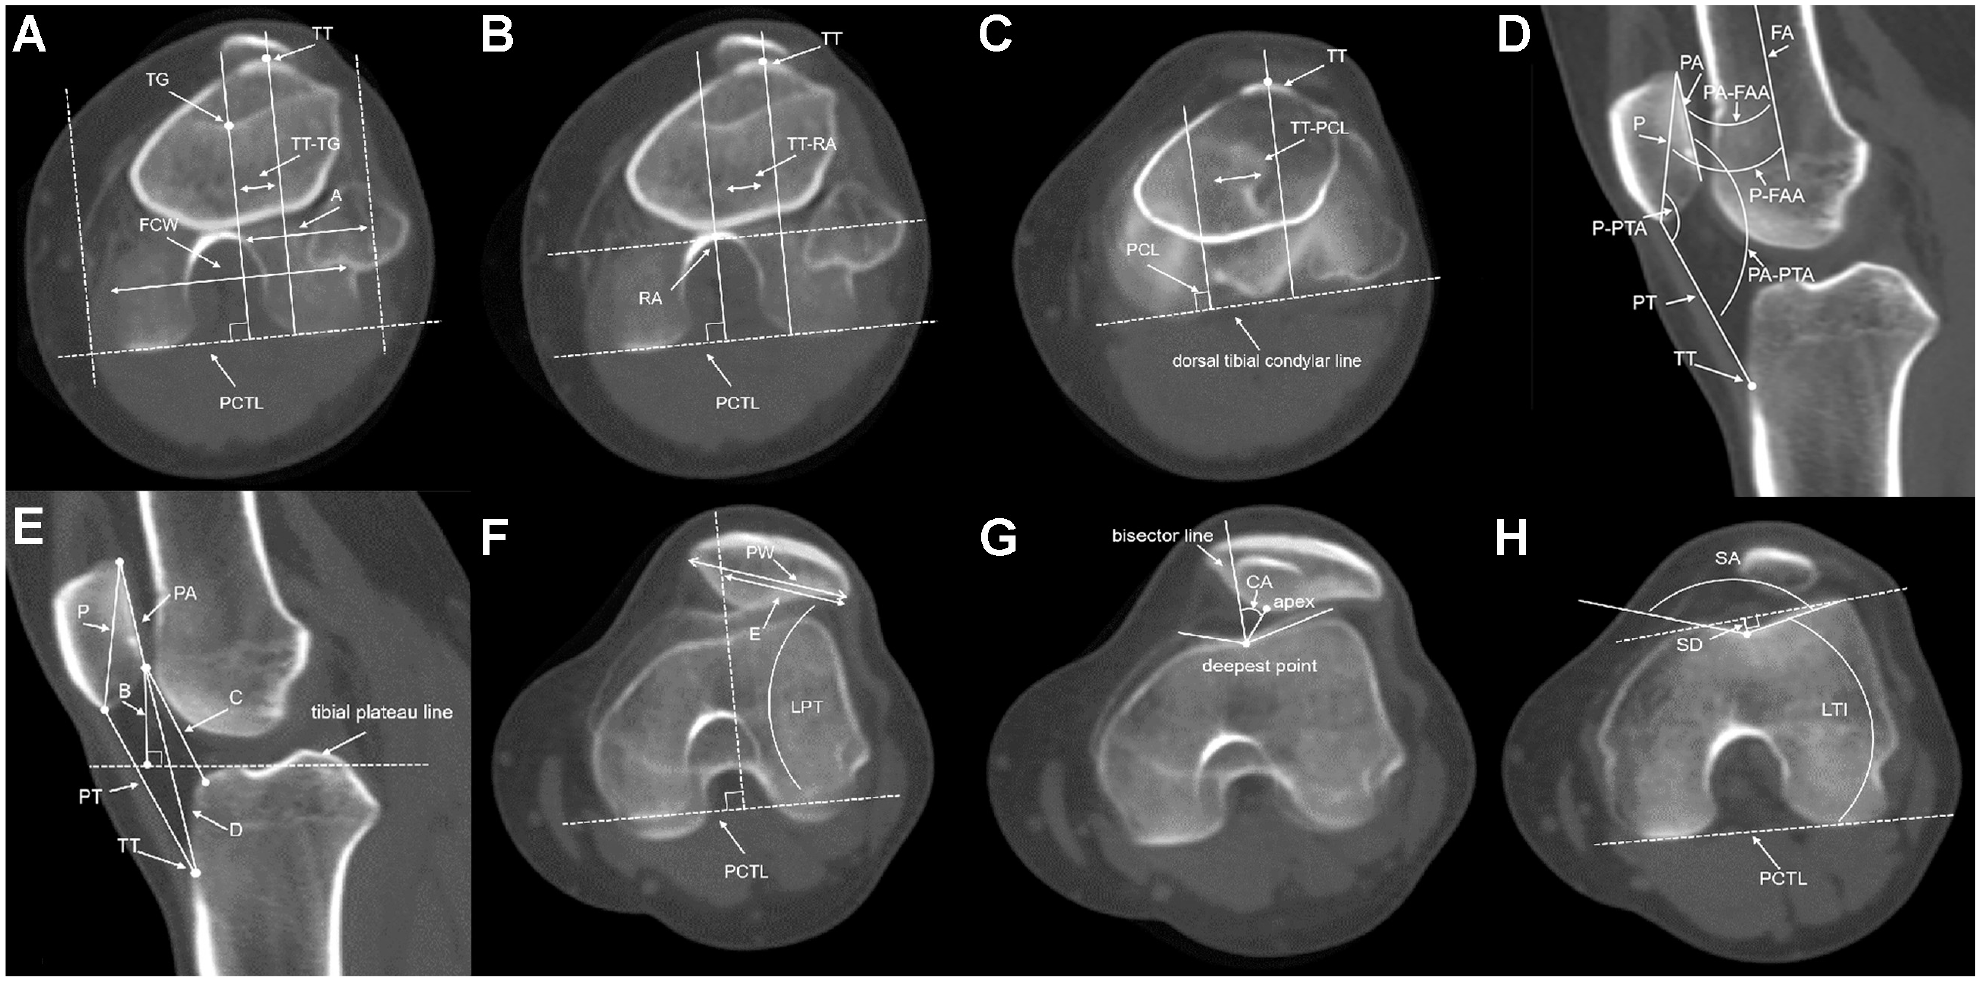
Measurement of study parameters on 4-dimensional computed tomography. (A) The tibial tubercle–trochlear groove (TT-TG) distance is the distance between 2 parallel lines perpendicular to the posterior condylar tangent line (PCTL) through the center of the TT and the deepest point of the TG. The femoral condylar width (FCW) is the distance between tangent lines perpendicular to the PCTL through the most prominent point on the medial and lateral facets of the femoral condyle; trochlear groove medialization = A/FCW × 100%, where A is the distance between 2 parallel lines perpendicular to the PCTL through the deepest point of the TG and the most prominent point on the lateral facet of the femoral condyle. (B) The tibial tubercle–Roman arch (TT-RA) distance is the distance between 2 parallel lines perpendicular to the PCTL through the center of the TT and the tangent point of the RA. (C) The tibial tubercle–posterior cruciate ligament (TT-PCL) distance is the distance between 2 parallel lines perpendicular to the dorsal tibial condylar line through the center of the TT and the medial border of the PCL. (D) The patella–patellar tendon angle (P-PTA) is the angle between P and patellar tendon (PT); the patella–femoral axis angle (P-FAA) is the angle between P and the femoral axis (FA); the patellar articular facet–patellar tendon angle (PA-PTA) is the angle between PA and PT; and the patellar articular facet–femoral axis angle (PA-FAA) is the angle between PA and FA. (E) Insall-Salvati ratio = PT/P; Blackburne-Peel ratio = B/PA; Caton-Deschamps ratio = C/PA; and modified Insall-Salvati ratio = D/PA. (F) Patellar width (PW) is the maximum width of the patella; bisect offset index = E/PW × 100%; and lateral patellar tilt (LPT) is the angle between PW and PCTL. B is the perpendicular distance from the distal pole of the patellar articular surface to the tibial plateau line. C is the distance from the distal pole of the patellar articular surface to the anterosuperior point of the tibial plateau. D is the distance from the distal pole of the patellar articular surface to the tibial tubercle.(G) The congruence angle (CA) is the angle between the bisector line of the sulcus angle (SA) and the line crossing the deepest point to the apex. (H) Lateral trochlear inclination (LTI) is the angle between the lateral trochlear facet and the PCTL; SA is the angle between the medial and lateral trochlear facets; sulcus depth (SD) is the perpendicular distance from the deepest point of the SA to the line crossing the superior point of the medial and lateral trochlear facets.
Patellar Height
Patellar height was measured using the Insall-Salvati (IS) ratio, 31 Blackburne-Peel (BP) ratio, 6 Caton-Deschamps (CD) ratio, 11 and modified Insall-Salvati (MIS) ratio. 24 (Figure 2E) on the midsagittal plane, where the slice passed through the midlevel of the patella.
Patellar Axial Alignment
Patellar axial alignment was measured using the bisect offset (BO) index 7 (Figure 2F), congruence angle (CA) 36 (Figure 2G) and lateral patellar tilt (LPT) 35 (Figure 2F) on the transverse view where the patella was at its maximum width. CA values medial to the bisector line were designated as negative, while values lateral to the bisector line were designated as positive.
Trochlear Morphology
Trochlear morphology was measured using the lateral trochlear inclination (LTI), 10 sulcus depth (SD), 43 sulcus angle (SA) 43 (Figure 2H), and trochlear groove medialization (TGM) on the proximal plane displaying the complete cartilaginous trochlea. For TGM, the FCW was divided into lateral and medial parts by a line perpendicular to the posterior condylar tangent line through the deepest point of the trochlear groove on the slice displaying the posterior condyles with the Roman arch. TGM was defined as the percentage of the lateral part over the FCW (Figure 2A).
Sagittal Patellar Tilt
Sagittal patellar tilt was measured using the patella–patellar tendon angle, 13 patellofemoral axis angle (P-FAA), patellar articular facet–patellar tendon angle and patellar articular facet–femoral axis angle (PA-FAA) on the midsagittal plane. PA-FAA values left of the femoral axis were designated as positive, and those to the right as negative (Figure 2D).
Patellar Shape
Patellar shape was classified according to Wiberg et al 44 as type I (medial facet [concave] equal size to lateral facet [concave]), II (medial facet [flat, slightly convex] smaller than lateral facet), or III (medial facet [convex] much smaller than lateral facet).
Statistical Analysis
SPSS Version 26.0 (IBM Corp) was used for data analysis. Demographic data were analyzed using descriptive statistics. Continuous variables were reported as mean ± SD if normally distributed and as medians and interquartile ranges if nonnormally distributed. Comparison between the 2 groups was evaluated with the Student t test, Mann-Whitney U test or Fisher exact test, as applicable. The interobserver and intraobserver reliability of the imaging measurements was determined using the intraclass correlation coefficient (ICC) for continuous variables and the Cohen kappa coefficient for categorical variables. Receiver operating characteristic (ROC) curve presenting sensitivity and specificity was calculated for conventional and individualized TTL parameters, and the area under the ROC curve (AUC) was produced to access the diagnostic accuracy of parameters for PD. The relationship between the TTL parameters with high diagnostic accuracy for PD and the remaining imaging parameters were evaluated with Spearman correlation coefficient or Pearson correlation coefficient for continuous variables and the Student t test for categorical variables. The significance level was set at P < .05.
Post hoc analysis was performed using G*Power software (Version 3.1.9.6, program written by Franz Faul, Universität Kiel). For a large effect size of 1.59 according to the TT-TG distance in the 2 groups, a power of 0.9999458 was calculated (n1 = n2 = 28; alpha = .05).
Results
Participant Characteristics
Two knees were excluded due to poor image quality, leaving 28 knees (14 left, 14 right) in 15 patients (4 male, 11 female; mean age, 19.60 ± 6.54 years) in the PD group and 28 knees (14 left 14 right) in 14 participants (6 male, 8 female; mean age, 25.36 ± 8.21 years) in the control group. There were no significant differences in characteristics between the groups (Table 1).
Participant Characteristics a

NA, not applicable. PD, patellar dislocation.
Inter- and Intraobserver Reliability
The ICCs for interobserver reliability of all measurements ranged from 0.786 to 0.997, and the intraobserver reliability of all measurements ranged from 0.767 to 0.993. In both cases, they showed good to excellent reliability (Table 2).
Inter- and Intraobserver Reliability of the Parameter Measurements a

Data are presented as intraclass correlation coefficient (95% CI) unless otherwise indicated. BO, bisect offset; BP, Blackburne-Peel; CA, congruence angle; CD, Caton-Deschamps; FCW, femoral condylar width; IS, Insall-Salvati; LPT, lateral patellar tilt; LTI, lateral trochlear inclination; MIS, modified Insall-Salvati; P-FAA, patella–femoral axis angle; P-PTA, patella–patellar tendon angle; PA-FAA, patellar articular facet–femoral axis angle; PA-PTA, patellar articular facet–patellar tendon angle; PW, patellar width; SA, sulcus angle; SD, sulcus depth; TGM, trochlear groove medialization; TT-PCL, tibial tubercle–posterior cruciate ligament; TT-RA, tibial tubercle–Roman arch; TT-TG, tibial tubercle–trochlear groove.
Data are presented as Cohen κ± SE.
Imaging Evaluation
Comparison Between the PD and Control Groups
Table 3 summarizes the comparison of all imaging parameters between the study groups. Regarding the TTL-related measurements, the TT-TG distance, TT-RA distance, TT-TG/FCW ratio, TT-TG/PW ratio, TT-RA/FCW ratio, TT-RA/PW ratio, and TT-PCL/PW ratio were found to be significantly higher in the PD group (P≤ .015 for all). All patellar height measurements (IS ratio, BP ratio, CD ratio, and MIS ratio) were significantly higher in the PD group (P≤ .019 for all). In addition, all measurements related to patellar axial alignment (BO index, CA, and LPT) were significantly higher in the PD (P≤ .045 for all). With respect to trochlear morphology, LTI and SD were significantly lower (P = .005 and <.001, respectively) while TGM was significantly higher (P = .03) in the PD group; SA was not significantly different between the 2 groups. No significant group differences in any of the sagittal patellar tilt measurements were found. There were significantly fewer knees with type I patella (P = .004) and significantly more knees with type III patella (P = .002) in the PD group (Table 3).
Comparison Between the PD Group and Control Group a
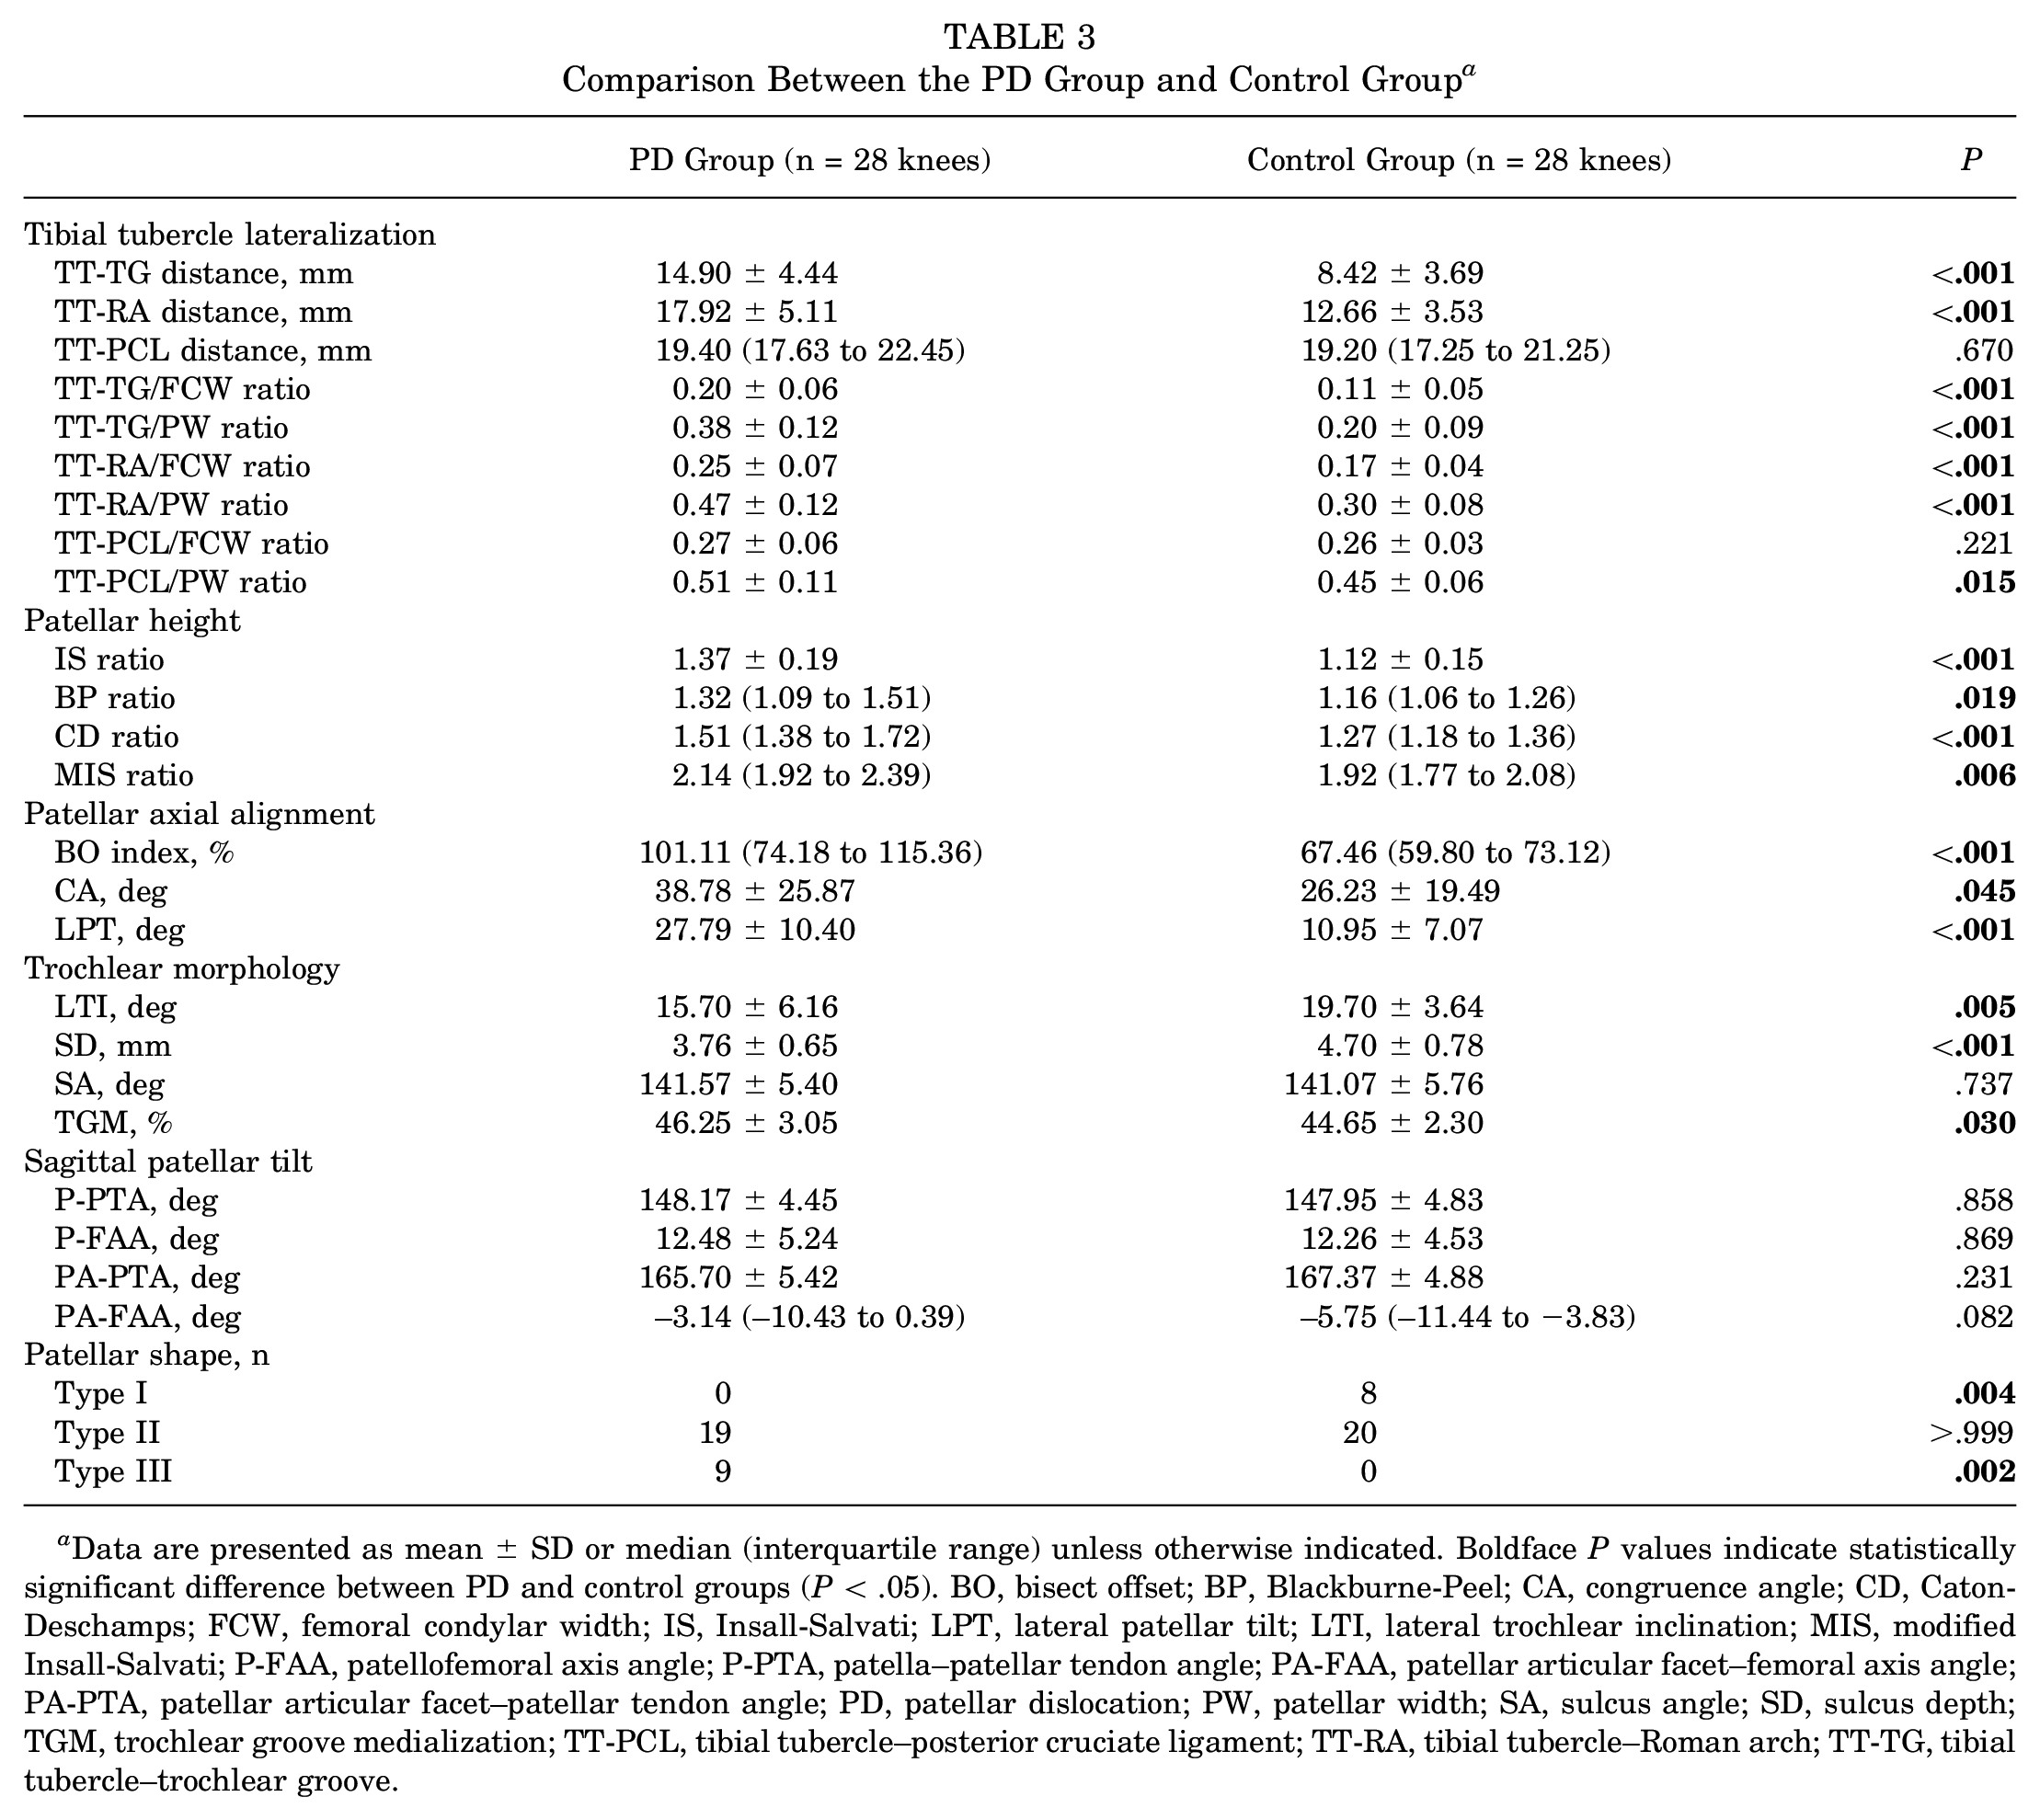
Data are presented as mean ± SD or median (interquartile range) unless otherwise indicated. Boldface P values indicate statistically significant difference between PD and control groups (P < .05). BO, bisect offset; BP, Blackburne-Peel; CA, congruence angle; CD, Caton-Deschamps; FCW, femoral condylar width; IS, Insall-Salvati; LPT, lateral patellar tilt; LTI, lateral trochlear inclination; MIS, modified Insall-Salvati; P-FAA, patellofemoral axis angle; P-PTA, patella–patellar tendon angle; PA-FAA, patellar articular facet–femoral axis angle; PA-PTA, patellar articular facet–patellar tendon angle; PD, patellar dislocation; PW, patellar width; SA, sulcus angle; SD, sulcus depth; TGM, trochlear groove medialization; TT-PCL, tibial tubercle–posterior cruciate ligament; TT-RA, tibial tubercle–Roman arch; TT-TG, tibial tubercle–trochlear groove.
ROC Analysis of TTL Parameters
The results of the ROC analysis indicated that the TT-TG/PW ratio had the highest diagnostic accuracy for PD among the conventional and individualized TTL parameters (AUC = 0.890) (Table 4). Other individualized TTL parameters with high diagnostic accuracy (AUC ≥ 0.8) included TT-TG/FCW (AUC = 0.866), TT-RA/FCW (AUC = 0.853), and TT-RA/PW (AUC = 0.878). The more the measurement relating to individualized TTL ratio contributed to patellar stability, the stronger the predictive ability was.
Diagnostic Ability of Conventional and Individualized Tibial Tubercle Lateralization Parameters for PD a

Boldface P values indicate statistical significance (P < .05). AUC, area under the receiver operating characteristic curve; FCW, femoral condylar width; PD, patellar dislocation; PW, patellar width; TT-PCL, tibial tubercle–posterior cruciate ligament; TT-RA, tibial tubercle–Roman arch; TT-TG, tibial tubercle–trochlear groove.
Relationship Between TT-TG/PW Ratio and Other Risk Factors of PD
Within the PD group, the TT-TG/PW ratio was positively correlated with patellar axial alignment (BO index, CA, and LPT; r = 0.610, 0.465, 0.635, respectively) and sagittal patellar tilt (P-FAA and PA-FAA; r = 0.553 and 0.418, respectively). TT-TG/PW ratio was greater in type II patella (P = .017) (Table 5).
Relationship Between TT-TG/PW Ratio and Other Risk Factors of PD (n = 28 knees) a

Boldface P values indicate statistical significance (P < .05). BO, bisect offset; BP, Blackburne-Peel; CA, congruence angle; CD, Caton-Deschamps; IS, Insall-Salvati; LPT, lateral patellar tilt; LTI, lateral trochlear inclination; MIS, modified Insall-Salvati; PD, patellar dislocation; P-FAA, patellofemoral axis angle; P-PTA, patella–patellar tendon angle; PA-FAA, patellar articular facet–femoral axis angle; PA-PTA, patellar articular facet–patellar tendon angle; PW, patellar width; SA, sulcus angle; SD, sulcus depth; TGM, trochlear groove medialization; TT-TG, tibial tubercle–trochlear groove.
Data are TT-TG/PW values (mean ± SD).
Discussion
Our main findings were twofold. First, individualized TTL parameters predicted PD better than conventional parameters alone, with the TT-TG/PW ratio being the best predictor in our study (AUC = 0.890). Second, in the PD group, the TT-TG/PW ratio was found to be positively correlated with patellar axial alignment (BO index, CA, and LPT; r = 0.610, 0.465, 0.635, respectively) and sagittal patellar tilt (P-FAA and PA-FAA; r = 0.553 and 0.418, respectively), and a greater TT-TG/PW ratio was more often found in knees with Wiberg type II versus type III patella (P = .017).
The TT-TG distance has long been used to quantify the position of the tibial tubercle and as a surgical indication for tibial tubercle osteotomy. However, the TT-TG distance, as well as the later proposed TT-RA distance and TT-PCL distance, does not consider patient size and anatomy. In our study, we calculated the ratios of the TT-TG, TT-RA, and TT-PCL distance to the FCW and PW, respectively, as individualized TTL parameters. The diagnostic ability for PD of the ratios and the TT-TG, TT-RA, TT-PCL distance alone were analyzed. The results showed that the individualized TTL parameters showed better diagnostic performance than the conventional TTL parameters alone and individualized ratios using PW were more predictive than those using FCW. Although the ratio of the TT-TG distance to patient-specific anatomic measurements improved the predictive ability for PD in this study, the denominator is not an arbitrary selection of a patient-specific anatomy. Studies on individualized TTL parameters involving other knee anatomic structures associated with patellar instability or even extending to parameters such as height and weight still need to be continued. It helps to propose the most reliable individualized preoperative planning parameters for patients requiring tibial tuberosity osteotomies. In our study, PW appeared to be slightly more involved in patellar stability than FCW and therefore better for predicting.
Several studies previously revealed the relationship between conventional TTL parameters (such as TT-TG) and some risk factors of PD5,45; however, no study had yet analyzed the relationship between individualized TTL parameters and other contributing factors of PD. When analyzing the relationship between the TT-TG/PW ratio and patellar axial alignment, we found a positive correlation between the TT-TG/PW ratio and both lateral patellar displacement and LPT, which was consistent with previous studies.5,45 Such associations between TTL and patellar axial position would seem to be logical. Pace et al 38 suggested that a laterally tilted patella on a dysplastic trochlea would lead to the external rotation of the tibia. Of the 4 parameters reflecting sagittal patellar tilt, the TT-TG/PW ratio correlated with 2 of them (P-FAA and PA-FAA), showing that TTL was associated with posterior tilt of the superior pole and anterior tilt of the inferior pole of the patella. Of course, it is not enough to draw hasty conclusions based on this result alone. No study has yet analyzed the relationship between TTL and sagittal patellar tilt. Although our study failed to clarify convincing conclusions, it provides a unique perspective on the effect of TTL for subsequent studies.
When we categorized the knees into type II and type III patella, we found that the TT-TG/PW ratio was greater in the type II patella group. In general, the more severe the patellar dysplasia, the more likely patellar instability would occur, as indicated by the results of the PD and control groups in our study. We believe that the reason for the greater TT-TG/PW ratio in the knees with type II patella is because they are more stable than knees with type III patella, and thus a greater lateral force is required for a PD situation to occur.
Similar to previous studies,2,3,32,33 the present study yielded characteristics of knees prone to PD. Risk factors shown to be significantly different between knees in the PD and control groups included TTL, patella alta, lateral patellar displacement, LPT, trochlear dysplasia (quantitatively measured with LTI, SD, and TGM), and patellar dysplasia (type III patella). However, as a measurement of trochlear dysplasia, the SA showed no significant difference between the 2 groups. We hypothesize that it was due to the fact that the measurements of SA obtained in this study were based on CT in full knee extension, whereas traditional SA measurements are based on axial radiographs obtained at 30° or 45° of knee flexion, 14 affecting the measurement section of the femoral trochlea.
Limitations
There are several limitations in the present study. First, the PD and control groups were not strictly matched for age. It was a difficult decision due to the fact that PD occurs most often in adolescents and was based on the characteristic of radiation of 4D-CT examination. Second, only the relationship between the TT-TG/PW ratio and other risk factors in the PD group was analyzed. The association in the control group will be investigated in further studies. Third, most of the included PD cases were bilateral knees. Due to the radiation exposure of the 4D-CT examination, we obtained as many cases as possible with fewer CT examinations. Last, no analysis with the quadriceps relaxed was performed. We sought to perform investigation with isotonic contraction of the quadriceps to truly reflect the functional state of the patellofemoral joint.
Conclusion
With the knee fully extended and quadriceps isotonically contracted, the TT-TG/PW ratio was the best predictor of PD and reflected individualized TTL, which helps clinical preoperative planning.
Footnotes
Final revision submitted February 21, 2024; accepted March 18, 2024.
The authors declared that there are no conflicts of interest in the authorship and publication of this contribution. AOSSM checks author disclosures against the Open Payments Database (OPD). AOSSM has not conducted an independent investigation on the OPD and disclaims any liability or responsibility relating thereto.
Ethical approval for this study was obtained from the First Affiliated Hospital of Chongqing Medical University (ref No. 2021-105).