
Abstract
Background:
Assessment of 3-dimensional (3D) femoral head coverage is critical in evaluating, preoperative planning, and treating hip dysplasia.
Purpose:
To (1) propose a mathematical model to establish 3D femoral head coverage using conventional computed tomography (CT), (2) determine the correlation of 2D parameters with 3D coverage, and (3) characterize the patterns of dysplasia based on 3D morphology.
Study Design:
Cross-sectional study; Level of evidence, 3.
Methods:
We identified 30 patients (n = hips) with symptomatic dysplasia and 30 patients (n = hips) without dysplasia. Patients with dysplastic hips were matched with regard to sex, age, and body mass index to those with nondysplastic hips. Preoperative CTs were analyzed using 3D software, and 3D femoral head surface area coverage (FHSAC; in %) was assessed in 4 quadrant zones: anteromedial, anterolateral, posteromedial, and posterolateral. To assess lateral coverage of the femoral head, we introduced the anterolateral femoral head coverage angle (ALFC) and the posterolateral femoral head coverage angle (PLFC).
Results:
Reduced femoral head coverage was more pronounced in dysplastic versus nondysplastic hips in the anterolateral quadrant (18% vs 40.7%, respectively) and posterolateral quadrant (35.8% vs 56.9%, respectively) (P < .0001 for both). Dysplastic hips had smaller ALFC and PLFC (18.4° vs 38.7°; P < .0001; 47.2° vs 72.3°; P = .0002). Anterolateral and posterolateral FHSAC were strongly correlated with the ALFC (r = 0.88; P < .0001) and the PLFC (r = 0.82; P < .0001) along with the lateral center-edge angle (anterolateral, r = 0.75; P < .0001; posterolateral, r = 0.73; P < .0001). Prediction models established for FHSAC had strong agreement with explanatory CT variables (anterolateral: r = 0.91; P < .0001; posterolateral: r = 0.90; P < .0001). The cutoff values for anterolateral and posterolateral FHSAC were 25% and 41%, respectively. In dysplastic hips, global deficiency was most common (15/30 hips), 9 hips showed an anterolateral deficiency, and 4 hips had a posterolateral deficiency pattern.
Conclusion:
The ALFC and The PLFC were strongly correlated with 3D lateral FHSAC and were able to predict 3D coverage accurately.
Reduced femoral head coverage in the dysplastic hip results in instability, acetabular rim overload, and subsequent labrum and articular cartilage damage. 15 Excessive correction during the periacetabular osteotomy can cause iatrogenic secondary femoroacetabular impingement, leading to disease progression and early conversion to total hip replacement.4,12,24 Therefore, a precise and accurate correction of acetabular coverage is critical to obtain optimal results.
Acetabular coverage of the femoral head has traditionally been evaluated using 2-dimensional (2D) radiographic parameters 29 ; nonetheless, the precise location of acetabular deficiency has a variation that may not be identified in 2D.7,29,33 The lateral center-edge angle (LCEA), anterior center-edge angle (ACEA), and Tönnis angle are gold-standard radiographic measurements for confirming or ruling out hip dysplasia. However, these angles cannot characterize different acetabular deficiency patterns in 3 dimensions.13,17,30 Several investigators have assessed 3D femoral head coverage beyond 2D evaluation.2,5,17,22,27,30 Nepple et al 22 measured radial coverage angles at different acetabular clockface positions in 3D computed tomography (CT) and showed considerable variability in deficiency patterns, including global and locally reduced coverage in the anterosuperior and posterosuperior regions, providing an in-depth characterization of the femoral head coverage.22,32 Thus, 3D femoral head coverage assessment is clinically important for pre- and postoperative evaluation of hip dysplasia.
Several studies have investigated 3D femoral head coverage using covered volume and surface area calculations with 3D CT.9,17,21,31 This allows quantification of overall femoral coverage beyond a single slice plane. The femoral head surface area coverage is clinically relevant because hip joint stress is defined as the intensity of force imparted onto the articular surface per unit area; the decreased contact surface area limits the area available for appropriate load distribution.6,8 Abnormal contact stresses result in increased joint reaction forces, pain, and intra-articular derangement. However, only a few studies have evaluated this, and these only assessed overall femoral head coverage; in addition, to our knowledge, there are no reports delineating deficiency pattern subtypes using 3D surface area coverage. A more detailed 3D evaluation of the anterolateral and posterolateral areas, where under coverage is particularly pronounced, would be more useful for preoperative planning because it may help the surgeon identify areas lacking coverage.
In the present study, we evaluated a novel method of quantitatively evaluating 3D femoral head coverage using surface area in quadrant zones—anteromedial, anterolateral, posteromedial, and posterolateral. Although such 3D evaluations provide useful information, they are difficult to use clinically because of cost and time limitations. Therefore, we believed it would be clinically meaningful to study the correlation between 3D femoral coverage and parameters that can be assessed with routine CT and explore predictive formulas using these parameters. In addition, to predict the anterolateral and posterolateral coverage with high accuracy and correlation, we introduced 2 novel CT parameters: the anterolateral femoral head coverage angle (ALFC) and posterolateral femoral head coverage angle (PLFC) on the sagittal slice, corresponding to the lateral third of the femoral head instead of the femoral head center, as it is the lateral third of the femoral head that is under coverage in patients with hip dysplasia.
This study aims were to (1) propose a mathematical model to establish 3D lateral surface area coverage of the femoral head using conventional low-dose CT; (2) determine the correlation of 2D CT parameters with 3D coverage (%); and (3) define subtypes of acetabular dysplasia based on 3D quadrant femoral head coverage. We hypothesized that the ALFC and PLFC would predict 3D surface area coverage in the anterolateral and posterolateral quadrants.
Methods
Study Design and Patients
The protocol for this study received institutional review board approval, and the study patients provided written informed consent. We used an established longitudinal cohort of patients who had undergone hip preservation surgery between January 1, 2016, and December 31, 2019. All patients had our established standard radiographs, including a standing anteroposterior (AP) pelvic view, a Dunn view, and a false-profile view. As part of routine preoperative planning, a low-dose pelvic CT scan (0.75-1.25 mSv, equivalent to 3-5 AP pelvic radiographs) was performed in all patients before surgery.
Patients were excluded from the study if they had ipsilateral hip surgery, muscular disorder, moderate or advanced hip osteoarthritis (Tönnis grade ≥2), borderline dysplasia (20°≤ LCEA ≤25°), or severe dysplasia (LCEA ≤5°), where coverage assessment on a lateral sagittal slice was unable to be performed. Symptomatically dysplastic hips were diagnosed using standard radiographic measurements (5°< LCEA ≤20°; n = 30). Nondysplastic hips of patients undergoing surgery for the treatment of symptomatic femoroacetabular impingement and/or labral tear (LCEA >25°; n = 30) acted as controls. Dysplastic hips were matched to controls hips in a 1-to-1 ratio based on age, sex, and body mass index (Figure 1).
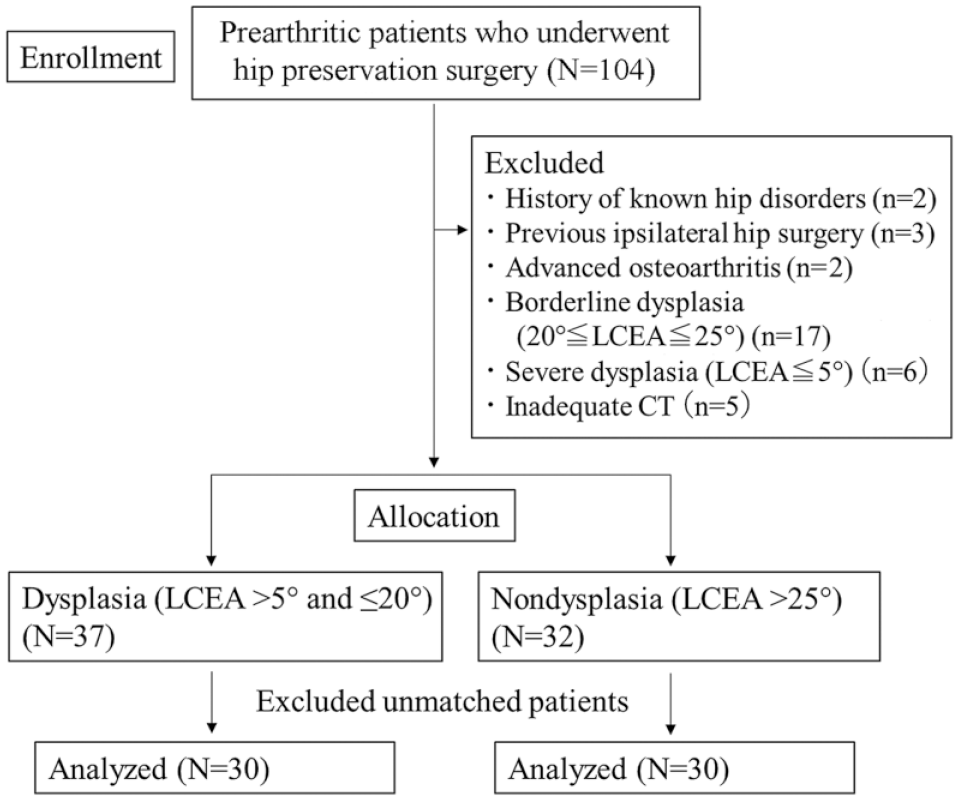
Study cohort selection process. LCEA, lateral center-edge angle.
Radiographic Evaluation
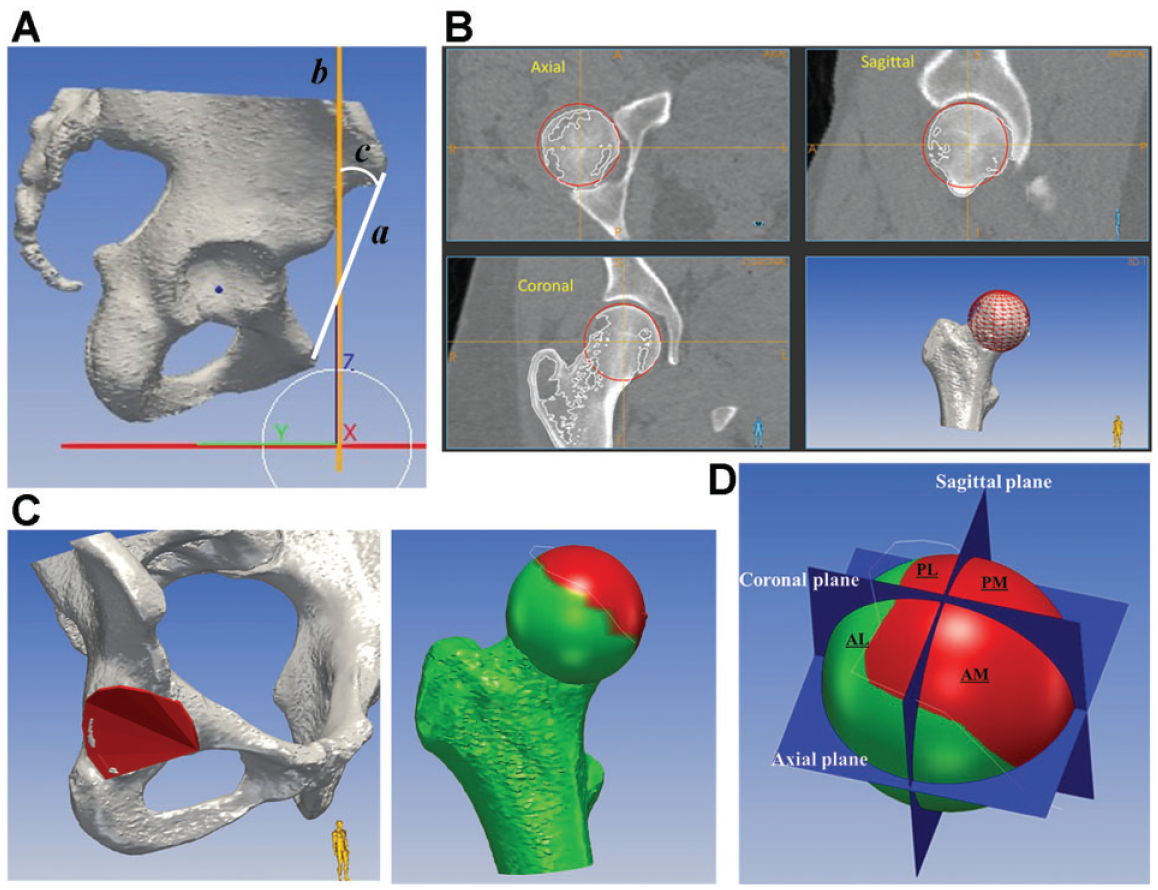
CT scans were analyzed using computer-modeling software (Zed Hip; Lexi). The femoral head center was determined using the best-fit sphere, and the coordinate system was based on the anatomic anterior pelvic plane (APP).21,26 The coronal planes were sliced parallel to the APP, and sagittal and axial planes were sliced vertically to the APP. The LCEA and acetabular angles were measured in the coronal plane through the femoral head center (Figure 2, A and B). The ACEA and the posterior center-edge angle (PCEA), which indicate the anterior and posterior coverage, respectively, 6 were measured in the sagittal plane (Figure 2C). Moreover, the new proposed angles, ALFC and PLFC, were measured and defined as the angles between a vertical line through the femoral head center and a line connecting the hip center to the most anterior and posterior aspects of the acetabulum, respectively, on the sagittal CT plane, corresponding to the lateral third of the femoral head while cross-referencing the coronal and axial slices (Figure 2, D and E).

(A and B) Lateral center-edge angles (a) and acetabular angles (b) were measured in the coronal plane passing through the femoral head center. (C) The anterior center-edge angle (c) and the posterior center-edge angle (d) were measured in the sagittal plane passing through the femoral head center. (D) Coronal and axial views through the femoral head center create the sagittal plane through the lateral third of the femoral head. A ruler was used to calculate the diameter of the femoral head and select the sagittal slice closest to the lateral third of the femoral head (d = diameter). (E) Measurement of the anterolateral femoral head coverage angle (e) and the posterolateral femoral head coverage angle (f) in the lateral third sagittal slice.
3D Femoral Head Coverage
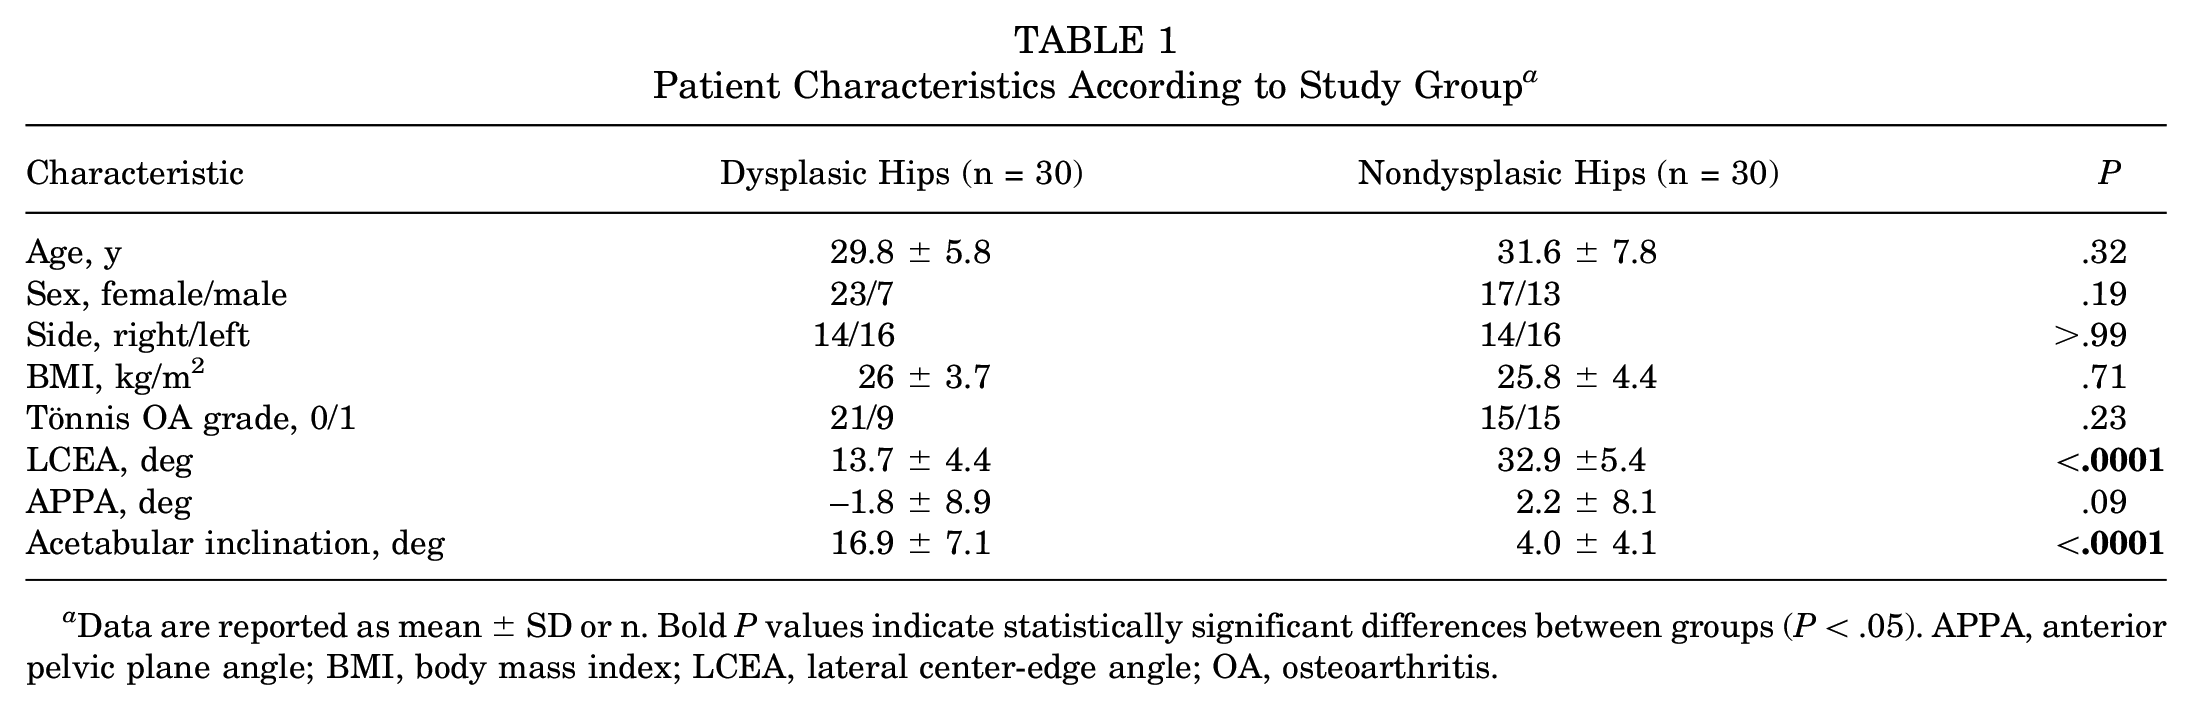
CT scan image datasets were transferred to a 3D multiplanar planning software (MediCAS; medicas3d.com). The femoral head center was determined using the best-fit sphere. First, the pelvic position was standardized with reference to the APP coordinate system.21,26 Before CT evaluations, the anterior pelvic plane angle (APPA), the angle between the line connecting the midpoint of both anterior superior iliac spines and the pubic symphysis, and the vertical line on a lateral pelvic radiograph in the standing position, and the vertical to horizontal ratio of the pelvic foramen on an AP pelvic radiograph in the standing position were measured as an index of pelvic tilt. 14 The pelvic plane sagittal axis was rotated using the APPA values measured on an AP pelvic radiograph in the standing position for each patient (Figure 3, A and B). Further, the vertical/horizontal ratio of the pelvic foramen was verified to match that of the AP radiograph in the standing position.23,28 To measure femoral coverage, the femoral head surfaces and acetabular cortical bone were reconstructed semiautomatically, and the acetabulum rim was projected to the nearest points on the surface of the femoral head to create a line of acetabular coverage (Figure 3C). Next, the femoral head was divided into 4 anatomic quadrants based on the coronal, sagittal, and axial planes. These 3 planes defined 4 anatomic regions of the proximal femoral head hemisphere: anterolateral, anteromedial, posterolateral, and posteromedial (Figure 3D). The percentage of femoral head coverage in the 4 quadrants was determined by evaluating the area (in mm2) covered by acetabulum in each region: (covered area/total area of region) × 100%.
(A) The anatomic anterior pelvic plane was determined through a line starting at the anterior superior iliac spine and directed to the pubic symphysis (a). The functional pelvic plane (b) was individualized using the anterior pelvic plane angle (c), the angle between the line connecting the midpoint of both anterior superior iliac spine and the pubic symphysis and the vertical line on a lateral pelvic radiograph in the standing position. (B) The femoral head center was determined with the best-fit technique. (C) The rim of the acetabulum was projected on the surface of the femoral head to define a femoral head coverage area covered by acetabulum (highlighted in red). (D) The femoral head was divided into anatomic 4 quadrants: AL, AM, PL, and PM. AL, anterolateral; AM, anteromedial; PL, posterolateral; PM, posteromedial.
Statistical Analysis
The sample size was calculated using G*Power 3. 10 In estimating the necessary sample size, the anterolateral and posterolateral 3D coverage values were used. The sample size was estimated based on our pilot study with 10 samples to detect a 10% mean difference in femoral head coverage with an estimated standard deviation of 12%, along with a 2-tailed alpha level of .05 and a beta of 0.2. The sample size calculations estimated a sample size of 24 for each group.
All values are presented as mean ± standard deviation. Dedicated statistical software packages (StatView 5.0; Abacus Concepts, and EZR; Saitama Medical Center, Iichi Medical University) were used to analyze data. Comparisons between the dysplasic and nondysplasic groups were performed using the unpaired t test for quantitative variables and the Fisher exact test for qualitative variables. To evaluate the reproducibility of the measurements, a subset of 10 hips from each group was assessed twice by the same rater (T.K. for 2D CT measurement and L.R. for 3D measurement) at intervals of >4 weeks for intrarater reliability and once by another rater (C.N.) for interrater reliability. Reliability was calculated using the intraclass correlation coefficient.
Correlations between CT parameters and 3D femoral head coverage percentage by quadrant were assessed using the Pearson correlation coefficient. Stepwise multiple linear regression analyses with Akaike information criteria were performed with 3D anterolateral and posterolateral femoral head coverage percentages as objective variables and CT parameters showing significant correlations as explanatory variables. Cutoff values for 3D femoral head coverage at the anterolateral and posterolateral quadrants were determined using receiver operating characteristic (ROC) curves. Deficiency patterns were categorized into 4 groups based on the cutoff values determined by ROC: global deficiency, anterolateral deficiency, posterolateral deficiency, and no deficiency. P < .05 was considered statistically significant.
Results
Patient Characteristics
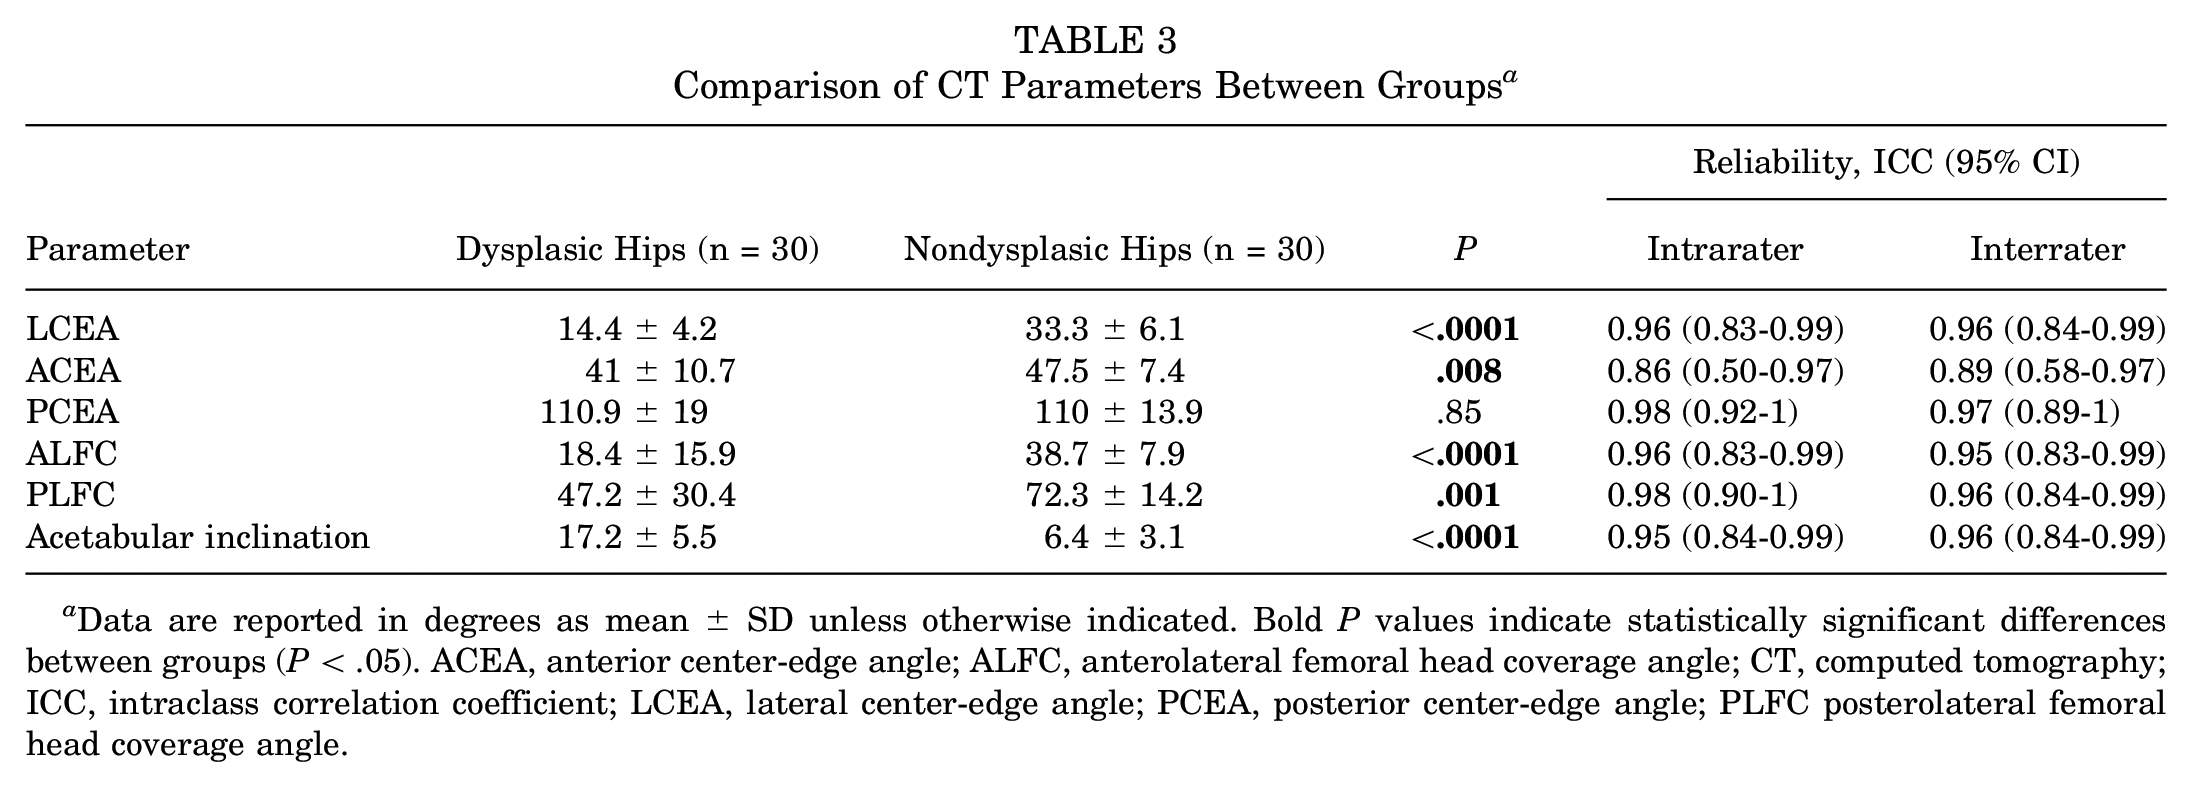
The dysplastic hip group included patients with a significantly lower LCEA and higher acetabular inclination than the nondysplastic hip group (P < .0001 for both). There were no group differences regarding the other characteristics (Table 1).
Patient Characteristics According to Study Group a
Data are reported as mean ± SD or n. Bold P values indicate statistically significant differences between groups (P < .05). APPA, anterior pelvic plane angle; BMI, body mass index; LCEA, lateral center-edge angle; OA, osteoarthritis.
3D Femoral Head Coverage
Dysplastic hips had significantly lower coverage in the anteromedial, anterolateral, and posterolateral quadrants than the nondysplastic group (P≤ .002 for all). There was no difference between the groups in posteromedial coverage (Table 2). The intrarater and interrater reliabilities for all coverage parameters are good or excellent.
Comparison of 3D Femoral Head Coverage Between Groups a

Data are reported in percentage as mean ± SD unless otherwise indicated. Bold P values indicate statistically significant differences between groups (P < .05). ICC intraclass correlation coefficient; 3D, 3-dimensional.
CT Parameters
Dysplastic hips had a significantly smaller LCEA, ACEA, ALFC, and PLFC, and greater acetabular inclination than nondysplastic hips (P≤ .008 for all) (Table 3). The intrarater and interrater reliabilities for all CT parameters are good or excellent. No significant differences were found when comparing the CT parameters between female and male patients (Table 4).
Comparison of CT Parameters Between Groups a
Data are reported in degrees as mean ± SD unless otherwise indicated. Bold P values indicate statistically significant differences between groups (P < .05). ACEA, anterior center-edge angle; ALFC, anterolateral femoral head coverage angle; CT, computed tomography; ICC, intraclass correlation coefficient; LCEA, lateral center-edge angle; PCEA, posterior center-edge angle; PLFC posterolateral femoral head coverage angle.
Comparison of Female and Male Patients Within Groups a
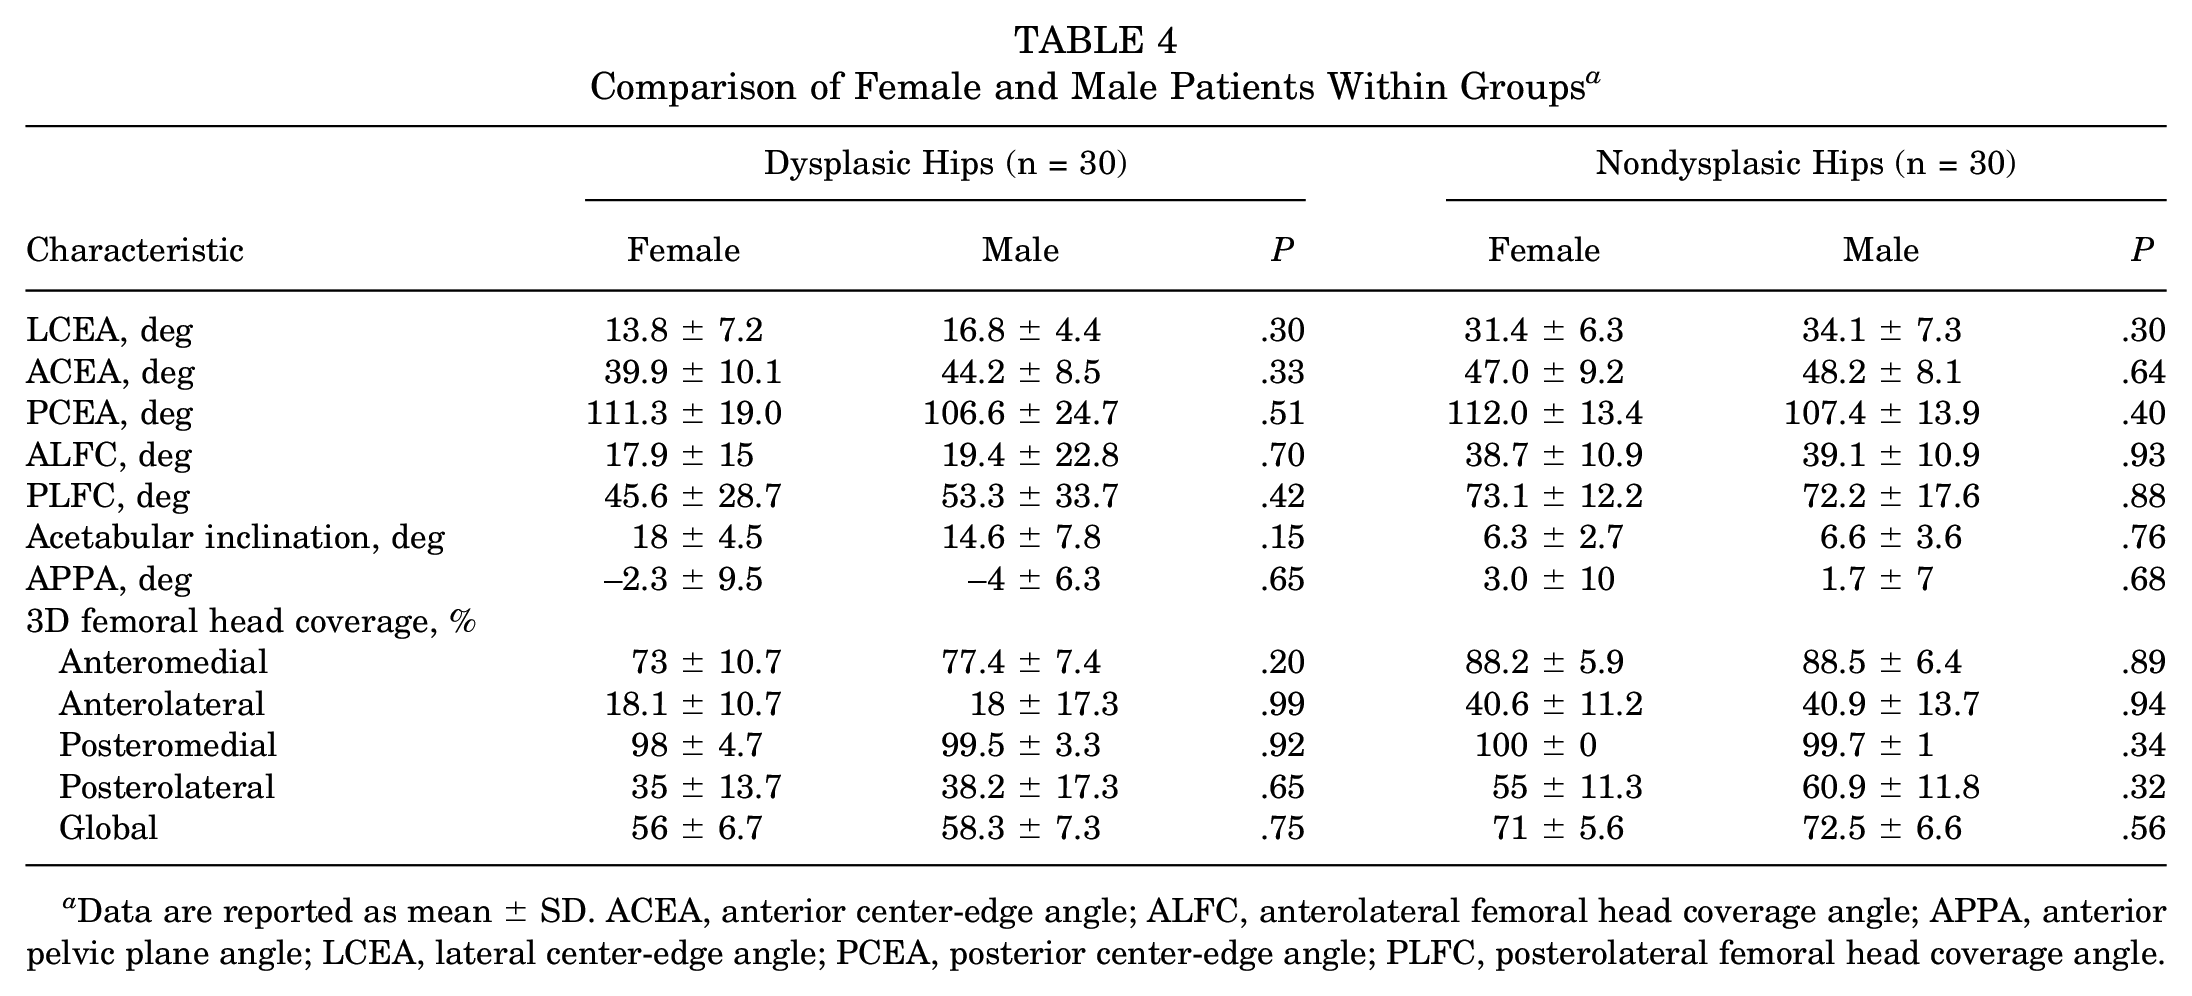
Data are reported as mean ± SD. ACEA, anterior center-edge angle; ALFC, anterolateral femoral head coverage angle; APPA, anterior pelvic plane angle; LCEA, lateral center-edge angle; PCEA, posterior center-edge angle; PLFC, posterolateral femoral head coverage angle.
Correlation Between CT Parameters and 3D Femoral Head Coverage
The LCEA and acetabular inclination had a moderate correlation with the anteromedial, anterolateral, and posterolateral quadrants in 3D coverage, and APPA had a weak correlation with the anterolateral coverage. In contrast, the ALFC was strongly correlated with the anterolateral coverage (Figure 4A), whereas the ACEA had a weaker moderate correlation with anterolateral coverage. The PLFC also showed a strong correlation with posterolateral coverage (Figure 4B), while there was no significant correlation between PCEA and posterolateral coverage (Table 5).

Graphs showing the correlation between (A) the 3D ALFC and (B) the 3D PLFC. ALFC, anterolateral femoral head coverage angle; PLFC, posterolateral femoral head coverage angle.
Correlation Between CT Parameters and Quadrant 3D Femoral Head Coverage a
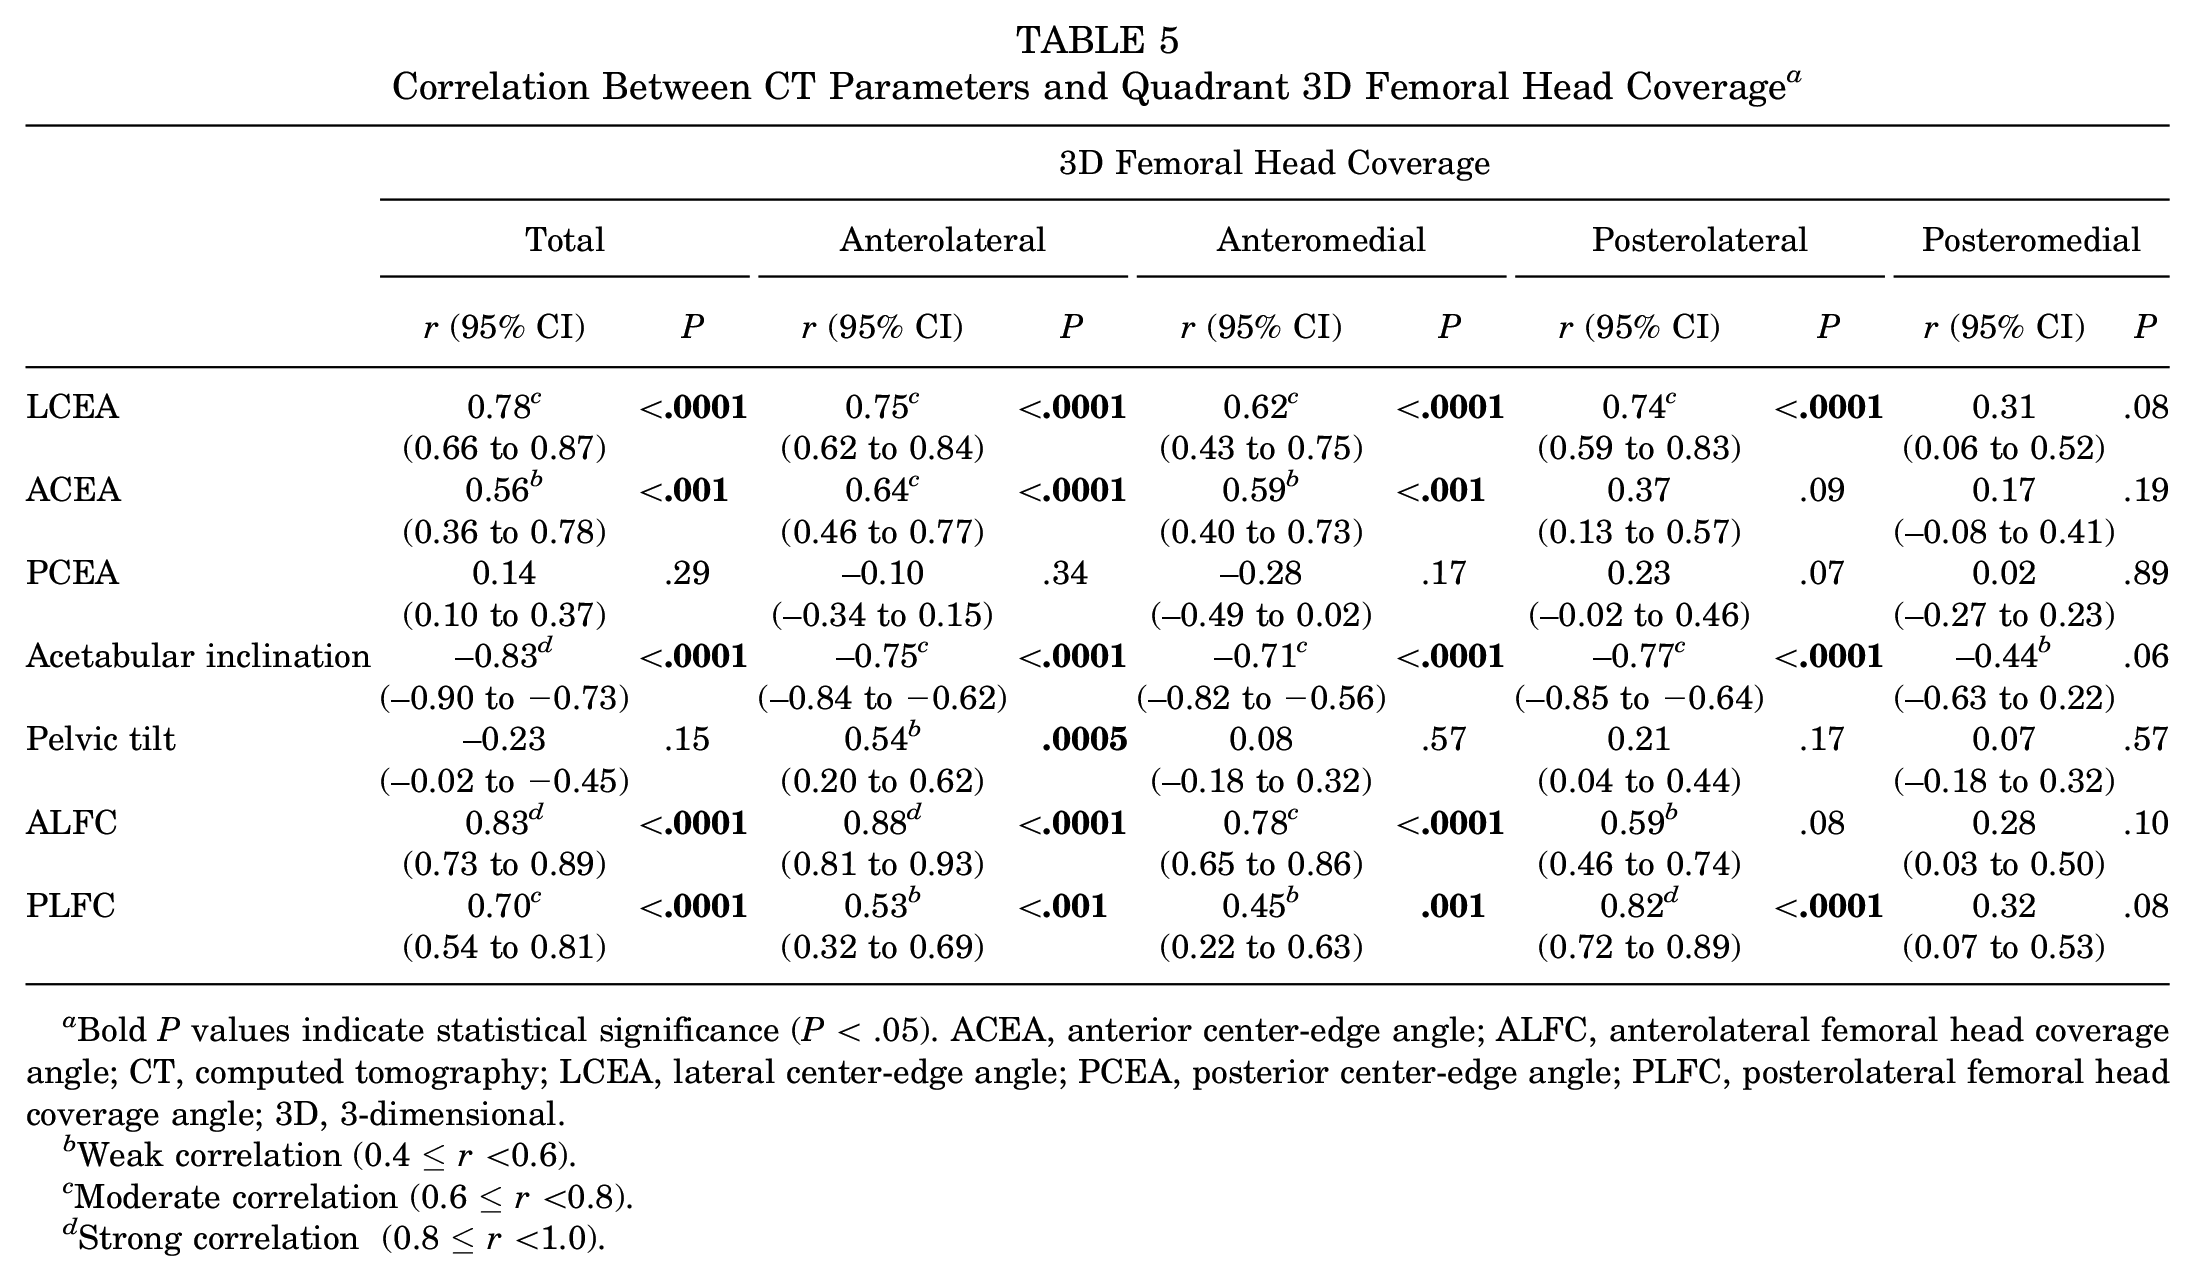
Bold P values indicate statistical significance (P < .05). ACEA, anterior center-edge angle; ALFC, anterolateral femoral head coverage angle; CT, computed tomography; LCEA, lateral center-edge angle; PCEA, posterior center-edge angle; PLFC, posterolateral femoral head coverage angle; 3D, 3-dimensional.
Weak correlation (0.4 ≤r <0.6).
Moderate correlation (0.6 ≤r <0.8).
Strong correlation (0.8 ≤r <1.0).
Prediction of 3D Anterolateral and Posterolateral Femoral Head Coverage
Multiple linear regression analysis revealed that anterolateral 3D coverage was significantly affected by the LCEA, ALFC, and APPA, while other variables (ACEA, acetabular inclination, and PLFC) were excluded from explanatory variables in a stepwise process. Posterolateral 3D coverage was significantly affected by the LCEA, PLFC, and acetabular inclination, while the ALFC was excluded from explanatory variables stepwise. The results of the multiple regression analysis are shown in Table 6.
Results of Multiple Linear Regression Analysis a

ALFC, anterolateral femoral head coverage angle; APPA, anterior pelvic plane angle; LCEA, lateral center-edge angle; PLFC, posterolateral femoral head coverage angle; 3D, 3-dimensional.
The following prediction formulas were established for 3D femoral head coverage percentage:

The prediction models showed strong agreement with the explanatory variables (anterolateral: r = 0.91; P < .0001; posterolateral: r = 0.90; P < .0001).
The ROC cutoff values for dysplastic anterolateral and posterolateral coverage were 25% and 41%, respectively (Figure 5). The distribution of deficiency patterns was significantly different between dysplastic and nondysplastic hips (P < .0001) (Table 7). In dysplastic hips, global deficiency was most common (15 hips; 50%), while 9 hips (30%) showed anterolateral deficiency, 4 hips (13.3%) had posterolateral deficiency, and 2 hips (6.7%) had no deficiency patterns (Table 7). Most nondysplastic hips (28/30 [93.3%]) had no deficiency patterns, and 2 hips (6.7%) had an anterolateral or posterolateral deficiency.

Cutoff values on the ROC curve for 3D (A) anterolateral and (B) posterolateral percentage femoral head surface area coverage. AUC, area under the receiver operating characteristic curve; ROC, receiver operating characteristic curve; 3D, 3-dimensional.
Comparison of Deficiency Pattern of Acetabular Coverage Between Dysplastic and Nondysplastic Hips a

Data are reported as No. of hips. Significant difference between groups in distribution of deficiency pattern (P < .0001, Fisher exact test).
Discussion
To our knowledge, this is the first study to quantitatively evaluate the 3D femoral head coverage in 4 quadrants to characterize dysplastic and nondysplastic hips. The study findings suggest less acetabular coverage in the anterolateral and posterolateral quadrants in dysplastic hips compared with nondysplastic hips, identifying different morphological patterns of coverage deficiency based on 3D morphology. Most importantly, we introduced novel mathematical formulas to predict anterolateral and posterolateral 3D coverage separately and accurately using novel proposed parameters, the ALFC and PLFC, which could easily be obtained with low-dose preoperative conventional CT.
The total proportions of femoral head coverage were reported as 77% to 79% in a normal cohort 18 and 51% to 53% in a cohort with hip dysplasia using plain AP radiographs or 2D images projected from 3D CT.9,16 Recently, a few researchers have reported femoral head coverage using a 3D-covered volume or surface area of the femoral head.17,21 Kohno et al 17 evaluated the covered surface area in 3D and reported an overall femoral head coverage of approximately 60% for mild to moderate hip dysplasia. The present study showed a mean 3D femoral head coverage in a total area of 56.6% for mild to moderate dysplasia, similar to that reported in a previous study 17 that included a similar patient cohort (mean LCEA, 13.5°). In addition, this study evaluated the 3D femoral head coverage in 4 quadrant zones and confirmed that reduced coverage was more pronounced in the anterolateral and posterolateral quadrants than in the other quadrants. These detailed 3D evaluations of the anterolateral and posterolateral quadrants would provide useful information to surgeons as a first step in obtaining precise and accurate bony reorientation for hip dysplasia.
High variability of acetabular coverage in dysplastic hips has been reported using plain radiographs 29 and CT.1,3,25,31 Anda et al 3 investigated CT acetabular morphology using acetabular sector angle for hip dysplasia and reported that anterior deficiency was more prevalent than posterior deficiency. Nepple et al 22 reported a similar frequency of the 3 patterns (anterosuperior, posterosuperior, and global deficiency) using radial coverage angle on the multiple clockface positions. The present study evaluated 3D femoral head coverage by calculating the surface area in 4 quadrant zones and revealed less coverage in anterolateral and posterolateral quadrant for dysplastic hips and set the threshold value with excellent assignment of high area under the curve compared with nondysplastic hip. Based on this cutoff, global deficiency was the most common pattern in dysplastic hips (n = 15 hips; 50%), with the remaining 13 dysplastic hips (43.3%), showing localized deficiency patterns in the anterolateral and posterolateral quadrants. Furthermore, in this analysis, 2 of the dysplastic hips were false-negatives, and 2 of nondysplastic hips were false-positives. These observations suggest that the LCEA alone is not a sufficient marker to determine dysplasia in a specific quadrant. Therefore, 3D coverage evaluation in quadrant zones is important to judge the localized deficiency in the femoral head. Furthermore, this evaluation indicates that pattern classification and quantitative evaluation of 3D coverage, which tells us how much and what area of coverage is lacking, would be more clinically relevant than using 2D parameters alone. However, the cost and time spent on these 3D evaluations would make them difficult to use widely in the clinical field.
This study introduced new CT parameters (ALFC and PLFC) and novel mathematical formulas to predict anterolateral and posterolateral 3D coverage separately and accurately. These formulas provide useful information in preoperative planning for many surgeons without expensive 3D imaging software, and they contribute to a breakthrough for future intraoperative navigation systems during periacetabular osteotomy. Previously, several studies have proposed computer-assisted surgery for periacetabular osteotomy and described numerous potential benefits, including preoperative planning and visual feedback combined with intraoperative navigation.1,11,19,20 However, the main limitation of each system is the inability to assess the femoral head coverage intraoperatively. Real-time feedback of the 3D femoral head coverage in the quadrant zone would provide the surgeon with the information they need to prevent inaccurate and excessive coverage. Because our proposed parameters could be evaluated using intraoperatively available reference points (the anterior superior iliac spine and pubis symphysis) and information available through navigation, they provide valuable insights for the success of future intraoperative 3D coverage assessment using navigation tools.
Limitations
This study had several limitations. First, only symptomatic dysplastic hips were included, and controls consisted of nondysplastic hips undergoing hip preservation surgery. Although, the study would ideally include healthy controls without symptoms to decide the cut-ff value, these patients generally do not receive imaging. Second, although the pelvic tilt on radiographs in the standing position was used to individualize the functional pelvic CT plane, CT was performed in the supine position. Dynamic assessment during standing and walking should be considered in the future to assess better functional coverage of the femoral head. Third, femoral anteversion, which may affect femoral head coverage, was not evaluated because the knee was not imaged to minimize radiation exposure. This should be considered in the future. Fourth, the application of these additional measurements is time- and cost-consuming. It is necessary to continually search for simpler and more reasonable methods to be widely used. We believe that in the future, precise hip planning software could incorporate our models to provide this information to the surgeon during preoperative planning and decision-making.
Conclusion
Measuring 3D femoral head coverage in 4 quadrant zones confirmed less femoral head coverage in the anterolateral and posterolateral quadrants in dysplastic hips and characterized different morphological patterns of coverage deficiency. Moreover, we provided a predictive formula to define 3D lateral coverage of the femoral head, allowing surgeons to improve preoperative planning and implementation of periacetabular osteotomy.
Footnotes
Final revision submitted August 25, 2023; accepted September 7, 2023.
One or more of the authors has declared the following potential conflict of interest or source of funding: Research support was received from The Curing Hip Disease Fund and the Jackie and Randy Baker Research Funds. J.J.N. has received research support from Zimmer Biomet; education payments from Elite Orthopedics; consulting fees from Smith & Nephew and Responsive Arthroscopy; nonconsulting fees from Smith & Nephew; and royalties from Responsive Arthroscopy. J.C.C. has received research support from Zimmer Biomet; consulting fees from MicroPort Orthopedics, Zimmer Biomet, and Smith & Nephew; nonconsulting fees from Synthes GmbH; and royalties from MicroPort Orthopedics and Wolters Kluwer Health. C.P.-G. has received consulting fees from Stryker, Intellijoint, Tactoset, and Anika Therapeutics. AOSSM checks author disclosures against the Open Payments Database (OPD). AOSSM has not conducted an independent investigation on the OPD and disclaims any liability or responsibility relating thereto.
Ethical approval for this study was obtained from Washington University of St Louis (ref No. 201201074).