
Abstract
Background:
Measuring anterior hip coverage on false-profile (FP) radiographs is important for judging anterior hip coverage. Conventionally, the anterior center-edge angle (ACEA) is measured from the anterior edge of the acetabular sourcil (sourcil ACEA); however, the anterior bone edge is also used as the anterior landmark.
Purpose:
To determine whether the sourcil ACEA or the bone-edge ACEA better represents the anterior coverage of the hip joint.
Study Design:
Descriptive laboratory study.
Methods:
We retrospectively observed 49 hips in 49 patients who underwent isolated periacetabular osteotomy. The sourcil ACEA was measured according to the standard procedure. Then, 3-dimensional (3D) volumetric models were made from computed tomographic data. The acetabular surface of the 3D model was labeled and projected onto a simulated FP radiograph, enabling the edge of the acetabulum to be identified. This simulated FP radiograph was used to measure the “true ACEA,” as well as the sourcil ACEA and the bone-edge ACEA, and the 3 measurements were compared. Statistical analysis was performed—including testing for normal distribution, measuring interobserver agreement, evaluating differences between measurements, and validating correlation.
Results:
The mean sourcil ACEA was 8.6° (range, –3.9° to 31.7°) smaller than that of the true ACEA (P < .001); there was a strong correlation (r = 0.81; P < .001) between the 2. The mean bone-edge ACEA was 16.8° (range, –1.7° to 45.4°) greater than that of the true ACEA (P < .001); there was a moderate correlation (r = 0.57; P < 0.001) between the 2.
Conclusion:
Both the sourcil ACEA and bone-edge ACEA differed from the true ACEA. However, compared with the bone-edge ACEA, the sourcil ACEA was numerically closer to the true ACEA and had a stronger correlation with it .
Clinical Relevance:
While the exact edge of the true bearing surface of the articular cartilage may not be visible on the FP radiograph, the sourcil ACEA can be effectively utilized as a reliable surrogate when evaluating the anterior acetabular coverage in hip preservation surgery.
The anterior center-edge angle (ACEA) measurement on a false-profile (FP) radiograph is a clinically important measurement of anterior hip coverage. It helps to determine the stability of the anterior hip. 20 Although observation of the 3-dimensional (3D) anterior coverage of the hip joint on computed tomography (CT) provides more details of the morphology of the acetabulum, measuring the anterior coverage based on CT data is greatly affected by the pelvic tilt because of the supine position.10,12,17,23,26,28,29,32 Furthermore, the amount of radiation released during CT is also much higher than that released during plain radiography. Measuring the ACEA on FP radiographs is still a common method for determining anterior hip coverage. There are abundant clinical data on the relationship between this angle and clinical prognosis .1,2,8,16,19,22,33
There is currently no uniform method of measuring the ACEA on standard FP radiographs. Initially, Lequesne and de Sèze 20 defined the ACEA as the angle between the line from the anterior edge of the acetabular sourcil to the center of the femoral head and the vertical line passing through the center of the femoral head on the FP radiograph (“sourcil ACEA”). In most clinical studies, researchers use this method to measure the ACEA. However, the anterior edge of the acetabular sourcil cannot be identified in a large portion of dysplastic hips, making it difficult to reliably determine the ACEA in these patients.3,5,6 Some researchers have used the anterior bone edge as the anterior edge of the acetabulum, on which it is easier to select points for measurement, instead of the edge of the acetabular sourcil.12,23,30 However, these measurements have proven to be different in patients with normal or mild acetabular dysplasia. To our knowledge, it has not yet been determined which landmark can be a more instructive measurement for guiding hip preservation surgery.4,7,15,21,24,27
In this study, we increased the visibility of the actual edge of the articular surfaces of the acetabulum and the edge of the acetabular sourcil on simulated images generated from the 3D model and used this to create a “true ACEA” measurement. We proposed the following questions: Is the sourcil ACEA or bone-edge ACEA equal to the true ACEA? What are the correlations between them?
Methods
Participants
After obtaining approval from our institutional review board, we reviewed 60 patients who underwent isolated periacetabular osteotomy at our center between July and October 2020. All patients were classified 13 as Crowel 0-1 and had no history of hip surgery on the affected hip. Among these patients, 4 underwent pelvic CT examination in other hospitals before hospitalization. To avoid excessive radiation exposure, we did not perform a CT examination again. Thus, 4 patients were excluded from this study because of a lack of necessary data.
Of the remaining 56 patients, we excluded patients for whom we could not accurately locate the center of the femoral head because of the subluxation and irregular femoral heads. There were 4 patients with subluxation—1 patient had poliomyelitis, and 3 patients had cerebral palsy. The femoral head center could not be accurately located in 3 patients with aspherical femoral heads—1 patient had multiple epiphyseal dysplasia, and 2 patients had severe coxa plana.
We included 49 patients with a mean age of 29.7 ± 8.6 years (range, 14-46 years) at the time of surgery in the study. Of them, 44 were women and 5 were men.
Imaging Data and Measurements
All patients had standard FP radiographs taken preoperatively, and the sourcil ACEA was measured on the standard FP radiographs. A simulated FP radiograph was also generated based on CT scans, and the sourcil ACEA, bone-edge ACEA, and true ACEA of every patient were measured on the simulated FP radiographs.
Sourcil ACEA on Standard FP Radiograph
Standard FP radiographs were taken according to the method used by Lequesne and de Sèze. 20 In the standing position, the distance between the source and the receiving plate was 120 cm, and the patient's coronal axis was 65° to the receiving plate when the FP radiograph was taken. The sourcil ACEA was measured according to the method of Lequesne and de Sèze 20 (Figure 1)—the angle between the line from the anterior point of the sourcil (orange dot in Figure 1) to the center of the femoral head (white dot), and the vertical line passing through the center of the femoral head (white line). The sourcil ACEA was measured twice on the standard FP radiographs by 2 surgeons (N.R. and Z.Z.) with experience in periacetabular osteotomy. The interval between the 2 measurements was not <2 weeks.
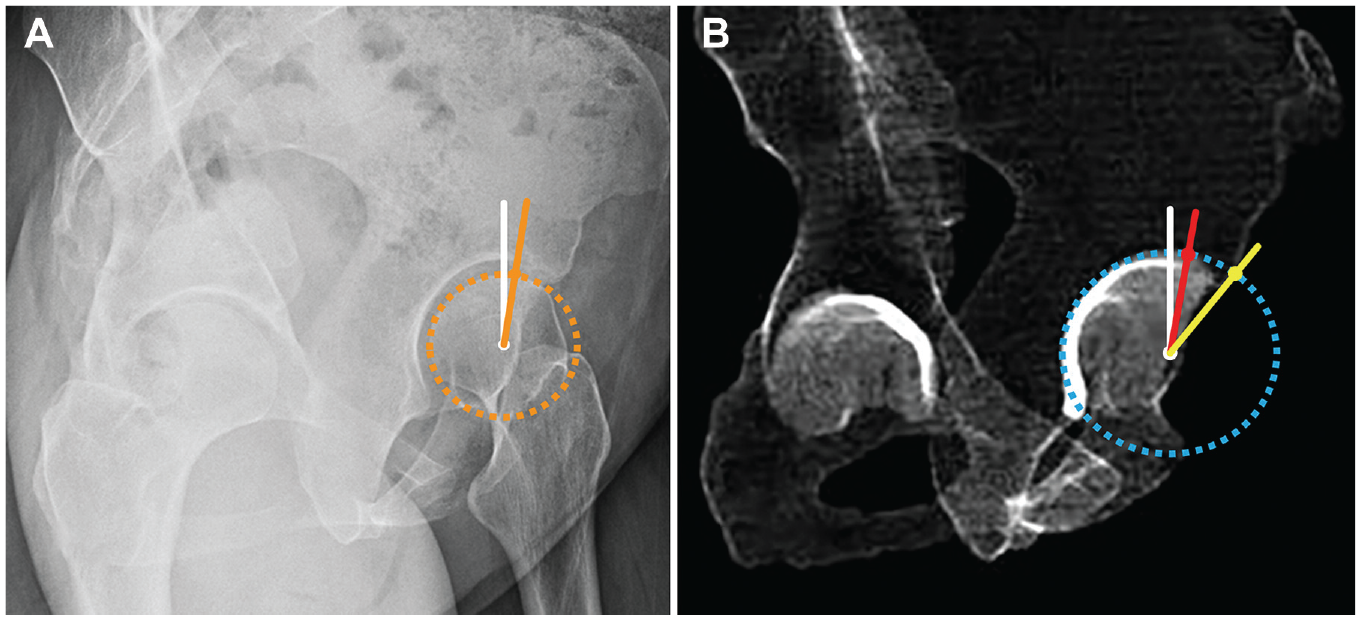
Existing methods for measuring the ACEA. (A) Method for measuring the sourcil ACEA on a standard FP radiograph. The angle between the line (orange line) from the anterior edge of the acetabular sourcil (orange line) to the center of the femoral head (white dot), and the vertical line (white line) passing through the center of the femoral head. (B) Method for measuring the ACEA on a simulated FP radiograph. The angle between the line (red line) from the anterior edge of the dense shadow of the acetabular dome (red dot) to the center of the femoral head (white dot) and the vertical line (white line) passing through the center of the acetabulum is the sourcil ACEA. The angle between the line (yellow line) from the anterior bone edge (yellow dot) to the center of the femoral head (white dot) and the vertical line (white line) passing the center of the acetabulum is the bone-edge ACEA. ACEA, anterior center-edge angle; FP, false-profile.
Creating the Simulated FP Radiograph
The CT scan of the pelvis showed the iliac crest and the lower edge of the lesser trochanter of the femur. The distance between slices was 1.3 mm. We used 3D Slicer (open-source application; https://www.slicer.org) to segment the preoperative CT scans of these patients, and the scans were used to generate volume models. 14 The edge of the acetabulum is manually outlined along the edge of the contacting surface (with the femoral head) of the acetabulum on the simulated models by a surgeon skilled in periacetabular osteotomy.
The generated model of the pelvis was rotated 65° to the affected side in 3D Slicer. Then, the volume model of the acetabulum of the pelvis was projected to the coronal plane. 9 The position of the pelvis was fine-tuned according to the morphology of the iliac wing and obturator foramen on the standard FP radiograph. The profile of the pelvis on the final simulated FP radiograph was consistent with the appearance of the pelvis on the standard FP radiograph in terms of height difference between the acetabulum rotation centers, distance between the 2 femoral heads, and morphology of the iliac wing and obturator foramina.
Sourcil, Bone-Edge, and True ACEA on Simulated FP Radiograph
We defined 3 different anterior acetabular edges and obtained 3 different ACEA measurements on the simulated FP radiographs. The first anterior acetabular edge (Figure 1B) was defined as the anterior edge of the dense shadow (sourcil) of the acetabular dome (red dot in Figure 1B), and the sourcil ACEA was defined as the angle between the line (red line) from it (red dot) to the center of the femoral head (white dot) and the vertical line (white line) passing through the center of the acetabulum. The second anterior acetabular edge (Figure 1B) was defined as the anterior bone edge (yellow dot in Figure 1B), and the bone-edge ACEA was defined as the angle between the line (yellow line) from the anterior bone edge (yellow dot) to the center of the femoral head (white dot) and the vertical line (white line) passing the center of the acetabulum. The third anterior acetabular edge (Figure 2) was defined as the point (blue dot in Figure 2) where the acetabular rim leaves the best-fit circle of the highlighted area of the acetabulum (blue dotted circle). We defined the true ACEA as the angle between that point to the center of the femoral head (blue line) and the vertical line passing through the center of the acetabulum (white line).

Method of measuring the true ACEA: The best-fit circle (blue dotted circle) of the highlighted area of the acetabulum was determined. The angle between the line (blue line) from the point (blue dot), where the acetabular rim leaves the blue circle to the center of the femoral head (white dot), and the vertical line (white line) passing through the center of the acetabulum was defined as the true ACEA. (A) The simulated FP radiograph. (B) The mirror image shown on the 3D model of the pelvis. ACEA, anterior center-edge angle; FP, false-profile; 3D, 3-dimensional.
The sourcil, bone-edge, and true ACEAs were also measured twice on the same simulated FP radiographs by the same 2 surgeons (N.R. and Z.Z.). The observers were blinded to the patient's information, and the images were shuffled. The interval between the 2 measurements was no <2 weeks.
Statistical Analysis
Statistical analysis was done using SPSS Version 26 (IBM). Interobserver and interobserver agreement of the measurements were conducted using the interclass correlation coefficient (ICC) with a 2-way random model. The ICC values were interpreted as follows: <0.20 indicating poor agreement; 0.21 and 0.40 indicating fair agreement; 0.41 and 0.60 indicating moderate agreement; 0.61 and 0.80 indicating good agreement; and 0.81 and 1 indicating very good agreement.
The normal distribution of all the data was tested using the Kolmogorov-Smirnov test. Differences between the ACEA measurements were evaluated using paired t tests. A Pearson or Spearman correlation analysis was used to validate the correlation between the 2 parameters based on the data distribution. The resulting correlation coefficient (r) was interpreted as follows: 0 to 0.20 indicating very weak correlation; 0.21 and 0.40 indicating weak correlation; 0.41 and 0.60 indicating moderate correlation, 0.61 and 0.80 indicating strong correlation; and 0.81 and 1.00 indicating very strong correlation. For all statistical comparisons, the threshold for significance was set at P < .05.
Results
All sourcil ACEA measurements on the standard FP radiographs obtained by both observers were normally distributed. In addition, all sourcil, bone-edge, and true ACEA measurements on the simulated FP radiographs obtained by both observers were normally distributed.
Intraobserver and Interobserver Reliability
The ICC values for intraobserver and interobserver reliability for all ACEA measurements are shown in Table 1. Regarding sourcil ACEA measurements on the standard FP radiographs, observer A's first measurement was 7.5°± 15.6° (range, –24.8° to 37.0°), and his second measurement was 10°± 16.4° (range, –31.3° to 40.9°). Observer B's first measurement was 3.6°± 17.8° (range, –48° to 34°), and his second measurement was 3.9°± 15.3° (range, –27.3° to 35.4°). The intraobserver reliability of both observers as well as the interobserver reliability were all considered good.
Intraobserver and Interobserver Reliability a

ACEA, anterior center-edge angle; ICC, interclass correlation coefficient; FP, false-profile.
ICC values: <0.20 = poor agreement; between 0.21-0.40 = fair agreement; between 0.41-0.60 = moderate agreement; between 0.61-0.80 = good agreement; and between 0.81-1 = very good agreement.
When the sourcil ACEA was measured on the simulated FP radiographs, observer A's first measurement was 7.4°± 15.2° (range, –25.9° to 44.3°), and his second measurement was 6.2°± 15.7° (range, –32.8° to 43.2°). Observer B's first measurement was 5.4°± 13.9° (range, –26.3° to 46.1°), and his second measurement was 5.9°± 14.5° (range, –27.7° to 42.4°). The intraobserver reliability of both observers and the interobserver reliability were all interpreted as very good.
When the true ACEA was measured on the simulated FP radiograph, observer A's first measurement was 14°± 13.6° (range, –17.4° to 45.0°), and his second measurement was 13.5°± 13.7° (range, –18.4° to 39.9°). Observer B's first measurement was 16°± 12.2° (range, –11.9° to 46°), and his second measurement was 15.6°± 12.8° (range, –21.1° to 44.1°). The intraobserver reliability of both observers was considered excellent, and the interobserver reliability was considered good.
When the bone-edge ACEA was measured on the simulated FP radiograph, observer A's measurement was 33.3°± 10.2° (range, 8.1°-53.2°), and his second measurement was 31.9°± 10.1° (range, 9.9°-56.6°). Observer B's first measurement was 30.3°± 10.2° (range, 1.4°-47.9°), and his second measurement was 30.8°± 9.9° (range, 11.1°-49.1°). The intraobserver reliability of both observers and the interobserver reliability were considered excellent.
Comparison of ACEA Measurements
Figure 3 shows the distribution of the different ACEA measurements. The mean sourcil ACEA on the standard FP radiograph was 6.3°± 14.9° (range, –29.5° to 33.5°), while the mean sourcil ACEA on the simulated FP radiograph was 6.2°± 14.4° (range, –27.9° to 44°). A paired t test showed no difference (t = 0.03; P = .976). The mean value of the true ACEA measurements was 14.8°± 12.2° (range, –16.8° to 42.9°), which was 8.6°± 8.4° (range, –3.9° to 31.7°) larger than that of the sourcil ACEA measurements. A paired t test showed a significant difference between them (t = 7.06; P < .001), and there was a strong correlation between them (r = 0.81, P < 0.001). The mean value of the bone-edge ACEA measurements was 31.6°± 9.6° (range, 7.6° to 50.2°), which was 16.8°± 10.4° (range, –1.7° to 45.4°) larger than that of the true ACEA measurements. A paired t test showed a significant difference between them (t = 11.15; P < .001), and there was a moderate correlation between them (r = 0.57; P < .001) (Figure 3).

Distribution of the ACEA measurements on the standard and simulated FP radiographs. The mean Lequesne ACEA was 6.3°± 14.9°, the mean sourcil ACEA was 6.2°± 14.4°, the mean bone-edge ACEA was 14.8°± 12.2°, and the mean true ACEA was 31.6°± 9.6°. All measured values were normally distributed. ACEA, anterior center-edge angle; FP, false-profile.
Discussion
Our results showed that the mean value of the sourcil ACEA measurements was only slightly smaller from the true ACEA measurements, with a difference of 8.6°± 8.4° (range, –3.9° to 31.7°). However, the bone-edge ACEA measurements had a significantly larger mean value of 16.8°± 10.4° (range, –1.7° to 45.4°) than the true ACEA measurements. The sourcil ACEA and true ACEA measurements had a strong correlation (r = 0.81; P < .001), whereas the bone-edge ACEA and true ACEA measurements had only a moderate correlation (r = 0.57; P < .001).
Because humans walk upright, the main function of the human hip joint is to support the body's weight. This support is accomplished by the contact between the surface of the acetabulum and the femoral head. 31 Identifying the edge of the hip joint contact is important for evaluating hip stability and guiding osteotomy surgeries to reconstruct hip stability. For a hip joint without a previous surgical history, the contacting surface of the acetabulum includes only the articular surface and not surrounding bony structures, such as the anterior inferior iliac spine (AIIS). 11 It is difficult to determine with the naked eye where the anterior edge of the contact area is on a standard FP radiograph, whether it is the anterior edge of the sourcil or the anterior bone edge.
Because the femoral head is approximately spherical, the articular surface of the acetabulum in contact with the femoral head is also a part of a sphere (Figure 2B), and its projection onto a plane is a part of a circle. (Figure 2A) Therefore, we defined the part of the acetabulum attached to the external tangential circle of the acetabulum as the actual acetabulum. The edge of the acetabulum was defined as the point at which the acetabular edge line diverged from the external tangent circle of the acetabular surface. Based on this approach, we were able to evaluate further whether our standard anterior coverage measurements on standard FP radiographs were representative of the anterior coverage of the hip joint surface.
Before testing the accuracy of other measurements, we measured the sourcil ACEA on both standard and simulated FP radiographs to confirm whether our simulated images were accurate representations of the standard FP radiographs, which were obtained with the patient in the standing posture. There was no difference in sourcil ACEA values between those measured on the standard versus the simulated images. The intra- and interobserver reliability of the sourcil ACEA measurements on standard FP radiographs were good, which is similar to the reliability reported in previous literature.3,5,6 However, when we measured the sourcil ACEA on the simulated FP radiographs, both the intra- and interobserver reliability increased from good to very good. This indicates that our simulated images were able to represent anatomical features with improved clarity compared with standard FP radiographs, potentially resulting in enhanced reproducibility and measurement accuracy.
When the sourcil ACEA was compared with the true ACEA, we found that the anterior point of the actual joint surface and the anterior edge of the sourcil were not located exactly in the same position but were always slightly anterior (Figure 4); however, they were always quite close. We found that the true ACEA was always larger than the sourcil ACEA, with a mean difference of 8.6°± 8.4°. A very strong correlation (r = 0.81) existed between the true ACEA and the sourcil ACEA.

In the simulated FP radiograph, the difference between the bone-edge ACEA and the true ACEA is influenced by the size of the AIIS. (A) When the AIIS protrudes forward, the difference is larger. (B) When the AIIS is flat, the difference is smaller. ACEA, anterior center-edge angle; AIIS, anterior inferior iliac spine; FP, false-profile.
When the bone-edge ACEA was compared with the true ACEA, the distance between the anterior point of the actual joint surface and the anterior edge of the bone edge was larger than that between the sourcil ACEA and the true ACEA. This led us to conclude that the size of the AIIS had an impact on the difference between the bone-edge ACEA and the true ACEA. A previous study has demonstrated that the size of the inferior iliac spine can be accurately measured on an FP radiograph. 18 When the AIIS protruded forward, the difference between them was larger (Figure 4A). In contrast, the difference between them was smaller when the AIIS was flat (Figure 4B). A previous study has indicated that patients with acetabular dysplasia often have a prominent AIIS. 25 In our clinical practice, our patients have consistently shown, as supported by this study, that for most hips, the bone-edge ACEA is significantly larger than the true ACEA because of the effect of the AIIS. In this study, the bone-edge ACEA was 16.8°± 10.4° larger than the true ACEA, with only a moderate correlation between the 2 (r = 0.57).
In addition to confirming the difference between sourcil ACEA and bone-edge ACEA, which matches the results of previous studies,4,24 in this experiment, we found that neither the sourcil ACEA nor the bone-edge ACEA represent the actual anterior hip coverage precisely. When the ACEA is discussed, it should be specified which landmark is used. Using the anterior edge of the sourcil may lead to underestimating the anterior coverage of the hip, while using the anterior bone edge may lead to overestimation. Considering both, using the anterior edge of the sourcil is recommended to reduce error.
Limitations
The limitations of this study are as follows: (1) The center-edge angle of the acetabulum should be measured from the center of the femoral head. Because we did not include patients with subluxation in the design phase of the experiment, we assumed that there was no measurable distance between the rotational centers of the femoral head and acetabulum, which was confirmed by our pilot study. Therefore, the femoral heads were not segmented in the CT data to save time and labor costs. During measurements, we used the center of the acetabulum instead of the center of the femoral head. In this study, we found no landmarks that can represent the actual anterior acetabular coverage on the standard FP radiographs better than the sourcil ACEA or the bone-edge ACEA. We are currently performing further research on this topic.
Conclusion
In this study, the sourcil ACEA was strongly correlated with the true ACEA, and it can be used as a better surrogate of true ACEA before and after periacetabular osteotomy. The bone-edge ACEA is less recommended for assessing anterior contact of the hip joint because it is affected by the morphology of the AIIS, which does not contact the femoral head.
Footnotes
Final revision submitted May 20, 2023; accepted July 31, 2023.
The authors have declared that there are no conflicts of interest in the authorship and publication of this contribution. AOSSM checks author disclosures against the Open Payments Database (OPD). AOSSM has not conducted an independent investigation on the OPD and disclaims any liability or responsibility relating thereto.
Ethical approval for this study was obtained from the Chinese PLA General Hospital, Beijing (ref No. 2021KY043-KS001).