
Abstract
Background:
The anterior center-edge angle (ACEA) is used to quantify anterior coverage of the femoral head by the acetabulum. However, its measurement has not been evaluated in a manner consistent with routine use, and the precise 3-dimensional (3D) anatomic location where it measures coverage is not known.
Purpose:
To determine the effect of patient positioning on ACEA measurement reliability, magnitude, and 3D location.
Study Design:
Descriptive laboratory study.
Methods:
Included were 18 adults; 7 participants had cam morphology and femoroacetabular impingement syndrome, and 11 participants had no radiographic evidence of hip abnormalities and no history of hip pain or injuries. Ultimately, 3D femur and pelvis models were generated from computed tomography images. Radiographs were generated with the models in different degrees of pelvic rotation, tilt, and obliquity relative to the standard false-profile view. The ACEA was measured by 2 raters by selecting the location of the bone edge on each radiograph. Selections were projected onto the pelvis model and expressed as a clockface location on the acetabular rim. The clockface was mirrored on left hips to allow a direct comparison of locations between hips. Interrater and intrarater reliability were quantified via the intraclass correlation coefficient (ICC). The effect of position on ACEA measurements and clockface locations was determined via linear regression.
Results:
Intrarater and interrater reliability were excellent (ICC ≥0.97 for all). For every degree increase in rotation, tilt, and obliquity, the ACEA changed by +0.53°, +0.93°, and –0.04°, respectively. The mean clockface location (hour:minute:second) in the false-profile view was 2:09:32 ± 0:12:00 and changed by +0:02:08, –0:00:35, and –0:00:05 for every degree increase in rotation, tilt, and obliquity, respectively.
Conclusion:
ACEA measurements were reliable even with differences in patient positioning. Rotation and tilt were associated with notable changes in ACEA measurements. ACEA bone edge measurements mapped to the anterosuperior acetabular rim, typically in proximity to the anterior inferior iliac spine. Mapped location was most sensitive to rotation.
Clinical Relevance:
Pelvic rotation and tilt affected ACEA measurements, which could alter the clinical classification and treatment of borderline abnormalities. Rotation in particular must be well controlled during patient imaging to preserve measurement reliability and accuracy and to describe coverage from the intended 3D rim location.
The anterior center-edge angle (ACEA) characterizes coverage of the femoral head by the acetabulum, 11 which is an important consideration in the diagnosis and treatment for patients with acetabular dysplasia, pincer morphology, and other abnormalities of the hip. Historically, an ACEA less than 20° has been deemed abnormal, whereas 20° to 25° is considered borderline. 11 An accurate interpretation of the ACEA is dependent on a comprehensive understanding of the effects of radiographic techniques and measurement errors. Additionally, understanding how the 2-dimensional (2D) ACEA relates to 3-dimensional (3D) anatomic features is critical for correctly identifying hip abnormalities and choosing between arthroscopic, reorienting, and nonoperative treatment.
Previous studies have shown the ACEA to be a reliable measurement. 7,12,15,17,21,22,26 However, reliability measurements included only images acquired in the false-profile view (eg, cadaveric and computational studies 12,21,22,26 and a patient study that used a positioning device 15 ). Thus, the reported reliability measurements do not account for the imprecise nature of patient positioning during routine imaging. 13
Less is known regarding the effect that patient positional error has on the ACEA, which occurs as a result of improper pelvic rotation relative to the image cassette and/or pelvic tilt and obliquity caused by an unnatural posture adopted during imaging. On the basis that a 20° rotational error resulted in a change of <4° in the ACEA relative to the false-profile view, Putnam et al 21 concluded that rotational errors were unlikely to alter clinical interpretation. However, for the same magnitude of rotation, Li et al 12 found nearly double the change in the ACEA, which would be a concern when evaluating patients who present with borderline abnormalities. In comparison, Zingg et al 26 found tilt to have a much greater effect than rotation, corroborated by Putnam et al, 21 in which a 20° tilt error yielded a 13° change in the ACEA relative to the false-profile view. Importantly, these previous investigations were conducted in vitro and did not consider the effect of pelvic obliquity on ACEA measurements. Accordingly, the performance of this measurement under realistic conditions is not well established.
The ACEA measurement provides valuable information regarding the extent of femoral head coverage by the acetabulum. However, the 3D location that the ACEA approximates, and thus the region of coverage to which the ACEA corresponds, has not been well described. Previous efforts have utilized computed tomography (CT) and magnetic resonance imaging (MRI) to measure the ACEA on sagittal-plane 5,16,22,24,26 and custom reformatted 18,24 images. Although this may circumvent challenges with patient positioning associated with radiography, the functional relative relationship of the femur and hip from the standing position is not preserved. Indeed, ACEA measurements on planar CT/MRI have been shown to exhibit weak correlations with their radiography-based counterpart. 16,24,26 More importantly, such an approach does not leverage the 3D information inherent to volumetric images.
In this study, CT and dual fluoroscopy were used to generate participant-specific false-profile radiographs based on the known relative position of the femur and pelvis obtained in a standing position. The volumetric CT dataset can then be used to create radiographs at precise computer-controlled values of pelvic rotation, tilt, and obliquity. The first goal of this study was to quantify the reliability of ACEA measurements and determine the sensitivity of such measurements to patient positioning. The second goal was to identify the precise 3D location on the pelvis measured via the ACEA and determine the effect of patient positioning on this location.
Methods
Participants
The participant cohort was selected from previously published imaging studies from which CT and dual fluoroscopy images of the hip were available. 1,6 Briefly, after receiving approval from the University of Utah institutional review board, we enrolled 18 participants between March 2013 and January 2016; all participants provided informed consent in this single-center study. The mean participant age and body mass index were 26 ± 5 years and 22.0 ± 2.8, respectively. Participants had no history of lower limb surgery and no radiographic evidence of osteoarthritis. A total of 7 participants (5 male and 2 female) had a diagnosis of femoroacetabular impingement (FAI) syndrome. 1 The diagnosis was based on the presence of symptoms, a positive anterior impingement examination finding, and the presence of cam morphology on radiographs. 1 There were 11 participants (6 male and 5 female) who had no radiographic evidence of hip abnormalities and no history of hip pain or injuries. 6
Imaging
CT of the hip was performed via a 128-slice SOMATOM Definition scanner (Siemens) using an established protocol. 10 The pelvis and femur were imaged at 120 kVp and 200 to 400 mAs, and images were reconstructed with a 1.0-mm slice thickness. Images were resampled to 3 times the original voxel resolution (resampled range, 0.20-0.25 × 0.20-0.25 × 0.33 mm), and each bone was segmented using Amira software (Version 6.0; Thermo Fisher Scientific). 23 Next, a custom dual fluoroscopy system (Radiological Imaging Services) validated for hip imaging 1,6,10 was used to obtain images of participants’ hips in a neutral standing position with feet hip-width apart. Images were collected at 100 frames per second, with energy settings ranging from 78 to 100 kVp and from 1.9 to 3.2 mAs for tube voltage and current time product, respectively.
Data Processing
Surface meshes of the pelvis and proximal femur were generated from the CT segmentations and then decimated and smoothed. Model-based tracking registered the CT bone models to the fluoroscopic image pairs to determine the 3D position of the femur and pelvis using previously described software. 2
Following a validated approach, 8,9 digitally reconstructed radiographs (DRRs) of the hip were generated via projection of the CT image volumes to simulate plain film radiographs at various positions. CT image volumes were preprocessed such that voxels outside of the segmented bone regions were assigned an intensity value of 0, with separate volumes created for the femur and pelvis anatomies. Next, the femur and pelvis anatomies were rigidly transformed to the neutral standing position determined using model-based tracking. The anatomies were then rotated 65° about the superior-inferior axis through the pelvic center to be in the standard false-profile view (Figure 1), first described by Lequesne and de Sèze. 11 Additional positions were created by jointly rotating the femur and pelvis anatomies relative to the standard false-profile view (45° to 85° in 5° increments) and in the standard false-profile view with varying degrees of pelvic tilt and obliquity (–10° to 10° in 2° increments) (Figure 1). Finally, the 3D anatomies were projected to a 2D plane, analogous to an image cassette, for each joint configuration.
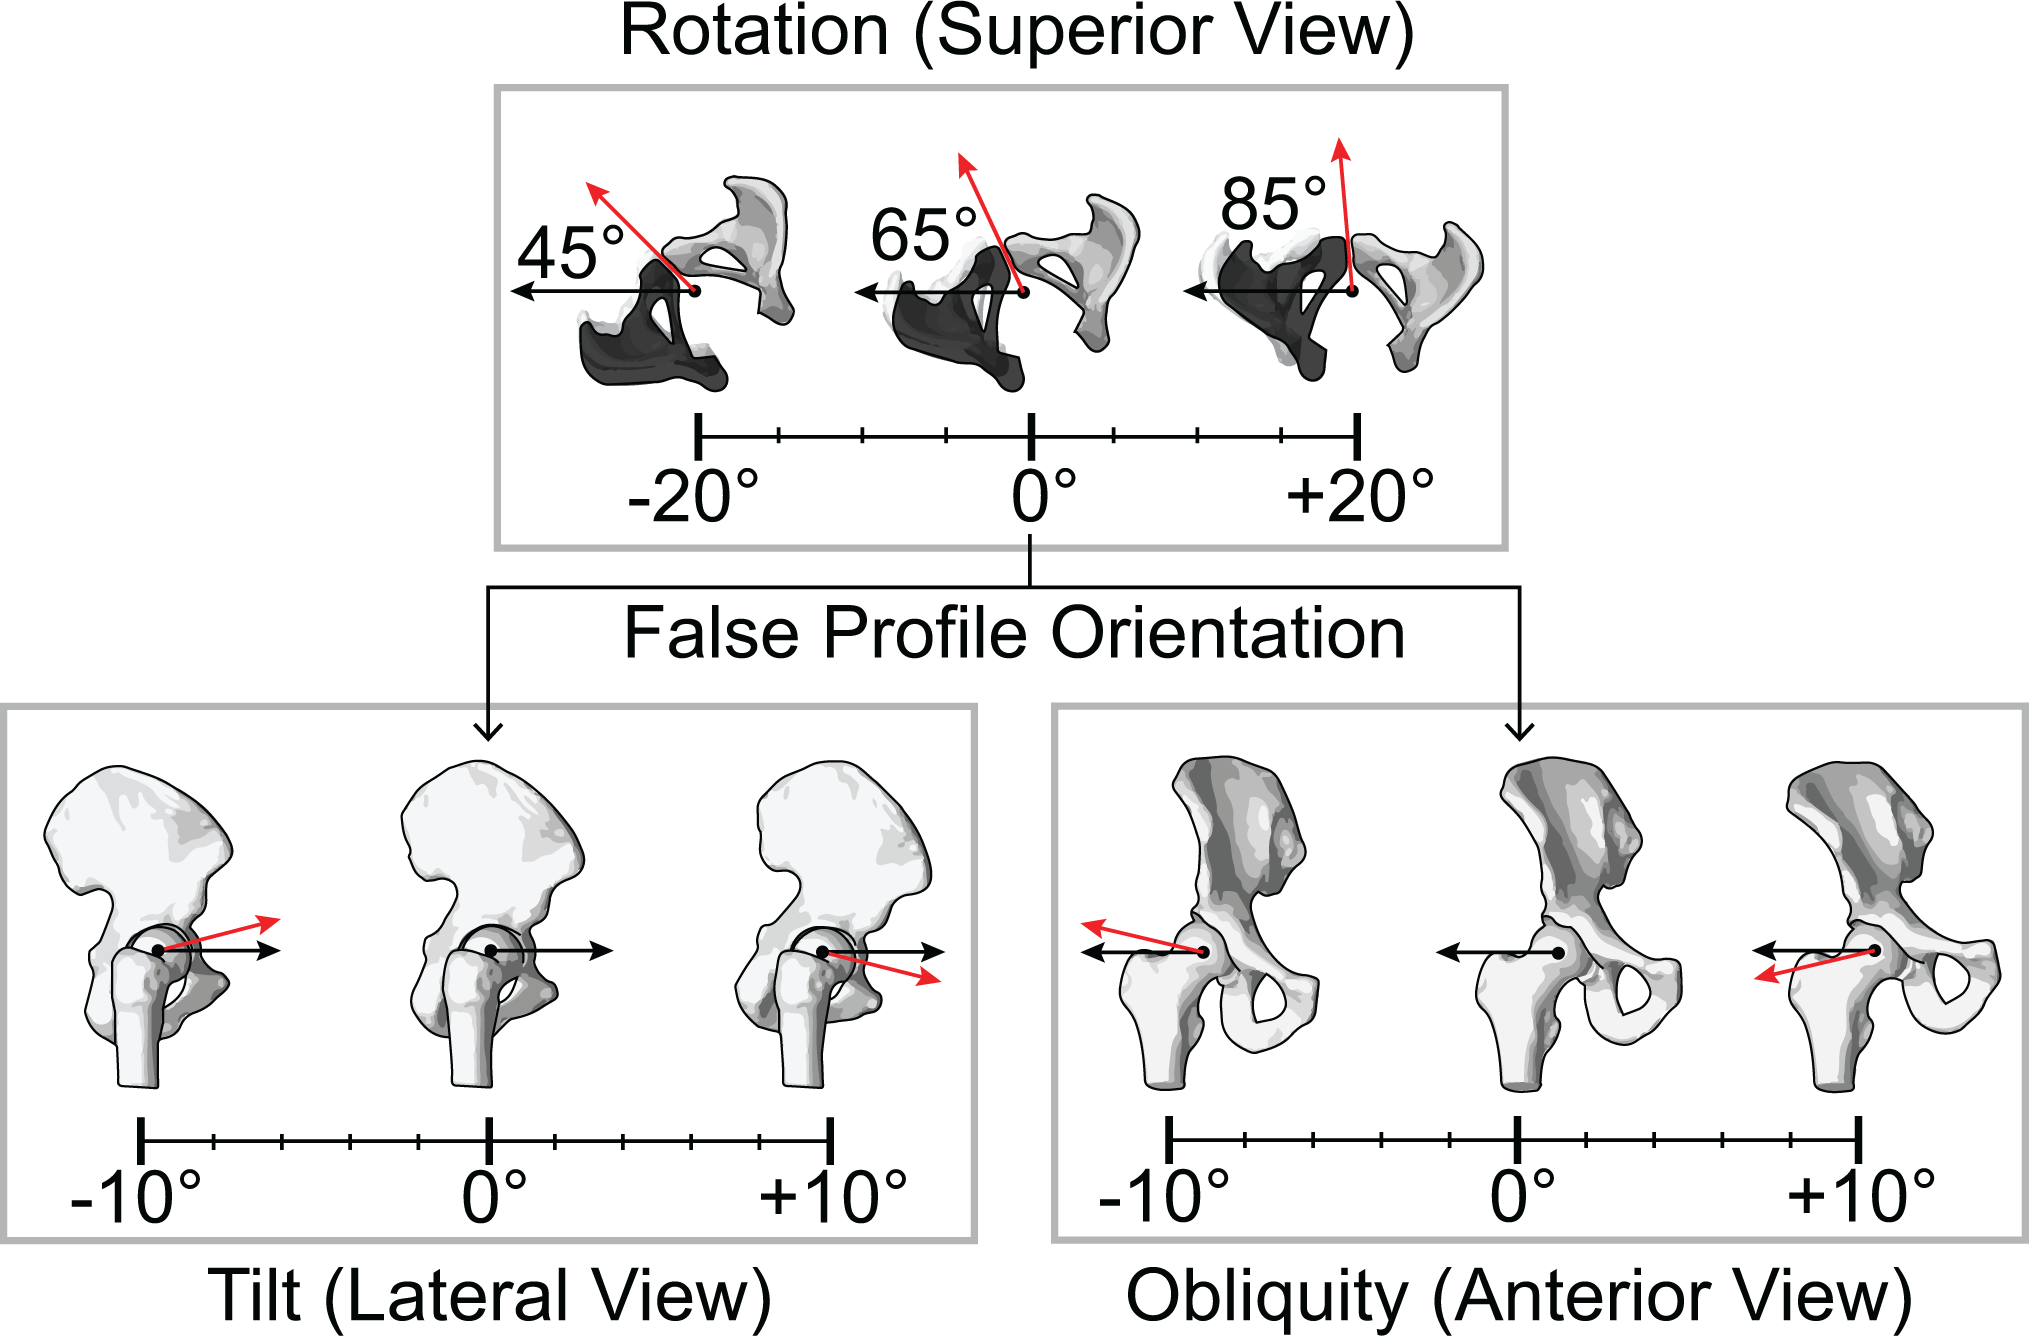
Hip position definitions. Top row: Pelvic rotation was defined as rotation of the femur and pelvis about the superior-inferior axis through the pelvic center, with the standard false-profile view set at 65° of rotation from a standard anteroposterior view. The pelvic center was set as the midpoint of the imaged (white) and contralateral (black) hip joint centers. Bottom row: Pelvic tilt was defined as rotation of the pelvis about the medial-lateral axis, and pelvic obliquity was defined as rotation of the pelvis about the anteroposterior axis passing through the joint center of the imaged hip.
ACEA Measurement
A custom MATLAB program (Version R2017b; MathWorks) was used to display the DRRs in random order and record ACEA measurements. Overall, 2 investigators (a fellowship-trained orthopaedic surgeon [S.K.A.] and a fourth-year medical student [A.J.M.]) independently performed all measurements, blinded to participant and hip positioning. The ACEA was defined as the angle between 2 vectors passing through the femoral head center: (1) a vertical vector and (2) a vector that intersected the anterior aspect of the acetabular bone edge, as described by Crockarell et al 4 and Lequesne and de Sèze. 11 Bone edge points were identified and selected by the raters (Figure 2A). The location of the femoral head center was predetermined, calculated as the center of the best-fit sphere to the 3D femoral head mesh projected onto the 2D image plane (Figure 2A). Raters repeated measurements 1 week later on a subset of images, which included 4 images per hip position from FAI syndrome and healthy hips as well as left and right hips.

Anterior center-edge angle (ACEA) measurement and 3-dimensional location mapping. (A) Representative digitally reconstructed radiograph (DRR) of the hip. Raters selected the bone edge (red circle) landmark on the pelvis. The femoral head center was defined as the center of the best-fit sphere to the femoral head mesh projected onto the 2-dimensional image plane. The vertical line (black arrow) passing through the femoral head center (black circle) was defined using the dual fluoroscopy system. The ACEA was calculated as the angle between the vertical line and a line extending from the femoral head center through the selected bone edge point (red circle). (B) Bone edge selections (red circle) were projected from the DRR to a corresponding point on the bone models (red diamond) along a line following the radiographic projection.
3D Location Mapping of the ACEA
Each rater-selected location was extended from the 2D point on the DRR to a 3D line, following the radiographic projection in the direction from the simulated image cassette to the x-ray source (Figure 2B). The minimum distance between the line and the nodes on the 3D pelvis surface mesh (aligned to the orientation of the DRR) was calculated. The 3D location of the ACEA measurement was defined as the nearest cassette-facing node on the pelvis within a tolerance threshold. The threshold was defined as the minimum line-to-node distance across all pelvic nodes, summed with the median mesh edge length (range, 1.4-1.8 mm). If no nodes of the acetabular rim were found within this threshold, the nearest node of the pelvis was selected.
To match the clinical description, ACEA 3D locations were projected onto a clockface defined by the acetabular rim, and Cartesian coordinates were expressed as a time (hour:minute:second). The clockface was defined by computing the second principal curvature of the pelvis mesh using PostView software (Version 2.1; University of Utah) 14 to isolate the acetabular lunate surface and rim. 25 The joint center was defined as the center of the best-fit sphere to the lunate surface. The 6 o’clock position was defined as the midpoint of the transverse acetabular ligament attachment sites 3,19 and projected to a plane fit to the nodes of the acetabular rim (Figure 3). The remaining clockface positions were then defined relative to 6 o’clock. The clockface was mirrored on left hips to allow a direct comparison of clockface locations between left and right hips.

Definition of the acetabular clockface for expressing the mapped location of the anterior center-edge angle (ACEA) bone edge selection. Acetabular landmarks: The lunate surface (red) and acetabular rim (blue) were isolated on each participant’s mesh using PostView’s second principal curvature tool. A sphere fit to the lunate surface was used to define the joint and clockface centers (red circle). Clockface: 6 o’clock was defined as the midpoint between the anteroinferior and posteroinferior rim edges (blue “x”). The remainder of the clockface was defined relative to the 6 o’clock position. The clockface was mirrored on left hips to allow a direct comparison of clockface locations between left and right hips.
Statistical Analysis
Reliability was quantified using 2-way mixed-effects, absolute-agreement, single-measurement intraclass correlation coefficients (ICCs). All measurements from the first session were used to calculate interobserver reliability. All measurements from the second session with corresponding measurements from the first session were used to calculate intraobserver reliability. The relationship between measurements (ACEA angles, ACEA clockface locations) and pelvic rotation, tilt, and obliquity was determined using linear regression. ACEA measurements were averaged between raters for a given participant and hip position. For regression analysis, measurements were also averaged across participants.
Results
The intrarater reliability of the ACEA measurements was considered excellent 20 (ICC, 0.98 [rater 1] and 0.98 [rater 2]), and the interrater reliability was also excellent (ICC, 0.97). The mean difference in ACEA measurements between the raters was 1.3° (Table 1).
Interrater and Intrarater Reliability for Anterior Center-Edge Angle Measurements

The mean ACEA in the false-profile view was 51.1° ± 5.2°. For each degree increase in rotation (ie, toward a true lateral view), the ACEA increased by 0.53° (Figure 4A). For each degree increase in tilt (ie, anterior tilt), the ACEA increased by 0.93° (Figure 4B). For each degree increase in obliquity (ie, away from midline), the ACEA decreased by 0.04° (Figure 4C).

Anterior center-edge angle (ACEA) measurement as a function of hip position (A) Rotation, (B) Tilt, (C) Obliquity. ACEA measurements were averaged between raters for a given participant and hip position. Each point represents the average across participants, and error bars indicate the 95% CI. Data were fit using linear regression. AB, abduction; AD, adduction; ANT, anterior; AP, anteroposterior view; LAT, lateral view; POST, posterior.
The mean clockface location for the ACEA in the false-profile view was 2:09:32 ± 12 minutes. For each degree increase in pelvic rotation, tilt, and obliquity, the clockface location changed by 2 minutes and 7.8 seconds, 34.6 seconds, and 5.0 seconds, respectively (Figure 5). The maximum, median, and minimum clockface locations across positions and participants were 3:20:23, 2:06:03, and 1:26:48 for rotation, respectively; 2:54:37, 2:03:53, and 1:34:56 for tilt, respectively; and 2:54:37, 2:05:46, and 1:35:22 for obliquity, respectively (Figure 5).

Top: Anterior center-edge angle (ACEA) clockface location as a function of hip position. ACEA measurements were averaged between raters for a given participant and hip position. Each point represents the average clockface location across participants, and error bars indicate the 95% CI. Data were fit using linear regression. Bottom: Range of clockface locations based on regression equations calculated over a consistent range of pelvic (A.1, A.2) rotation, (B.1, B.2) tilt, and (C.1, C.2) obliquity (±10°). AB, abduction; AD, adduction; ANT, anterior; AP, anteroposterior view; LAT, lateral view; POST, posterior.
For a representative participant with FAI syndrome and healthy participant, the absolute difference in the median clockface location among raters ranged from 0:01:25 to 0:10:01 for rotation, 0:00:58 to 0:02:56 for tilt, and 0:00:52 to 0:05:18 for obliquity (Figure 6). The range in clockface locations (defined as the maximum clockface location minus the minimum clockface location over the examined range of positions) was greatest in rotation (Figure 6, A.1 and A.2) 5.4% of bone edge selections mapped in proximity to the iliopubic eminence.

Anterior center-edge angle (ACEA) clockface locations over the range of pelvic (A.1, A.2) rotation (±20°), (B.1, B.2) tilt (±10°), and (C.1, C.2) obliquity (±10°) for a representative participant with femoroacetabular impingement (FAI) syndrome and a healthy participant.
Discussion
ACEA measurements exhibited excellent intrarater (ICCs, 0.98) and interrater reliability (ICC, 0.97), and the mean absolute difference between raters was 1.3° (Table 1). Murphy et al 17 and Hanson et al 7 also found ACEA measurements to be highly consistent across raters, reporting similar ICCs and median differences of 1° for bone edge measurements. Interestingly, even when incorporating images with positional errors, we found ICCs that were comparable to those in studies that only examined reliability in the standard false-profile view. 12,15 However, differences between raters were smallest when the pelvis was rotated toward an anteroposterior (AP) view (mean absolute difference, 0.70° from –20° to –15° of rotation) and increased the more the pelvis was rotated toward a lateral view (mean absolute difference, 4.00° from 15° to 20° of rotation) likely because of increased overlap in the projected anatomy, obscuring the bone edge.
Accurate patient positioning is difficult to achieve using the false-profile radiographic view in which the pelvis is rotated 65° from the AP view. As a result, physicians must frequently interpret false-profile radiographs with variable amounts of pelvic rotation. Additionally, postural perturbations due to constrained space and positioning during image acquisition can alter pelvic tilt and obliquity. In this study, changes in pelvic rotation and tilt were both associated with changes in the ACEA, whereas changes in pelvic obliquity had a minimal effect.
For each degree of anterior tilt, Putnam et al 21 and Zingg et al 26 found a 0.63° to 0.65° increase in the ACEA (measurements were made to the sourcil edge). The effect on bone edge measurements was more pronounced, with a 0.93° increase in the ACEA for every degree of anterior tilt in the present study (Figure 4B). Putnam et al 21 found that pelvic rotation had a smaller effect on the ACEA for every degree than did pelvic tilt. This trend was also observed herein. Putnam et al 21 and Li et al 12 reported changes in the sourcil ACEA of 0.18° and 0.4° for every degree of rotation, respectively, compared to 0.53° for every degree of rotation for the bone edge ACEA in the present study (Figure 4A). Clinicians should take into account the increased sensitivity to pelvic tilt when using the ACEA to measure anterior acetabular coverage, especially when the bone edge is used as the anterior reference point. Putnam et al 21 concluded that “aberrant pelvic rotation will likely not result in a clinically meaningful difference in ACEA measurements,” whereas Li et al 12 asserted that rotation significantly affects ACEA measurements.
Although rotation had less of an effect on the ACEA than did tilt overall (Figure 4, A and B), the findings of Li et al 12 and the present study perhaps call into question the conclusion of Putnam et al, 21 particularly in cases of borderline abnormalities. On examination of the end ranges of rotation, rotation toward a true lateral view resulted in greater errors in ACEA measurements than did rotation toward an AP view (Figure 4A), also observed by Li et al. 12 Specifically, 20° of rotation toward a true lateral view resulted in a mean difference in the ACEA of 15.6° relative to the standard false-profile view compared to only 6.4° when rotated toward an AP view. Based on these findings, ACEA measurements taken using radiographs with suspected malrotation, particularly toward a lateral view, should be interpreted cautiously.
The ACEA in the false-profile view is generally accepted as a 2D surrogate measure of anterior acetabular coverage; however, the precise 3D location to which it maps on the acetabular rim has not been described. The results of the present study demonstrate that in the standard false-profile view, ACEA measurements mapped to the anterosuperior acetabular rim in proximity to the anterior inferior iliac spine (Figure 5), with mapped locations that were highly consistent between raters (Figure 6). Pelvic rotation had the largest effect on the ACEA rim location for every degree, with a 20° error resulting in a mean shift in the clockface location of approximately 42.5 minutes (Figure 5A.1). Rotation toward an AP view resulted in smaller ACEA values, which were located more superiorly on the acetabular rim, underestimating femoral head coverage relative to the standard false-profile view. In comparison, rotation toward a true lateral view resulted in larger ACEA values, which were located more anteriorly on the acetabular rim, overestimating femoral head coverage relative to the standard false-profile view. Although the majority of ACEA measurements mapped to the acetabular rim, 5.4% of bone edge selections mapped in proximity to the iliopubic eminence. Mapped locations that were off-rim typically occurred in the presence of excess rotation of the pelvis toward a true lateral view. This likely contributed to the greater discrepancy in clockface locations relative to the standard false-profile view when at the end range of rotation toward a true lateral view compared to rotation toward an AP view. Thus, radiographs with a moderate amount of pelvic rotation toward a true lateral view may fail to provide meaningful estimates of coverage.
Although ACEA measurements were most sensitive to changes in pelvic tilt, the results of this study indicated that alterations in tilt did not significantly affect the 3D anatomic correlate of the ACEA (Figure 5B.2). Indeed, the range of clockface locations measured across participants was narrower for tilt (Figure 5B.2 and Figure 6, B.1 and B.2) than rotation (Figure 5A.2 and Figure 6, C.1 and C.2) and nearly identical to the maximum, median, and minimum locations measured for obliquity. In comparison, rotation had a sizable effect on both the ACEA and clockface location. Thus, it is imperative that pelvic rotation is well standardized before imaging, with less severe consequences erring on the side of rotation toward an AP view.
Limitations
The main limitation of this study was the use of a relatively small sample size that included participants with normal acetabular coverage with variable femoral anatomy. The cohort, which included FAI syndrome and healthy hips, was selected as a convenience sample from previously published imaging studies. 1,6 In contrast to other studies that examined ACEA reliability, 12,21,26 which were conducted in vitro, the neutral position of the hip in our study was assigned based on a participant’s true standing position obtained from dual fluoroscopy images. Thus, despite having fewer participants, our study had the advantage that the methods enabled pelvic rotation, tilt, and obliquity to be defined relative to a functionally relevant participant-specific starting position. In the future, the mapping approach described herein could be applied to clarify the 3D clockface position for a wider spectrum of underlying hip abnormalities, including those with abnormal coverage. Another limitation of this study was that DRRs, not clinically acquired radiographs, were used to collect ACEA measurements. Although images lacked soft tissue, this approach enabled us to precisely control femur and pelvis positioning, which is a challenge in a clinical setting and would require obtaining several images.
Conclusion
This study demonstrated that ACEA bone edge measurements exhibited excellent reliability. Although intrarater reliability was mostly insensitive to errors in pelvic positioning, the discrepancy between raters increased as the pelvis was rotated toward a true lateral view. The ACEA measurement was most sensitive to changes in pelvic tilt. However, changes in pelvic rotation also resulted in errors that could be problematic when evaluating borderline abnormalities, with rotation toward a lateral view having a particularly detrimental effect. Furthermore, changes in pelvic rotation had the largest effect on the 3D anatomic correlate of the 2D ACEA measurement, which was normally found to lie on the acetabular rim near the anterior inferior iliac spine. In conjunction with 3D imaging, knowledge of the limitations of the ACEA measurement and the quantitative ceiling on its performance, in addition to the mapped 3D acetabular rim location, will help improve preoperative and intraoperative understanding of these measurements moving forward.
Footnotes
Acknowledgment
The authors acknowledge Emma Christensen and Penny Atkins for assistance with the development of code to support measurement acquisition and processing.
Final revision submitted October 11, 2021; accepted November 11, 2021.
One or more of the authors has declared the following potential conflict of interest or source of funding: Support was received from the National Institutes of Health (NIH) under grant R21 AR063844. The research content herein is solely the responsibility of the authors and does not necessarily represent the official views of the NIH. S.K.A. has received consulting fees from Stryker. AOSSM checks author disclosures against the Open Payments Database (OPD). AOSSM has not conducted an independent investigation on the OPD and disclaims any liability or responsibility relating thereto.
Ethical approval for this study was obtained from the University of Utah (No. 00051053).