
Abstract
Background:
Competitive adolescent athletes should be aware of the early signs of chronic ankle instability (CAI) and the connection between the condition and performance.
Purpose:
To investigate whether CAI is related to foot alignment and morphology as well as dynamic postural stability after a jump landing among adolescent competitive athletes with and without a history of a lateral ankle sprain and CAI.
Study Design:
Cross-sectional study; Level of evidence, 3.
Methods:
Between July 2020 and August 2021, adolescent competitive athletes (N = 85; n = 49 boys; n = 36 girls) were classified into 3 groups using Cumberland Ankle Instability Tool (CAIT) scores: healthy athletes (n = 55), coper athletes (n = 19), and athletes with CAI (n = 11). Results of foot alignment assessments involving the leg-heel angle (LHA) and navicular height, intrinsic foot muscle morphology, dynamic postural stability index (DPSI), and other parameters were compared among the 3 groups. The relationship between the CAIT score and the LHA and dynamic postural stability and instability were examined using multiple linear regression.
Results:
Compared with the healthy group, the CAI group had a significantly greater LHA (8.73°± 3.22° vs 6.09°± 3.26°; P < .05), higher DPSI (0.336 ± 0.046 vs 0.298 ± 0.035), and higher vertical stability index (0.303 ± 0.048 vs 0.264 ± 0.037; P < .05 for all). Multiple regression analysis showed that the LHA (β = −0.228; P = .033) and DPSI (β = −0.240; P = .025) were significantly associated with the CAIT score .
Conclusion:
Valgus rearfoot alignment and poorer dynamic postural control were associated with CAI among adolescent athletes.
A lateral ankle sprain (LAS) can occur and reoccur during sports activities. Studies have shown that the recurrence rate for LAS is high 7 (12%-47%) and that repeated LAS may lead to chronic ankle instability (CAI), resulting in ankle osteoarthritis. 11 It has been reported that the prevalence of CAI is 23.4% for high school and college athletes. 23 Furthermore, the incidence of CAI is 32% for female athletes compared with 17% for male athletes. 23 Even though 18% to 47% of childhood sprains result in CAI, 17 adolescent athletes and their coaches can underestimate LAS, and these athletes often return to sports competitions without appropriate treatment. To prevent LAS, it is important to recognize the problem, identify the cause of the injury, and implement injury prevention measures. However, there is a paucity of clear evidence of LAS risk factors for adolescent athletes.
Changes in foot alignment, 23 reduced ankle joint range of motion, 14 decreased single-leg standing balance, 13 and decreased performance ability (eg, during the single-leg hop test) 27 are risk factors for CAI. To the best of our knowledge, the relationships among foot alignment, intrinsic foot muscle (IFM) morphology (selected muscle thickness and cross-sectional area [CSA]), and physical performance (including postural control while jumping and landing) have not yet been examined among adolescent competitive athletes with CAI.
The primary aim of this study was to identify differences in foot alignment, IFM morphology, toe flexor strength, isokinetic muscle strength, and dynamic postural stability after jump landing among adolescent competitive athletes with and without a history of LAS and CAI. The secondary aim was to determine how these differences are related to the frequency of ankle sprains. We hypothesized that adolescent athletes with CAI would exhibit abnormal foot alignment, lower volumes of IFMs and plantar fascia thickness, reduced lower extremity muscle strength, and impaired dynamic postural control compared with coper and healthy adolescent athletes.
Methods
Participants and Study Groups
The protocol for this study received ethics committee approval, and all participants or their parents provided written informed consent/assent. Included were adolescent competitive athletes who underwent medical and physical examinations at a single institution between July 2020 and August 2021. Those who were certified as specially trained athletes by the city of Hiroshima and were willing to participate in this study met the inclusion criteria. These athletes were aged between 12 and 17 years and chosen by the Hiroshima Sports Association to undergo training for the development and enhancement of their abilities. The included athletes participated in rugby, badminton, sailing, judo, handball, wrestling, archery, water polo, figure skating, table tennis, kendo, handball, hockey, and basketball. Athletes with any injury within the past 3 months requiring a break from sports activities, any data collection error during measurements, any neurological disorder that might affect balance, and any lower extremity injury were excluded.
Participants were classified into 1 of the 3 groups: healthy adolescent competitive athletes (healthy group); coper adolescent competitive athletes (coper group); and adolescent competitive athletes with CAI (CAI group). The Cumberland Ankle Instability Tool (CAIT) (score range, 0-30) was used to screen participants for CAI and quantify the perception of ankle joint stability. 29 According to a previous study, participants whose CAIT scores were 26 were not included in any group. 3 Participants who had not sustained any ankle injury and whose CAIT score was ≥27 were considered healthy. If participants had sustained at least 1 ankle injury, reported no residual symptoms associated with the previous ankle sprain, and had a CAIT score ≥27 were classified as copers. Participants with CAI were required to have experienced all of the following: at least 1 ankle sprain, a recent ankle sprain >3 months before study entry, a history of recurrent sprains or ankle instability, and a CAIT score 3 ≤25.
From 119 adolescent competitive athletes assessed initially, 85 athletes (n = 49 boys; n = 36 girls) were included in the study—55 athletes in the healthy group, 19 in the coper group, and 11 in the CAI group. The flowchart of participant selection is depicted in Figure 1.
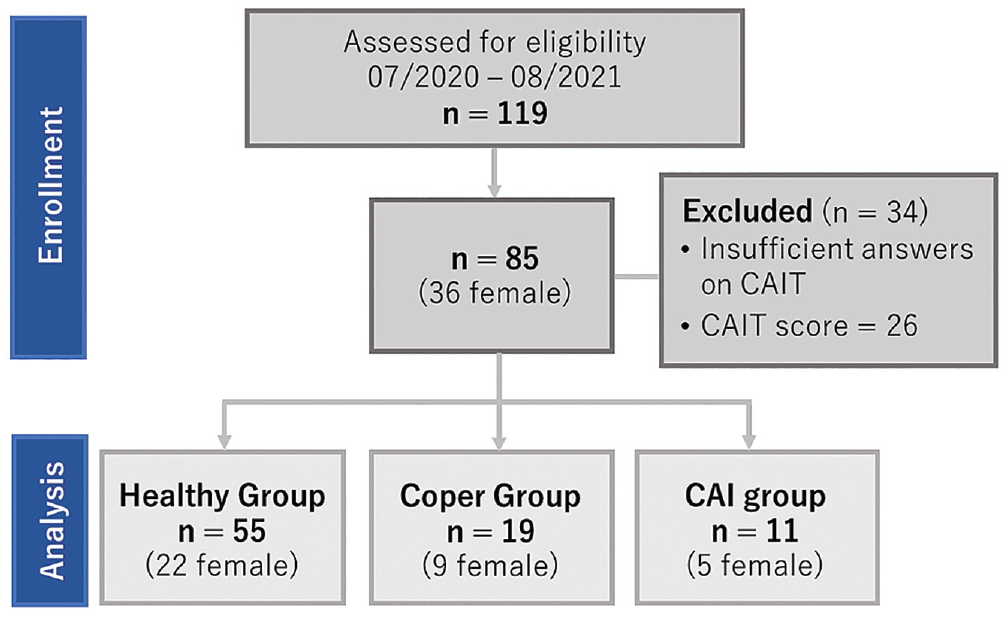
Flowchart of participant recruitment. CAI, chronic ankle instability; CAIT, Cumberland Ankle Instability Tool.
Measurement of Foot Alignment
The foot alignment variables in this study were foot arch height (FAH), foot arch dynamics, and leg-heel angle (LHA) for rearfoot eversion. The FAH was measured as the perpendicular distance from the navicular tuberosity to the floor in both the sitting position (FAH without weightbearing) and the double-limb standing position (FAH with 50% weightbearing per foot). 18 Semipermanent ink was used to mark the skin to determine the navicular tuberosity position by palpation. The FAH was presented as relative to the height of the participant (rFAH) 30 :

Foot arch dynamics was defined as the change in the FAH while sitting (ie, without weightbearing) and while standing (ie, 50% weightbearing per foot) using the following equation 30 :

The LHA was formed by the bisection of the distal one-third of the leg and a longitudinal line bisecting the posterior aspect of the calcaneus. 10 Participants were positioned on a 30 cm–tall box in the double-limb standing position with full weightbearing (Figure 2).

LHA in the weightbearing position. LHA, leg-heel angle.
Measurement of IFM Morphology
The CSA of the thickest areas of selected IFMs (abductor hallucis muscle, flexor hallucis brevis muscle, and flexor digitorum brevis muscle) was measured using B-mode ultrasonography (HI Vision Avius; Hitachi Aloka Medical) with an 8-MHz linear array probe. These IFMs were selected because they are the key supporting muscles of the medial longitudinal arch, which supports the foot structure.20,21 The probe position was determined by marking the skin with semipermanent ink. To perform the measurements, the probe was placed in contact with the skin while maintaining minimal pressure on the tissue. The participants were instructed to lie prone with the knees flexed at 90° and the ankles in a neutral position. The probe was placed on the anterior side of the medial malleolus, perpendicular to the long axis of the foot, and the CSA image of the abductor hallucis muscle was recorded. The probe was placed perpendicular to the line parallel to the flexor hallucis brevis muscle to record the CSA image. The CSA image of the flexor digitorum brevis muscle was recorded with the probe placed perpendicular to the line connecting the third toe and the medial calcaneal tuberosity. Morphometry of the IFM using ultrasound is reliable according to measurements 24 obtained using a previously reported procedure. 16
Measurement of Toe Flexor Strength
A digital grip dynamometer (T.K.K.3361; Takei Scientific Instruments) consisting of strain-gauge force transducers was used to measure the toe flexor strength. Participants sat with the hip and knee joints flexed at 90° and arms placed in front of the chest. 15 The foot was placed on a digital grip-measuring dynamometer and fixed to a heel stopper and belt, and all toes were set to hook onto a measurement traction bar. Participants were then asked to gradually increase their toe flexor strength for 0 to 3 seconds, with the maximum force maintained for 2 seconds. The force exerted by the metatarsophalangeal joint on pulling the bar was measured. Three measurements were recorded, and the mean of the measurements (N·m) was standardized by dividing by body weight (kg).
Measurement of Isokinetic Muscle Strength of the Lower Extremity
The maximum muscle strength during knee extension and flexion, ankle dorsiflexion, and plantar flexion were measured using Biodex system 4 (Sakai Medical). Muscle strength was measured as previously reported. 26 Participants were seated on the isokinetic dynamometer with 90° of hip flexion while wearing shoulder, body, and thigh harnesses as they performed the isokinetic knee strength assessment activities. Isokinetic knee extension and flexion strength were measured 5 times at 60 deg/s for each leg. For the isokinetic ankle strength assessment activities, participants wore shoulder, body, and thigh harnesses as they elevated the test leg while supporting it below the knee using a support arm. The foot was also placed on a footboard and secured using 2 hook-and-loop straps. Isokinetic ankle dorsiflexion and plantar flexion strength were measured 5 times at 60 deg/s for each leg. Participants rested for 2 minutes after each measurement and were instructed to exert maximal effort. They received verbal encouragement from the investigator (N.M.) during each test. Each measurement (N·m) was standardized by dividing by body weight (kg).
Measurement of Dynamic Postural Stability After Jump Landing
The single-leg jump with forward landing was performed to assess dynamic postural stability. The starting position of the participants was 40% of each height away from the force platform (49.5 × 49.5–cm) (AccuGait; AMTI). A 30-cm hurdle was placed at the midpoint of the line connecting the starting position and edge of the force plate. Participants were asked to jump forward over the hurdle with both feet and to land on a force plate with the right foot. They were instructed to stabilize as soon as possible after landing, place their hands on their pelvis, and remain still for 10 seconds. Upper limb movements during the jump were not restricted; however, they were limited by placing the hands on the pelvis after stabilization. The landing task was practiced 3 times, and a 1-minute rest period was allowed after the test. The trial was disregarded and repeated if the jump was unsuccessful, the participant touched a hurdle, the participant fell on landing, the participant landed on the ground outside the force plate, or the right limb touched the left limb. The force plate values were normalized to body weight.
The normalized force plate values were converted to a dynamic postural stability index (DPSI), in which a higher score indicates worse dynamic postural stability. The DPSI was calculated using the ground-reaction force (GRF) within 3 seconds of the first contact and a vertical GRF >5% of the body weight. GRF data were filtered using a zero-lag second-order low-pass Butterworth filter with a cutoff frequency of 20 Hz and were collected at a sampling frequency of 200 Hz. The DPSI was analyzed using the filtered data obtained with MATLAB 2021a (MathWorks Inc). The indicators comprising the DPSI were converted to an anteroposterior stability index, mediolateral stability index, and vertical stability index (VSI) according to Wikstrom et al. 28 An additional analysis was performed using the mean values obtained from 3 successful trials. 28 This method has high intersession reliability, with an intraclass correlation coefficient (ICC) 28 (3, k) of 0.86.
Statistical Analysis
The normality of data was confirmed using the Shapiro-Wilk test. All measurement variables were recorded as means and standard deviations. A 1-way analysis of variance was used to compare differences among the 3 study groups in physical characteristics (age, height, weight, and body mass index) as well as measured parameters (foot length, FAH, rFAH, foot arch dynamics, LHA, leg-heel thickness, CSA of the IFM, isokinetic muscle strength of the lower extremity, and DPSI). For significant effects, we conducted post hoc testing with Bonferroni correction for multiple comparisons. In addition, the association of the CAIT score with the LHA and DPSI was evaluated using multiple linear regression with forced entry, with the CAIT score as the dependent variable and the LHA and DPSI as the independent variables. The significance level was set at 5%.
A post hoc power analysis was performed as described previously. 2 This procedure estimated the power of the omnibus F test by considering the population effect size (f2), α error probability, sample size, and number of predictors included in the regression model (power [1 –β]). Statistical analyses were conducted using SPSS Statistics for Windows (Version 27.0; IBM Corp).
Results
Sports played by the athletes included rugby, badminton, sailing, judo, handball, wrestling, archery, water polo, figure skating, table tennis, kendo, handball, hockey, and basketball. The physical characteristics of the participants did not differ significantly among the 3 study groups (Table 1).
Comparison of Physical Characteristics by Study Group a

Data are shown as mean ± SD unless otherwise indicated. BMI, body mass index; CAI, chronic ankle instability; ES, effect size; N/A, not alicable.
Chi-square test.
The results of the group comparison of the measured parameters are shown in Table 2. Post hoc testing revealed a significantly greater LHA in the CAI group versus the healthy group (8.73°± 3.22° vs 6.09°± 3.26°, respectively; P < .05). The CAI group also had a significantly higher DPSI (0.336 ± 0.046 vs 0.298 ± 0.035, respectively) and VSI (0.303 ± 0.048 vs 0.264 ± 0.037, respectively) than the healthy group (P < .05 for both).
Comparison of Measured Parameters by Study Group a

Data are shown as mean ± SD. Bold P values indicate statistically significant differences among the 3 groups (P < .05). APSI, anteroposterior stability index; CAI, chronic ankle instability; CSA, cross-sectional area; DPSI, dynamic postural stability index; ES, effect size; FAH, foot arch height; LHA, leg-heel angle; MLSI, mediolateral stability index; rFAH, relative foot arch height; VSI, vertical stability index.
Significantly different from the CAI group (P < .05, post hoc test with Bonferroni correction).
Multiple regression analysis extracted the LHA (β = −0.228; P = .033) and DPSI (β = −0.240; P = .025) as factors significantly associated with CAIT scores (Table 3). During the post hoc power analysis, the multivariate regression models for the associations among the CAIT scores, LHA, and DPSI showed adequate power (1 –β = 0.890).
Multiple Regression Analysis of the Association of the CAIT Score With LHA and DPSI a
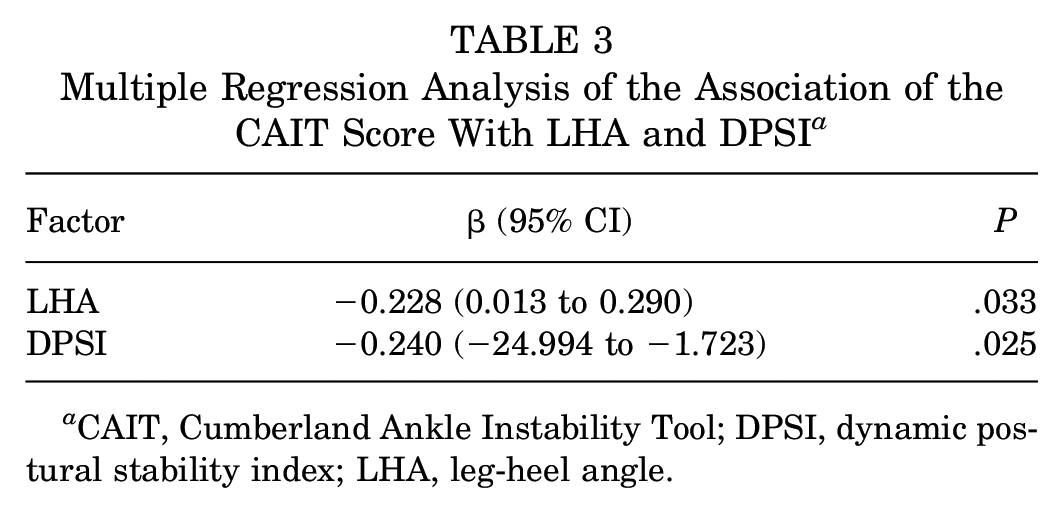
CAIT, Cumberland Ankle Instability Tool; DPSI, dynamic postural stability index; LHA, leg-heel angle.
Discussion
The main findings of this study were that the CAI group had larger rearfoot eversion and impaired DPSI, which represent the dynamic balance after jump landing, compared with the healthy group. Furthermore, the LHA and DPSI were also associated with the CAIT score. Our results provide the first experimental description of adolescent athletes who are aware of functional instability of the ankle joint, which has been associated with excessive valgus rearfoot and the reduced ability to control posture after jump landing. Those with CAI have various functional impairments, including ankle joint motion limitations, neuromuscular inhibition, pathologic laxity, muscle weakness, and balance difficulties because of abnormal ankle joint alignment, such as cavus foot deformity, anterior talar displacement, and recurrent ankle sprains. 6 During this study, we observed a significantly greater LHA in the CAI group than in the healthy group.
Our study used the LHA, which is used to assess rearfoot alignment and is formed by a longitudinal line bisecting the distal one-third of the leg and the posterior surface of the calcaneus. 10 The LHA test is a reliable (ICC, 0.88) and widely used indicator of rearfoot alignment abnormalities in the standing position. 31 In a cohort study by Kleipool et al, 12 participants with CAI had a slightly valgus-directed subtalar joint. Previous studies have reported a higher incidence of ankle sprains for female athletes with a greater calcaneal eversion. 1 Also, Tümer et al 25 suggested that the calcaneus of participants with CAI may have had a high valgus moment. Although the cavus foot is known as a risk factor for ankle sprains, 22 our study findings suggested that adolescent competitive athletes with CAI have abnormal alignment in the relative position of the tibia and the calcaneus, which constitute rearfoot alignment.
CAI was further associated with dynamic postural control of the adolescent competitive athletes in this study. The relationship between ankle instability and impaired balance was first noted by Freeman et al. 4 Several researchers reported impaired balance or postural control of patients with CAI. The relationship between ankle instability and balance impairment has been examined most often using the Star Excursion Balance Test. 5 An important conclusion of many studies conducted on the relationship between CAI and balance ability is that balance impairments have been consistently observed among these patients. A previous analysis of the outcome measures revealed that patients with CAI exhibit poor postural control performance compared with healthy people, as indicated by measurements of the reach distance and center of pressure values. 9 Similar results of this study indicated that adolescent competitive athletes with CAI also had reduced dynamic postural control. The present study suggested that adolescent athletes with CAI had poor dynamic stability control during jump landing, which is more directly related to sports movements.
The LHA and dynamic postural control were associated with the CAI of adolescent competitive athletes in this study. However, this interpretation remains debatable. Patients with CAI have various functional impairments—including ankle joint motion limitations, neuromuscular inhibition, pathologic laxity, muscle weakness, and balance difficulties—because of abnormal ankle joint alignment. 6 Abnormal positioning of the tibia and calcaneus, which comprise the rearfoot, is closely related to impaired postural stability in the dynamic steady state. 8 During this study, the CAI of adolescent competitive athletes was associated with greater rearfoot eversion and dynamic postural stability after jump landing. A prospective study reported that poor lower extremity alignment during the drop jump was associated with a higher risk of ankle injury for adolescent competitive athletes. 19 Therefore, proper foot and ankle alignment, flexibility, and stability of adolescent athletes may be important for postural control after jump landing and injury prevention. The importance of evaluating adolescent athletes with CAI with a focus on hindfoot alignment and dynamic balance is apparent and may be utilized in treatment strategies for CAI and injury prevention.
Limitations
This study had several limitations. First, the study did not account for sex-based differences among participants. Second, the sample size of this study was too small to compare adolescent athletes according to their sports activity. Finally, because this was a cross-sectional study, the causal association between CAI and poor foot morphology and dynamic posture could not be clarified.
Conclusion
In this study, adolescent competitive athletes with CAI demonstrated poor dynamic balance and larger rearfoot eversion. Thus, it is important to detect the presence of dynamic imbalance and foot malalignment in adolescent competitive athletes with persistent ankle instability. Moreover, early approaches to these abnormalities are of high importance. This finding may be useful for the prevention and treatment of chronic ankle instability in adolescent competitive athletes.
Footnotes
Acknowledgements
The authors thank the participants of this study. They also thank Editage for the English language editing.
Final revision submitted April 9, 2023; accepted May 19, 2023.
The authors have declared that there are no conflicts of interest in the authorship and publication of this contribution. AOSSM checks author disclosures against the Open Payments Database (OPD). AOSSM has not conducted an independent investigation on the OPD and disclaims any liability or responsibility relating thereto.
Ethical approval for this study was obtained from Hiroshima University (reference No. E-941-1).