
Abstract
Background:
Few studies exist for large defects comparing matrix-associated autologous chondrocyte implantation (M-ACI) with other cartilage repair methods due to the limited availability of suitable comparator treatments.
Purpose:
To compare the clinical efficacy of a novel hydrogel-based M-ACI method (NOVOCART Inject plus) versus microfracture (MFx) in patients with knee cartilage defects.
Study Design:
Cohort study; Level of evidence, 3.
Methods:
Propensity score matched-pair analysis was used to compare the 24-month outcomes between the M-ACI treatment group from a previous single-arm phase 3 study and the MFx control group from another phase 3 study. Patients were matched based on preoperative Knee injury and Osteoarthritis Outcomes Score (KOOS), symptom duration, previous knee surgeries, age, and sex, resulting in 144 patients in the matched-pair set (72 patients per group). The primary endpoint was the change in least-squares means (ΔLSmeans) for the KOOS from baseline to the 24-month assessment.
Results:
Defect sizes in the M-ACI group were significantly larger than in the MFx group (6.4 versus 3.7 cm2). Other differences included defect location (no patellar or tibial defects in the MFx group), number of defects (33.3% with 2 defects in the M-ACI group versus 9.7% in the MFx group), and defect cause (more patients with degenerative lesions in the M-ACI group). The M-ACI group had higher posttreatment KOOS (M-ACI versus MFX: 81.8 ± 16.8 versus 73.0 ± 20.6 points) and KOOS ΔLSmeans from baseline to 24 months posttreatment (M-ACI versus MFX: 36.9 versus 26.9 points). Treatment contrasts in KOOS ΔLSmeans from baseline indicated statistical significance in favor of M-ACI from 3 to 24 months posttreatment (P = .0026). Significant and clinically meaningful differences in favor of M-ACI at 24 months were also found regarding International Knee Documentation Committee (IKDC) score ΔLSmeans from baseline (37.8 versus 30.4 points; P = .0334), KOOS responder rates at 24 months (≥10-point improvement from baseline; 94.4% versus 65.3%; P < .0001), IKDC responder rates at 24 months (>20.5-point improvement from baseline; 83.3% versus 61.1%, P = .0126) and MOCART (Magnetic Resonance Observation of Cartilage Repair Tissue) score in a subgroup of patients (LS means, 86.9 versus 69.1; P = .0096).
Conclusion:
In this exploratory analysis, M-ACI using an in situ crosslinked hydrogel demonstrated superior clinical and structural (MOCART) 24-month outcomes compared with MFx in patients with knee cartilage defects.
The superiority of autologous chondrocyte implantation (ACI), especially of matrix-associated (M-)ACI products over microfracture (MFx) in the treatment of focal cartilage defects of the knee has been well-documented, in particular for large lesions and long-term clinical outcomes, in a comprehensive series of published systematic reviews, meta-analyses, and clinical guidelines. 1,3,14,15,23,53,56,65
The reason underlying the inferior long-term results for MFx when compared with ACI/M-ACI is thought to relate to the poor tissue quality and degree of defect fill particularly in larger lesions. 44,12 Similar limitations have been reported for autologous osteochondral transfer (OAT), including increased complication and failure rates for larger defects requiring the use of more than 2 cartilage-bone cylinders. 20,38,66 For other cartilage repair procedures using bone marrow concentrate, mesenchymal stem cells, particulated juvenile allograft cartilage, or minced cartilage, it is still unclear whether they are superior to bone marrow–stimulation techniques in terms of their effectiveness and whether they can achieve results similar to ACI/M-ACI, especially with regard to larger defects and longer follow-up times. 3
For traditional M-ACI such as MACI (Vericel; approved in the United States), the chondrocytes are seeded on a collagen scaffold, which is cut to fit the defect and then fixed by gluing or suturing during a mini-arthrotomy. Newer methods, such as Spherox (CO.DON; approved in Europe), allow for an all-arthroscopic application of the autologous chondrocytes without the need for further fixation.
We have developed a self-adhesive, hydrogel-based M-ACI system for arthroscopic application (NOVOCART Inject plus; TETEC–Tissue Engineering Technologies), which is under current investigation in a prospective, international, single-arm phase 3 study in patients with large cartilage defects in the knee (≥4 cm2). The 2-year results of this study (referred to as the NInject trial) were published in 2022, 46 while follow-up of outcomes out to 5 years is ongoing. The single-arm nature of the study design was justified based on ethical concerns for the use of MFx or OAT as comparators in a larger defect size range (≥4 cm2) and the lack of an authorized (M-)ACI product as suitable comparator at the time of study initiation. The use of osteochondral allografts as a control group for a randomized study in large defects was also not considered feasible, as this technique is hampered by the limited availability of suitable grafts, particularly in Europe.
It is, however, acknowledged that the lack of a control group is a limitation of the NInject trial. Therefore, efficacy data from the original single-arm trial were compared with a historical MFx control group from a randomized phase 3 M-ACI trial using propensity score matching (PSM). The results of the PSM analysis after a follow-up of 24 months are presented here.
Methods
Study Participants
Patients in the M-ACI group of the current study were chosen from the NInject trial (ClinicalTrials.gov identifier NCT03319797; EudraCT No. 2016-002817-22), and patients in the MFx group were chosen from the control group of a randomized phase 3 study comparing NOVOCART 3D plus and MFx (referred to as N3D trial; ClinicalTrials.gov identifier NCT01656902; EudraCT No. 2011-005798-22). Both trials were conducted in full compliance with the principles laid down in the Declaration of Helsinki, the Guideline E6 for Good Clinical Practice of the International Conference on Harmonization, and relevant local laws and regulations. After approval by the local ethics committees and federal authorities, patients who consented in writing to participate in the trials were enrolled and treated between October 2017 and February 2019 in the NInject trial and between May 2013 and February 2018 in the N3D trial.
The inclusion and exclusion criteria of the 2 patient cohorts used for this study were similar (Table 1). In both trials, men and women aged 18 to 65 years (or minors at the age of at least 14 years with closed epiphyseal growth plate) with localized articular cartilage defects of the knee (International Cartilage Repair Society [ICRS] grade 3 or 4; maximum of 2 defects) were eligible for enrollment. Relevant differences in eligibility criteria included defect size (4-12 cm2 in the NInject trial and 2-6 cm2 in the N3D trial), defect location (patellar and tibial defects could be treated in the NInject trial but were excluded in the N3D trial), and prior cartilage repair (allowed in the NInject trial but not in the N3D trial).
Main Inclusion and Exclusion Criteria in the NInject and N3D Phase 3 Trials a

a BMI, body mass index; ICRS, International Cartilage Regeneration & Joint Preservation Society; IKDC, International Knee Documentation Committee; KOOS, Knee injury and Osteoarthritis Outcomes Score; M-ACI, matrix-associated autologous chondrocyte implantation; MFx, microfracture.
Surgical Techniques and Rehabilitation
MFx, a single-step surgical procedure, was performed according to Steadman and colleagues. 67 M-ACI was performed as described previously. 46 Briefly, in the first step, osteochondral biopsies were harvested from patients during arthroscopic surgery from a nonweightbearing area of the knee joint. In the second step, M-ACI was performed either arthroscopically or through a mini-arthrotomy approach using NOVOCART Inject plus, a 2-component hydrogel-based M-ACI system, consisting of an autologous articular chondrocyte suspension (2-8 million cells per mL) and a crosslinker solution. During injection via a dual-chamber syringe application system, the cell containing component and the cross-linker solution are mixed resulting in the formation of the cell-seeded hydrogel at the site of administration.
After surgery, patients in both groups followed a defined rehabilitation protocol based on Hirschmueller and colleagues. 28 Limitations on weightbearing for 6 weeks were recommended with stepwise increase to full weightbearing between 7 and 8 weeks after surgery. Continuous passive motion with increasing range of motion was started from the day after surgery for 6 weeks. Within the first 6 weeks, physical therapy was aimed primarily at the reduction of swelling, isometric quadriceps activity, and mobilization. The phase from week 12 to 26 was characterized by strength training, maximum sensorimotor stimulation, and low-impact sports such as cycling or Nordic walking. After week 26, a stepwise return to sports was allowed depending on the persisting differences between treated and untreated leg and clinical symptoms. Criteria for unrestricted sports performance included being completely pain-free and having normal findings in the clinical examination of the knee joint as well as an almost complete return of strength and sensorimotor control, while return to high-impact sports was recommended after 12 months at the earliest.
Propensity Score Matching
In a prespecified PSM procedure, each patient in the treatment group was matched with 1 patient from the comparison group (1:1 matching). A greedy algorithm was used for matching patients from both trials. The width required for matching patients was set at 0.2 times the pooled standard deviation estimate of the logit of the propensity score.
A logistic regression model was used for the 2 treatment groups to estimate the propensity score. Patients from the NInject trial with prior failed cartilage repair on the target knee were excluded from this analysis, as this was an exclusion criterion in the N3D trial. Influencing variables that were expected to have an impact on the therapy effect included in the model were Knee injury and Osteoarthritis Outcomes Score (KOOS) values at baseline, time since first symptoms, prior target knee surgery, age, and sex. These variables were selected based on their statistical significance in the primary models as well as models of covariate effects for the KOOS in the N3D trial. As defect sizes differed significantly in the 2 studies (4-12 cm2 in the NInject trial versus 2-6 cm2 in the N3D trial), defect size was not included as a variable in the model to estimate the propensity score, as this would have resulted in an insufficient number of expected matched pairs for meaningful statistical analyses.
Assessment Criteria and Statistical Analysis
Assessment was based on 2 patient-reported outcome measures: the KOOS and the International Knee Documentation Committee (IKDC) score. Both scores had been collected in both original trials preoperatively and at 3, 6, 12, 18, and 24 months postoperatively.
Magnetic resonance imaging (MRI) was performed 12 and 24 months posttreatment in a subgroup of patients in both study groups that were treated at clinical sites equipped with a 3-T MRI scanner with a dedicated knee coil. The MRI protocol comprised morphological sequences (3-dimensional [3D] proton density–weighted gradient echo [GRE] sequence as well as 2-dimensional T1-weighted fast spin-echo [FSE] sequence and proton density–weighted and T2-weighted FSE sequence with and without fat saturation). The MRI scans were analyzed by central review of clinical radiologists based on the MOCART (Magnetic Resonance Observation of Cartilage Repair Tissue) score. 40 The MOCART score (range, 0 [no repair] to 100 [normal cartilage]) was calculated for each individual lesion. 40,63
Primary Efficacy Analysis
The primary efficacy endpoint was the change in overall KOOS from baseline to 24 months posttreatment. The overall KOOS is an unweighted average of the 5 subscale scores (pain, symptoms, activities of daily living, sports/recreation [Sports/Rec], and quality of life [QoL]).
The treatment effect at each postbaseline timepoint was estimated using the change in least-squares means (ΔLSmeans) from baseline, as well as associated 95% CIs and P values. The ΔLSmeans for the KOOS from baseline to 24-month follow-up was analyzed by a linear mixed-effect model for repeated measurements (MMRM) using all the longitudinal observations of the KOOS after implantation up to and including posttreatment month 24 (except observations obtained after surgical intervention in patients classified as having treatment failures). The model included the effects of treatment, region (Western Europe versus Central and Eastern Europe), visit, treatment × visit interaction, and baseline score. The MMRM analysis was performed based on the assumption that missing data were missing independently of unobserved data or missing at random. To evaluate the robustness of this approach, missing data were imputed using the imputation using dropout reason (IUDR) approach: if the reason for missing data was treatment related, the 10th percentile of the changes from baseline in the matched-pairs set was used; otherwise, the matched-pairs set median was used.
The difference between M-ACI and MFx treatment was descriptively analyzed using 2 testing procedures. (1) Noninferiority was indicated if the lower bound of the 95% CI for the difference between the M-ACI and MFx groups was >8.5 points. The descriptive noninferiority margin was based on a previous study by Niemeyer and colleagues. 47 (2) Superiority of M-ACI versus MFx was indicated if the lower bound of the 95% CI for the difference between the M-ACI and MFx groups was >0.
Secondary Efficacy Endpoints
The secondary efficacy endpoints were ΔLSmeans for the KOOS subscores and IKDC score from baseline to 24 months, the overall KOOS and IKDC score responder rates, and MOCART score. The overall KOOS responder rate was defined as the proportion of patients displaying a ≥10-point improvement from baseline to 24 months posttreatment. This threshold was based on Roos and Lohmander, 58 who suggested an 8- to 10-point increase in KOOS to represent the minimal clinically relevant clinical improvement. Patients with missing endpoint assessments and those classified as having treatment failure before or during the respective visit were considered as nonresponders regardless of their KOOS outcome. KOOS responder rates at month 24 were stratified by region (Western Europe versus Central and Eastern Europe) and compared using the Cochran-Mantel-Haenszel chi-square test. A sensitivity analysis was performed using a complete case approach. Only nonmissing KOOSs collected at the respective visit were analyzed. Patients classified as having treatment failure before or during the respective visit were handled as nonresponders, regardless of KOOS outcome.
The ΔLSmeans from baseline for the IKDC and the IKDC responder rates, defined as the proportion of patients with a change in IKDC baseline score of >20.5 points (as defined by Roos et al 57 ), were analyzed as described for the KOOS.
A linear MMRM was employed for exploratory analysis of the MOCART score. In addition, the MOCART subscores that reflect the status of graft maturation (subscores 1-6) were evaluated by means of generalized linear mixed models. The models for these analyses included fixed, categorical effects of treatment, visit, and treatment × visit interaction. Treatment effects were estimated by the contrasts between M-ACI and MFx for each slotted visit.
Potential correlations of the ΔLSmeans from baseline for the KOOS with the MOCART sum score and subscores 1 to 6 were evaluated using generalized linear modeling, with the MOCART sum score and subscores as independent variables in separate models for each variable at posttreatment month 24. Only the data collected from larger lesions were used for the model-based analyses of MOCART evaluations. Statistical analysis was performed using SAS 9.4 for Microsoft Windows software (SAS Institute).
Results
Propensity Score Analyses
Of 92 patients eligible in the M-ACI group and 85 in the MFx group, a total of 72 matched pairs were selected by the predefined matching procedure. The mean propensity scores in the eligible (ie, before matching) M-ACI and MFx patients were 0.5543 and 0.4824, respectively, with a mean difference of 0.0718. In the matched-pairs population, the mean propensity scores in the M-ACI and MFx groups were 0.5327 and 0.5166, respectively, with a reduction in mean difference of 0.0161.
For most variables, a marked decrease in the mean difference was observed between the eligible population and the matched pairs (baseline KOOS, 81.7%; time since symptoms, 44.3%; age, 60.3%; sex, 100%; logit propensity score, 77.9%). The only variable with no reduction in mean differences was “prior surgeries on the target knee” which is explained by the eligible population already having optimally similar proportions of patients with prior surgeries on the target knee between M-ACI and MFx. The variance ratios for all variables in the matched-pair population were well within the commonly used bounds of 0.5 to 2.0. 69
The standardized mean differences between M-ACI and MFx groups in the eligible and matched populations are displayed in Figure 1, which includes a cutoff of 0.1 for negligible differences based on recommendations by Normand and colleagues. 51 The standardized differences of all variables were in the range of negligible differences, except for time since symptoms and logit propensity score, which were slightly above the cutoff point (0.1062 and 0.1226), but which was considered nonsignificant.

Standardized mean differences before and after propensity score matching. KOOS, Knee injury and Osteoarthritis Outcomes Score; M-ACI, matrix-associated autologous chondrocyte implantation; MFx, microfracture.
Patient Population
Both M-ACI and MFx groups included patients from Lithuania, Czech Republic, Hungary, and Germany (119 patients in total). The MFx group additionally included patients from Poland, France, Latvia, Switzerland, and the United Kingdom (25 patients in total). Patient demographic and baseline characteristics are summarized in Table 2. The treatment groups were well balanced with respect to the matched variables. Body mass index and tobacco use were likewise well balanced between groups. No relevant differences regarding prior and concomitant medical conditions were identified. A slight imbalance in the number of patients with concomitant surgeries (ie, surgeries other than M-ACI transplantation or MFx) was considered irrelevant.
Patient Characteristics and Baseline Data a

a Data are shown as mean ± SD (range) or No. of patients (%) unless otherwise indicated. KOOS, Knee injury and Osteoarthritis Outcomes Score; ICRS, International Cartilage Regeneration & Joint Preservation Society; M-ACI, matrix-associated autologous chondrocyte implantation; MFx, microfracture; OCD, osteochondritis dissecans.
b Most common previous surgeries (≥5% at the preferred term level).
c Performed in >1 patient.
d Lesions were classified into larger and smaller lesions, ie, in patients with 2 lesions, the classification was based on the size of the respective lesions, while in patients with 1 lesion, this lesion was classified as the larger lesion.
e All lesions per patient were summed to a single value.
There were group differences in defect characteristics that were mainly based on the inclusion/exclusion criteria in the phase 3 trials from which the treatment cohorts originated. In the MFx group (N3D trial), all defects were located on the femur (other locations were excluded), while in the M-ACI group (NInject trial) 85.4% of defects were located on the femur, 10.4% on the patella, and 4.2% on the tibia.
Overall defect sizes were clearly larger in the M-ACI group (M-ACI versus MFx: 6.4 versus 3.7 cm2). The majority (75%) of defects in the M-ACI group were ICRS grade 3, whereas ICRS grades 3 and 4 were well balanced in the MFx group. A higher proportion of patients in the M-ACI group had 2 defects (33.3% versus 9.7% in the MFx group). In both groups, the majority of defects were caused by trauma (60.4% in the M-ACI group and 78.5% in the MFx group), while clearly more defects in the M-ACI group had a degenerative origin (33.3% versus 6.3% in the MFx group). In the M-ACI group 6.3% of defects were caused by osteochondritis dissecans (OCD) versus none in the MFx group (OCD was an exclusion criterion in the N3D trial).
Clinical Efficacy
The overall KOOS values and changes from baseline over time are presented in Table 3 and illustrated in Figure 2. The KOOS increased from 41.7 points at baseline to 81.8 at 24 months posttreatment in the M-ACI group and from 43.1 points to 73.0 in the MFx group. Corresponding ΔLSmeans from baseline at 24 months were 36.9 points in the M-ACI group and 26.9 points in the MFx group. This difference in favor of the M-ACI group was statistically significant (treatment contrast: 10.02 points [95% CI, 3.57-16.46 points]; P = .0026). Treatment contrasts achieved at earlier timepoints showed nominal significance in favor of M-ACI from 3 months posttreatment onward.
The sensitivity analysis using IUDR reflected the results of the main analysis and supported the treatment contrast robustness, with significantly higher overall KOOS ΔLSmeans from baseline in the M-ACI group from 3 months posttreatment onward (treatment contrast at 24 months: 8.64 points [95% CI, 2.37-14.90 points]; P = .0073).
Overall KOOS responder rates (≥10-point improvement) at posttreatment month 24 were significantly higher for M-ACI (M-ACI, 94.4%; MFx, 65.3%; P < .0001) (Figure 3). The sensitivity analysis using complete cases supported the results of the main analysis (M-ACI, 94.4%; MFx, 78.3%; P = .0171). Regarding earlier timepoints, overall KOOS responder rates were always higher in the M-ACI group compared with MFx in the main and sensitivity analyses (not tested for statistical significance).
The treatment differences in KOOS subscores at 24 months were always in favor of the M-ACI regimen, and these differences were statistically significant at 24 months and over time for all subscores (P < .05 for all). The highest changes from baseline as well as the highest treatment contrasts were observed for KOOS-Sports/Rec and KOOS-QoL (treatment contrasts: Sports/Rec, 14.05 points [95% CI, 5.20-22.89 points]; QoL, 11.36 points [95% CI, 2.51-20.21 points]). A substantial benefit as defined by Ogura et al 52 was achieved by 84.7% of patients for KOOS-Sports/Rec (≥30-point improvement) and by 72.2% of patients for KOOS-QoL (≥37.5-point improvement) in the M-ACI group, compared with 56.9% and 44.4% in the MFx group, respectively.
The IKDC increased from 36.3 points at baseline to 75.4 at 24 months in the M-ACI group and from 35.5 to 68.8 points in the MFx group. Significant and clinically meaningful differences in favor of M-ACI at 24 months were found regarding the IKDC ΔLSmeans from baseline (37.8 versus 30.4 points; P = .0334) and IKDC responder rates (83.3% versus 61.1%; P = .0126). The corresponding results of the sensitivity analyses indicated higher IKDC ΔLSmeans from baseline and responder rates in the M-ACI group at all timepoints; however, statistical significance was only met for IKDC ΔLSmeans from baseline at 6 and 12 months and over the entire follow-up period (P = .0332).
Overall KOOS Values and Changes in Least-Square Means from Baseline a

a ΔLSmeans, change in least-squares means; KOOS, Knee injury and Osteoarthritis Outcomes Score; M-ACI, matrix-associated autologous chondrocyte implantation; MFx, microfracture.
b Difference in ΔLSmeans from baseline between groups. Positive values favor the M-ACI group, negative values favor the MFx group.
c Eight patients had dropped out before the 24-month assessment, 1 patient did not show up for the 24-month visit, 2 patients were out of the analysis window, and for 1 patient the KOOS was not able to be evaluated.

Improvement in overall KOOS for the M-ACI group (solid line) and the MFx group (dashed line). (A) Absolute overall KOOS values. (B) Changes in least-squares means (ΔLSmeans) from baseline. Error bars indicate 95% CIs. Asterisks indicate significant difference between treatment groups (P < .05). BL, baseline; KOOS, Knee injury and Osteoarthritis Outcomes Score; M-ACI, matrix-associated autologous chondrocyte implantation; MFx, microfracture; ΔLSmeans, change in least-squares means.

Overall KOOS responder rates (≥10-point improvement) over time in the M-ACI and MFx groups. The asterisk indicates a significant difference between treatment groups (P < .0001). M-ACI, matrix-associated autologous chondrocyte implantation; MFx, microfracture; KOOS, Knee injury and Osteoarthritis Outcomes Score.
Imaging Outcomes
The MOCART analysis was performed in the subgroup of patients who had undergone MRI (21 patients with 25 lesions [mean lesion size, 5.3 ± 1.7 cm2; range, 1.0-9.0 cm2] in the M-ACI group and 28 patients with 31 lesions [mean lesion size, 3.3 ± 1.1 cm2; range, 2.0-6.0 cm2] in the MFx group). Table 4 summarizes the results for the MOCART sum score and subscores 1 to 6.
MOCART Sum Score and Subscores 1 to 6 After 12 and 24 Months a
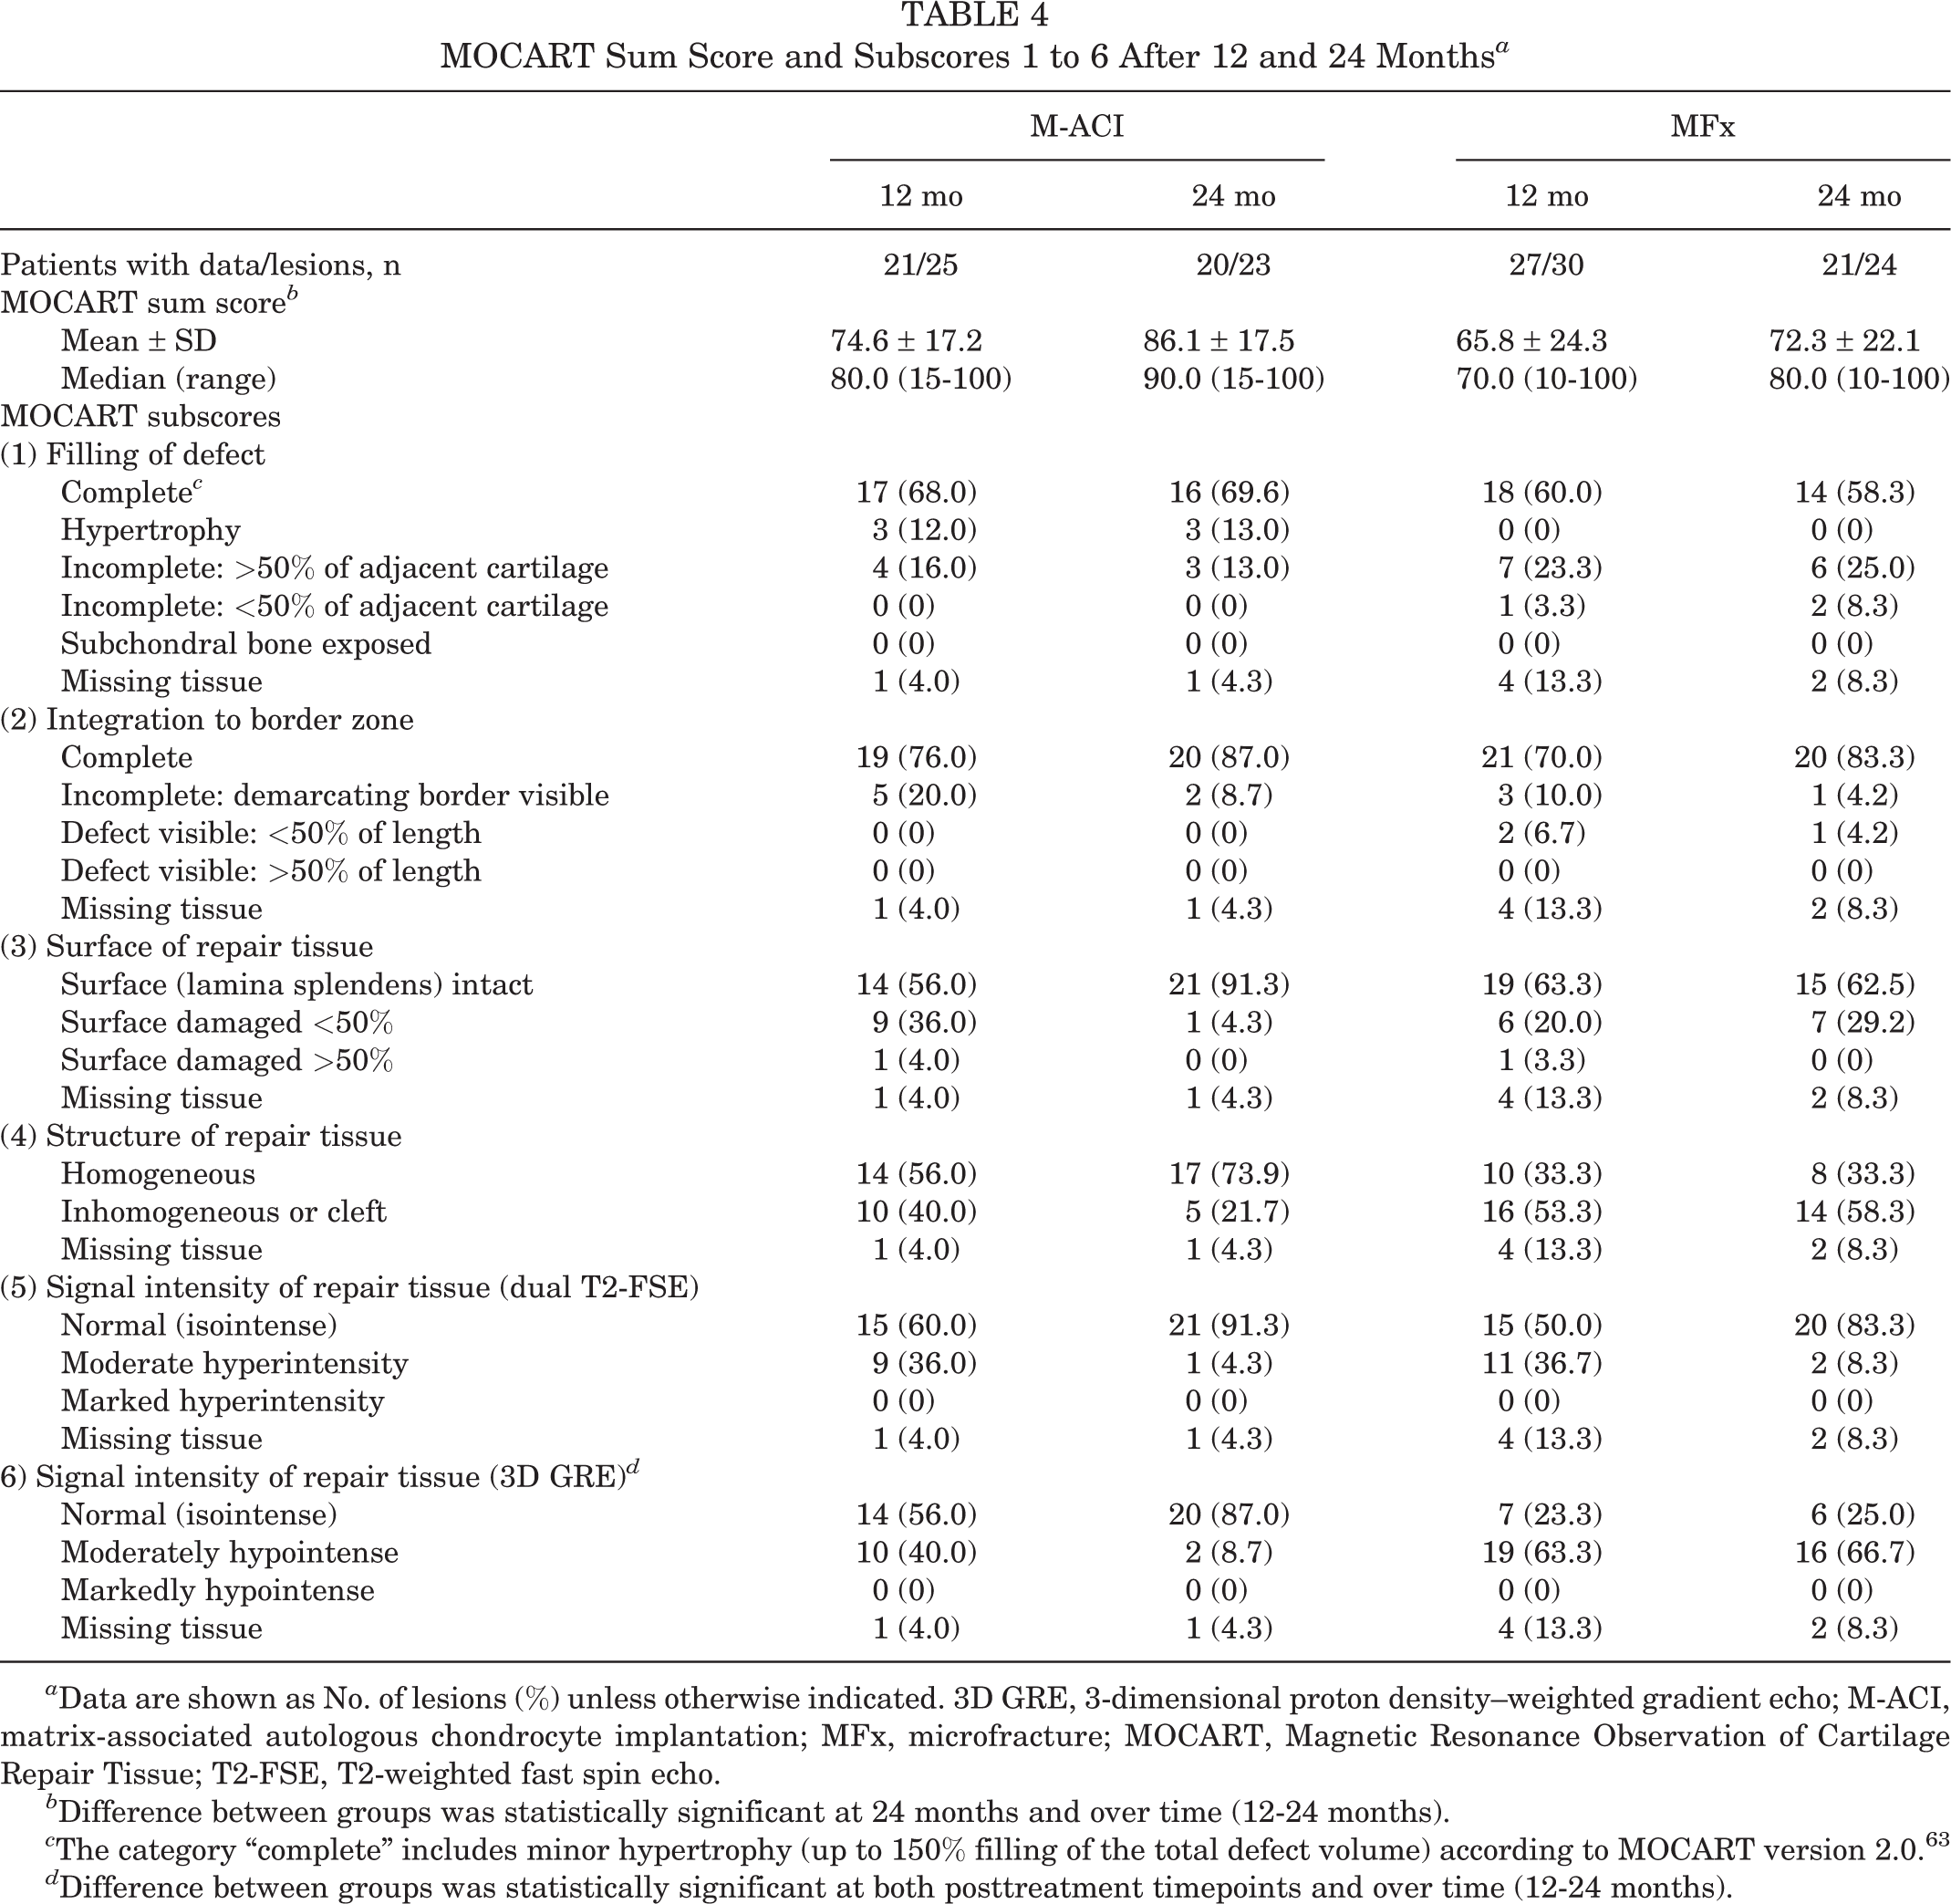
a Data are shown as No. of lesions (%) unless otherwise indicated. 3D GRE, 3-dimensional proton density–weighted gradient echo; M-ACI, matrix-associated autologous chondrocyte implantation; MFx, microfracture; MOCART, Magnetic Resonance Observation of Cartilage Repair Tissue; T2-FSE, T2-weighted fast spin echo.
b Difference between groups was statistically significant at 24 months and over time (12-24 months).
c The category “complete” includes minor hypertrophy (up to 150% filling of the total defect volume) according to MOCART version 2.0. 63
d Difference between groups was statistically significant at both posttreatment timepoints and over time (12-24 months).
At posttreatment months 12 and 24, mean MOCART values were higher in the M-ACI group compared with the MFx group (month 12: 74.6 versus 65.8; month 24: 86.1 versus 72.3) (Table 4). The LS mean difference between treatment groups of 17.8 points at month 24 (MOCART score LS mean: 86.9 points for M-ACI and 69.1 points for MFx) was significant (P = .0096), whereas the difference of 10.4 at month 12 was not (P = .1296). The statistically significant global P values for the factors of treatment (P = .0338), visit (P < .0001), and treatment × visit interaction (P = .0313) indicated significantly better improvement and increasing treatment difference from 12 to 24 months in the M-ACI group.
MOCART subscores 1 to 6 were all in favor of the M-ACI treatment at 24 months (odds ratios >1). The largest differences (ie, more than 20 percentage points) were noted for the proportion of lesions with intact surface and homogeneous structure of the repair tissue, as well as isointense signal intensity based on 3D GRE. Less pronounced differences in favor of the M-ACI group were seen for complete graft integration to the border zone, isointense signal intensity based on dual T2-FSE and complete defect filling. However, the treatment difference was statistically significant in signal intensity (3D GRE) only (P = .0014). At 24 months, 69.6% of defects in the M-ACI group were completely filled compared with 58.3% in the MFx group. Hypertrophy was observed in 3 defects (13%) in the M-ACI group (nonsymptomatic, no reoperation required) and none in the MFx group.
Improvements in MOCART subscores from 12 to 24 months indicated ongoing graft maturation in the M-ACI group based on graft integration, signal intensity (dual T2-FSE and 3D GRE) as well as graft surface and structure, while repair tissue maturation in the MFx group was less pronounced (improvement from 12 to 24 months only in graft integration and dual T2-FSE signal intensity) (Table 4).
No significant correlation between any MOCART parameters (sum score or subscores 1-6) and KOOS change from baseline were found.
Treatment Failures and Unplanned Surgeries
No treatment failures (defined as surgical reinterventions affecting the closed surface of the transplant area) were reported in either the M-ACI or MFx group. Unplanned surgeries (ie, surgeries performed after M-ACI or MFx treatment) were performed in 6 patients (8.3%) in the M-ACI group and 3 patients (4.2%) in the MFx group (Table 5). In the MFx group, none of these unplanned subsequent surgeries was assessed as treatment related. In the M-ACI group, 1 patient experienced a surgery-related lateral patellar compression syndrome possibly caused by overtightened sutures of the knee joint capsule during transplantation surgery. The osteotomy performed in the M-ACI group was due to a weightbearing varus deformity not detected at study entry. This osteotomy was independent of the performed ACI (both treated defects looked good at the time of the osteotomy).
Unplanned Surgeries on the Target Knee a

a Data are shown as No. of patients (%). Procedures are MedDRA preferred terms. M-ACI, matrix-associated autologous chondrocyte implantation; MFx, microfracture.
b Joint dislocation reduction was performed to treat lateral patellar compression syndrome.
Discussion
In the present propensity score matched-pairs analysis comparing a hydrogel-based M-ACI (NOVOCART Inject plus) and MFx in patients with focal cartilage defects of the knee, both treatment groups showed significant KOOS improvement up to 24 months posttreatment. M-ACI showed statistically significant superiority in terms of KOOS ΔLSmeans from baseline from 3 months up to 24 months of follow-up (P = .0026). This superiority in the primary outcome was consistently reflected in all other efficacy variables: KOOS subscore ΔLSmeans from baseline (P < .05 for all subscores), IKDC ΔLSmeans from baseline (P = .0334), KOOS and IKDC responder rates (P < .0001 and P = .0126, respectively), and MOCART scores (P = .0096).
Both treatment groups in the matched-pairs population were comparable regarding baseline KOOS, sex, age, body mass index, duration of symptoms, smoking status, and previous knee surgeries. There were some differences in defect characteristics between treatment groups in terms of defect location (no patellar or tibial defects in the MFx group), number of defects (more patients with more than 1 defect in the M-ACI group) and defect cause (more patients with degenerative lesions in the M-ACI group; no OCD lesions in the MFx group). A further difference between both treatment groups concerned defect size which was clearly larger in the M-ACI group compared to the MFx group (total defect size: 6.4 versus 3.7 cm2).
Regarding defect location, several studies have reported overall similar clinical and radiological outcomes with ACI/M-ACI for femoral and patellar cartilage defects, 6,24 while worse outcomes for patellar defects have been observed according to other publications. 37,49,50 Niemeyer et al 48 reported similar absolute KOOS values for patients with femoral and retropatellar defects 5 years after M-ACI, while changes from baseline were higher in the patella group due to lower baseline KOOS values. Tibia as defect location was described to be a negative prognostics factor. 49 In terms of the number of treated defects, several authors have reported better clinical results in patients with single-site ACI, 21,37,49 whereas Behrens et al found no worse results for multiple lesions. 6 Regarding defect cause, worse clinical outcomes were reported for patients affected by degenerative lesions compared with those with traumatic or OCD lesions that generally have a good prognosis. 33,34,49,55
However, neither defect location nor number of treated defects or defect cause had a significant impact on overall KOOS in the covariate analyses of the phase 3 studies used for the PSM. Therefore, the imbalances related to these parameters are not expected to have biased the interpretation of the matched-pair analysis results and, if so, the M-ACI group would have been overall disadvantaged as outlined above.
From the published literature, no influence of lesion size on clinical outcome after ACI/M-ACI has been reported. 6,21,29,33,37,50,61 In addition, a case series in 130 patients did not find a significant influence of defect size on return to sports. 54 One study reported poorer clinical outcomes after ACI in patients with lesions larger than 5 cm2 than in those with smaller lesions, although the differences were not statistically significant. 4 Large uncontained defects are also described as negative prognostic factor for ACI in 1 publication. 49 Furthermore, defect size had no impact on overall KOOS in the covariate analyses of the phase 3 studies used for PSM. Overall, for M-ACI there seems to be rather no influence of defect size on clinical outcome after M-ACI. However, if there might be any potential influence of defect size, it would have disfavored the M-ACI group.
In contrast to ACI/M-ACI, several studies have shown that MFx performed worse in the treatment of larger lesions. 22,26,33 This explains why particularly for larger cartilage lesions, comparative studies have demonstrated that ACI, and in particular M-ACI, is superior to MFx also in short- to medium-term follow-up. In a randomized level 1 phase 3 study on M-ACI versus MFx for the treatment of large cartilage defects (5 cm2), significantly better clinical results were reported for M-ACI after 2 and 5 years. 11,59 Similar results were reported in another study for defect sizes of 4 to 10 cm2. 5 The superior efficacy of M-ACI in the treatment of larger defects (3-20 cm2) was also confirmed in a predictor analysis in 1 trial where a defect size >4 cm2 was predictive of better outcome with M-ACI. 59
In smaller defects, however, generally no significant differences between ACI and MFx have been observed within the first 2 years after treatment. A phase 3 clinical trial that included smaller defects (1-4 cm2) demonstrated a trend toward better overall KOOS clinical results with M-ACI compared with MFx, but superiority was not achieved at 24 months. 47 Similar results were also found in other controlled clinical studies with an ACI product in smaller defects. 35,60 Only 1 phase 2 study has demonstrated significant clinical benefits for M-ACI compared with MFx after 24 months in smaller defects, but the small sample size (21 M-ACI patients and 9 MFx patients) limits the interpretation of these results. 13 However, there is evidence from several clinical studies, systematic reviews, and meta-analyses that even with smaller and medium defect sizes, MFx loses its clinical efficacy over time which is not the case for M-ACI even in larger defects. 18,23,25,31,32
The reason underlying the inferior long-term results for MFx when compared with ACI/M-ACI is thought to relate to the poor tissue quality and degree of defect fill particularly in larger lesions. 12,44 In a meta-analysis comparing histological outcomes after different cartilage repair techniques, DiBartola et al 16 found that OAT repair tissue was primarily composed of hyaline cartilage, followed closely by repair tissue formed by cell-based techniques, while MFx was found to produce primarily fibrocartilage. The percentage change in clinical outcome and percentage of biopsies showing only hyaline cartilage were also significantly associated (R 2 = 0.24; P = .024). 16
These findings are in line with the MRI data from the current matched-pair analysis, where the MOCART sum score at 24 months (P = .0096) and over time (12-24 months; P = .0338) was significantly better in defects treated with M-ACI compared with MFx. In terms of the MOCART subscores, defect filling, integration to border zone, surface, structure, and signal intensity (reflecting the status of graft maturation), numerical differences in favor of the M-ACI regimen were noted at 24 months (statistically significant difference for signal intensity based on 3D GRE; P = .0014). These results are particularly noteworthy, as defects in the MRI subpopulation were larger in the M-ACI than in the MFx group (5.3 versus 3.3 cm2).
The meta-analysis by DiBartola et al 16 also found an effect on repair tissue quality over time. While repair tissue from ACI becomes more hyaline-like, demonstrating maturation of the tissue, the amount of fibrocartilage formed after MFx continued to increase over time but without maturation toward an improved tissue quality. In the matched-pair analysis, improvements in MOCART subscores from 12 to 24 months indicated ongoing graft/repair tissue maturation in the M-ACI group based on graft integration, signal intensity (dual T2-FSE and 3D GRE) as well as surface and structure, while repair tissue maturation from 12 to 24 months in the MFx group was less pronounced (improvement only in graft integration and dual T2-FSE signal intensity).
No significant correlations between specific MOCART parameters and KOOS change from baseline were found in the current study. Follow-up time may be an important parameter in this respect, as many studies with a shorter follow-up time (≤2 years) did not find any correlations between MRI parameters and clinical outcomes, 19,27,47 while such correlations were observed in studies with longer term follow-up of >24 months. 34,36,68 Nonetheless, good MRI results at earlier timepoints may be predictive for long-term outcome. In a clinical study with up to 17 years of follow-up (mean, 8.4 ± 3.7 years) after chondrocyte transplantation, some MRI parameters at 12 months, such as degree of defect fill, surface and signal intensity of the repair tissue, significantly correlated with durable longer-term clinical outcomes. 41
In this context, it has been shown that filling of smaller, well-shouldered cartilage defects even with non-hyaline repair tissue still improves short-term function, while the histological repair tissue quality becomes more important long term and for larger defects. 14,31,43,56 Based on this evidence, various professional societies now recommend ACI as treatment option for defect sizes starting from >2 cm2 and all larger defects (no upper limit), while MFx is only considered a treatment option for smaller defects (≤2 to 4 cm2). 9,45 Against this background, the favorable outcome for M-ACI already in the early stages of follow-up, as shown in the present study, can be explained by the fact that the defects treated in the M-ACI group (mean total defect area, 6.4 cm2; range, 4-12.5 cm2) were well within the recommended indication range for ACI, whereas those in the MFx group (mean, 3.7 cm2; range, 2-6 cm2) were in the upper range or beyond that for MFx.
However, the clearly smaller defect sizes in comparison with the M-ACI group still gave the MFx group an advantage as compared with a situation where both treatment groups would have had similar large defect sizes such as in the phase 2/3 trials for MACI, where superiority for the M-ACI product was demonstrated. 5,59 It is reasonable to assume that a larger defect size in the MFx group would have produced an even more pronounced difference between groups in favor of M-ACI. The inferior efficacy of the comparator group MFx even in those clearly smaller defects compared with the M-ACI group thus stresses the efficacy of M-ACI in large cartilage defects.
Given the superior clinical and MRI results of M-ACI compared with MFx demonstrated in this propensity score matched-pair analysis, the properties of the hydrogel-based M-ACI product used are briefly discussed here. The hydrogel in which the chondrocytes are embedded offers ideal conditions for cartilage regeneration. The initial low viscosity supports a homogeneous cell distribution as well as good ingrowth of the regenerated tissue into the defect bed. Due to the injectable nature of the hydrogel, it can be administered via mini-arthrotomy or arthroscopically without jeopardizing cell viability, which can be the case when primarily solid cell-carrier biomaterials are administered under arthroscopic conditions. 10 The adhesive properties of the hydrogel eliminate the need for additional implant fixation, making it suitable for difficult-to-reach locations and avoiding possible adverse effects of suture or fibrin glue fixation. 30,39,42 These assets also contribute to reduced surgical comorbidity and short cut-to-suture times for implantation, thereby preventing potential detrimental effects of longer operation times on articular cartilage. 46,64
Hydrogel consists of human albumin and hyaluronic acid cross-linked with bis-thiol-polyethylene glycol to form a 3D network structure. Both in vitro and in vivo experiments have shown that in the 3D cross-linked hydrogel, human chondrocytes have a chondrocyte-typical, spherical cell morphology, similar to that in hyaline cartilage, with very high viability, and that the hydrogel stabilizes the phenotype of chondrogenic cells or significantly improves the phenotype of expanded chondrocytes, respectively. 7,8,62,70 Furthermore, due to its physical properties, the hydrogel has barrier function for endothelial cell invasion, resulting in antiangiogenic and thus also antiosteogenic effects, as angiogenesis is a prerequisite for osteogenesis. 17,62 In addition, hyaluronic acid has shown molecular weight–dependent anti-inflammatory effects through a multifactorial mechanism of action via cluster determinant 44, toll-like receptor, and intercellular adhesion molecule receptor signaling. 2
Limitations
A limitation of this analysis is that covariates for PSM had to be limited in order to include as many patients as possible in the matched-pair analysis to get meaningful results. This led to some imbalances mainly in defect characteristics (eg, size, location, cause, and number of lesions). However, as discussed previously, these imbalances are not expected to have biased the interpretation of the matched-pair analysis results in favor of M-ACI. Nevertheless, it is acknowledged that MFx which is an appropriate treatment option for smaller defects does not represent a suitable comparator for M-ACI in larger defects. A more appropriate comparator would have been another M-ACI product, but no such authorized product was available in Europe at the time the studies used for PSM were initiated. Future studies may focus on comparing hydrogel-based M-ACI to other methods of treating larger cartilage defects.
Conclusion
In this propensity score matched-pair analysis, hydrogel-based M-ACI has shown KOOS and IKDC outcomes in large cartilage defects of the knee (4-12 cm2) that are superior to the outcomes of MFx in smaller defects (2-6 cm2) at 3 to 24 months of follow-up. This superiority in clinical outcome was supported by structural data showing a more pronounced increase in graft maturation between 12 and 24 months and a significantly higher MOCART score compared with MFx. Taken together, hydrogel-based M-ACI procedure represents an effective therapeutic option for larger cartilage defects.
Footnotes
Acknowledgment
The authors acknowledge the following investigators for contributing a significant number of patients to the phase 3 studies used for matching: Martin Hanus (Department of Orthopaedics and Traumatology, 2nd Faculty of Medicine, Charles University in Prague and Motol University Hospital, Prague, Czech Republic); Rimtautas Gudas (Hospital of Lithuanian University of Health Sciences, Kaunas Clinics); Juozas Belickas (Lithuanian University of Health Sciences, Ortopedijos Technika, Kaunas, Lithuania); Markas Fiodorovas and Algimantas Cebatorius (University Hospital Klaipeda, Klaipeda, Lithuania); Milan Pastucha (Department of Orthopaedics, Hospital Hořovice, Hořovice, Czech Republic); Petr Hoza (Department of Orthopaedics, Hospital Pardubice, Pardubice, Czech Republic); and Krisztián Magos (Kastélypark Clinic Hajdú, Tata, Hungary). The authors also acknowledge Siegfried Trattnig (High-Field MR Centre, Medical University of Vienna, Vienna, Austria) for the MOCART analysis; and Annette Köhler (TETEC–Tissue Engineering Technologies AG, Reutlingen, Germany) for study management.
Final revision submitted April 20, 2023; accepted May 4, 2023.
One or more of the authors has declared the following potential conflict of interest or source of funding: The clinical trials and the matched-pair analysis were funded by TETEC–Tissue Engineering Technologies. P.N. has received grants and education payments from Arthrex, CO.DON, Geistlich, Medi, Plasmaconcept, Stryker, and TETEC–Tissue Engineering Technologies. P.A. has received consulting fees from and holds a professorship sponsored by Aesculap Biologics. R.C.S. is an employee of Aesculap Biologics. A.K. and C.G. are employees of TETEC–Tissue Engineering Technologies. AOSSM checks author disclosures against the Open Payments Database (OPD). AOSSM has not conducted an independent investigation on the OPD and disclaims any liability or responsibility relating thereto.
Ethical approval for this study was obtained from University of Regensburg and the Bavarian State Medical Association.