
Abstract
Background:
Patellar tendinopathy (PT) mainly affects athletes who use the tendon for repeated energy storage and release activities. It can have a striking impact on athletes’ careers, although data on its real prevalence and incidence are sparse. Research efforts should start from the results of reliable and updated epidemiological research to help better understand the impact of PT and underpin preventative measures.
Purpose:
To determine the prevalence and incidence of PT in athletes and the general population.
Design:
Systematic review; Level of evidence, 3.
Methods:
A systematic review of the literature was performed on January 17, 2022, and conducted according to the PRISMA (Preferred Reporting Items for Systematic Reviews and Meta-Analyses) guidelines. The PubMed, Web of Science, and Wiley Cochrane Library databases were searched for epidemiological reports of any evidence level and clinical studies reporting data on the incidence or prevalence of PT for the 11,488 retrieved records. The primary endpoint was the prevalence and incidence of PT in sport-active patients. The secondary endpoints were PT prevalence and incidence in subgroups of athletes based on sex, age, sport type, and sport level played, as well as the same epidemiological measures in the general population.
Results:
A total of 28 studies, with 28,171 participants, were selected and used for the qualitative and quantitative analysis. The general and athletes’ populations reported an overall PT prevalence of 0.1% and 18.3%, respectively. In athletes, the prevalence of PT was 11.2% in women and 17% in men (P = .070). The prevalence of PT in athletes <18 years was 10.1%, while it was 21.3% in athletes ≥18 years (P = .004). The prevalence of PT was 6.1% in soccer players, 20.8% in basketball players, and 24.8% in volleyball players. Heterogeneous PT diagnostic approaches were observed. Higher prevalence values were found when PT diagnoses were made using patient-reported outcomes versus clinical evaluations (P = .004).
Conclusion:
This review demonstrated that PT is a common problem in the male and female sport-active populations. There are twice as many athletes aged ≥18 years than there are <18 years. Volleyball and basketball players are most affected by PT.
Patellar tendinopathy (PT) is the clinical presentation of pain and associated dysfunction in people with underlying tendon pathology. 17,18 Athletes 7,15,41 who use the tendon for repeated elastic energy storage-and-release activities (eg, jumping and changing directions) 30,48 are affected by PT; therefore, the condition is frequently labeled “jumper’s knee.” 4 A sudden or chronic load increase relative to the baseline patellar tendon’s capacity to tolerate load causes the onset of symptoms. 22,70 Hence, PT is a tendon degenerative pathology that is thought to be due to structural overuse. PT can have a striking impact on athletes’ careers. Up to one-third of the diagnosed players are unable to return to sports for >6 months, 11 and more than half discontinue sports participation. 43
The diagnosis of PT is complex, as there are no gold standard tests. However, structural disorganization on imaging shows pathology that may not be linked to symptoms. 23 Diagnostic tests can provoke pain but the source of the pain can be in many structures. 44 Correct diagnosis requires good clinical understanding and skills. 53 Overall, research efforts should pursue better data to improve the understanding of tendinopathy and its management. van Mechelen et al 73 called for action in managing sports injuries starting from the need for epidemiological research to underpin preventative measures. Describing the extent of the sports injury problem to understand its impact and the type of patients involved can favor more effective PT management. Accordingly, a comprehensive and updated epidemiological meta-analysis on PT could provide key data as a foundation for the future development of more targeted interventions and a better understanding of the pathology.
This review aimed to determine the prevalence and incidence of PT in athletes and the general population. The hypothesis was that PT would be a common pathology with varying prevalence depending on the type of patients.
Methods
Search Strategy
A review protocol was developed and registered on the International Prospective Register of Systematic Reviews (CRD42021253503). We searched the PubMed, Web of Science, and Wiley Cochrane Library databases on January 17, 2022, using the following keywords for initial screening: “patellar AND tendon AND (tendinopath* OR tendonitis OR tendinosis OR rupture OR lesion OR injur*).” The PRISMA (Preferred Reporting Items for Systematic Reviews and Meta-Analyses) guidelines were followed. 58 No limitations based on the publication time were made.
Study Selection and Data Extraction
Two authors (C.M.T.L., S.N.) selected the studies independently and removed duplicate studies. First, all titles and abstracts were screened for epidemiological reports regarding PT (any evidence level) and clinical studies reporting data on PT incidence or prevalence that were written in English. Animal studies and reviews were excluded. Then, the articles that met the inclusion criteria were screened for full-text eligibility with further exclusions according to the previously described parameters. In case of disagreement between the 2 reviewers, a third reviewer (L.D.) was consulted. Studies reporting PT diagnosis via clinical assessments and/or patient-reported outcomes (PROs) were included, whereas studies in which the diagnosis was only based on diagnostic imaging were excluded.
The following data were then extracted from eligible articles: title, first author, year of publication, journal, type of study, level of evidence, population characteristics, sports, level of activity, incidence, prevalence, and diagnostic method.
Primary and Secondary Outcomes
The primary outcome of this review and meta-analysis was the prevalence and incidence of PT sport-active patients. The secondary outcomes were PT prevalence and incidence in subgroups of athletes based on sex, age, type of sport, and level of sport played, as well as the same epidemiological measures in the general population.
Assessment of Risk of Bias and Quality of Evidence
All studies were evaluated according to the level of evidence using previously published criteria. 65 To establish potential bias in the selected studies from the protocol research, 2 reviewers (C.M.T.L, S.N.) independently assessed the methodological quality of each study using the Newcastle-Ottawa Scale (NOS) 51 for cohort studies and nonrandomized studies and the Appraisal tool for Cross-Sectional Studies (AXIS) 26 for cross-sectional studies. The Grading of Recommendations Assessment, Development and Evaluation (GRADE) guidelines 37 were considered to grade the overall quality of evidence for each outcome. However, the GRADE was discarded because of its poor applicability to epidemiological studies. The opportunity to use a modified version of the GRADE was not pursued either, as this could entail the risk of overestimating the quality of evidence for observational studies. Risk of bias (RoB) and quality of evidence were independently assessed for all outcomes by 2 authors (C.M.T.L., S.N.), and interrater reliability was calculated. A third author (L.D.) resolved any discrepancies.
Statistical Analysis
Among the studies, the comparisons of PT prevalence and incidence overall and by subgroups were based on the Z test with Bonferroni correction for multiple comparisons. A statistical analysis and a forest plot were performed according to Neyeloff et al. 61 The Mantel-Haenszel method 36,54 was used to evaluate the expected value. The Wilson confidence interval was preferred because of the limited data, either due to low event rates or small sample sizes, and because of the poor estimates of the standard errors of the effect used in the inverse variance methods. The interrater reliability of the RoB analysis was performed using the Cohen kappa.
Statistical heterogeneity was evaluated by the I 2 statistic and Cochran Q. For outcomes of low heterogeneity (I 2 < 25%), the estimation of the expected value and its 95% CI was based on fixed-effects analysis of variance; otherwise, the random-effects model was used. The statistical significance was set at P ≤ .05.
Results
Study Selection and Characteristics
The database search identified 11,488 records, 2247 of which were duplicates. Of the remaining 8664, a total of 107 full-text articles considered suitable for inclusion were assessed for eligibility after a preliminary title and abstract screening. However, 82 further articles did not fulfill the inclusion criteria and were excluded, while 3 more studies were added through a manual search of the reference lists of the included articles, leading to a total of 28 studies ¶ used for the qualitative and quantitative analysis (Figure 1). All of the included articles were published between 1986 and 2021. The primary characteristics of the selected studies are reported in Table 1.

PRISMA (Preferred Reporting Items for Systematic Reviews and Meta-Analyses) flowchart of the study selection process. PT, patellar tendinopathy.
Primary Characteristics of the Selected Studies a
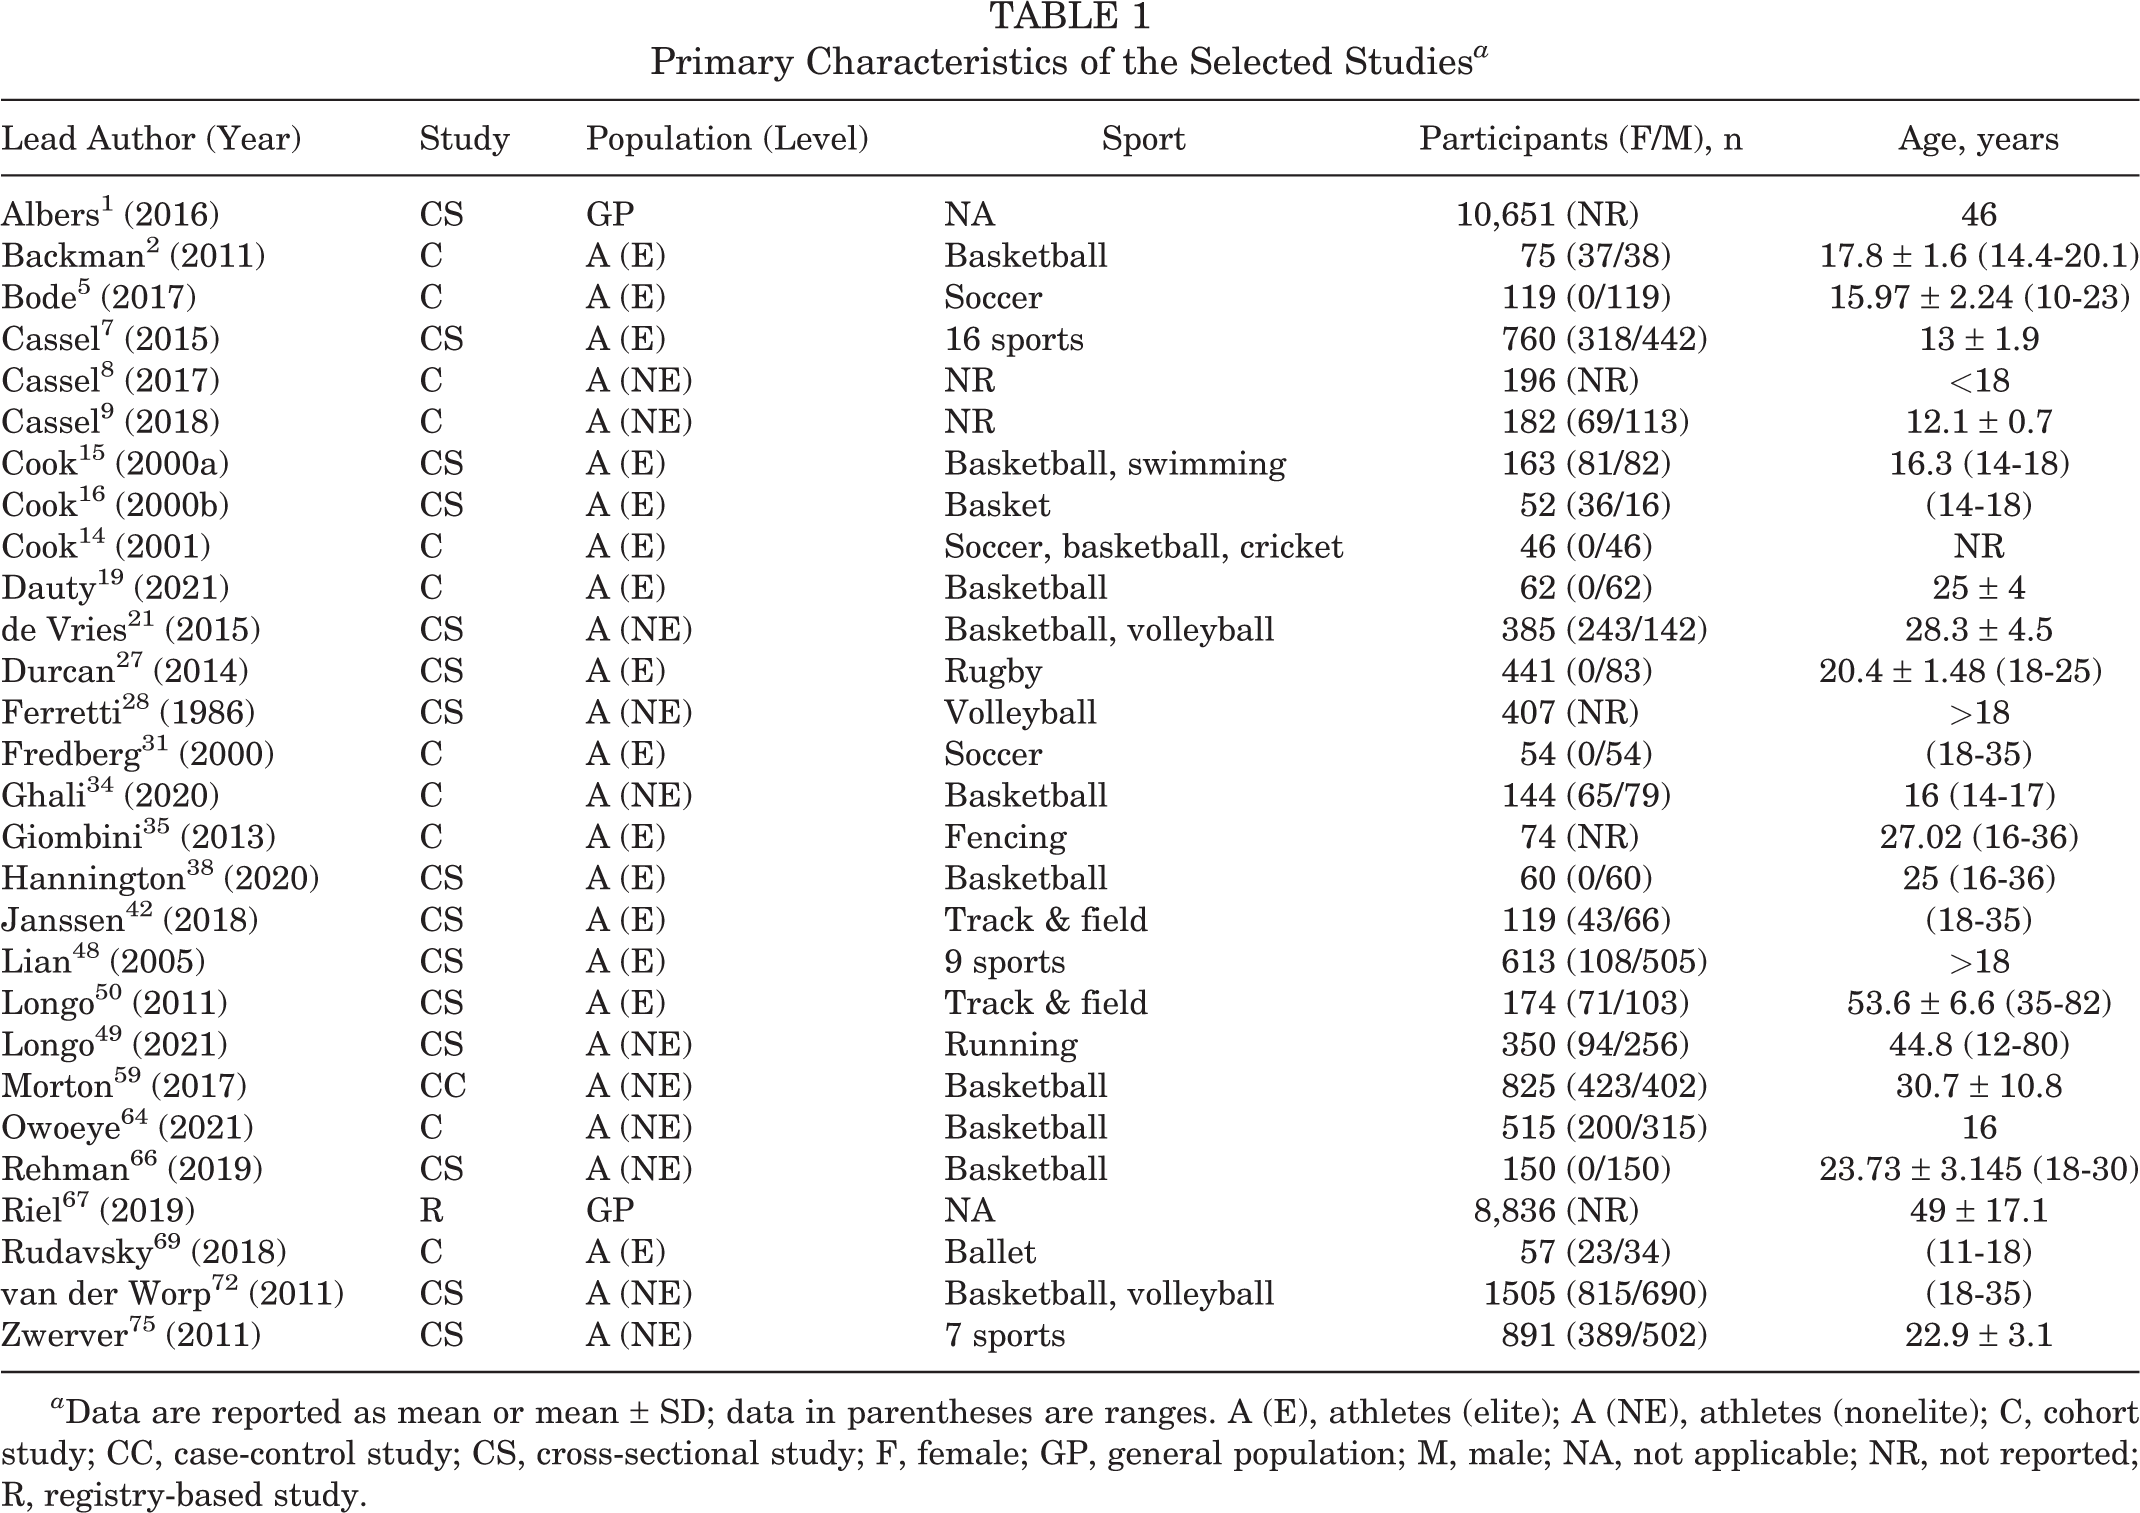
a Data are reported as mean or mean ± SD; data in parentheses are ranges. A (E), athletes (elite); A (NE), athletes (nonelite); C, cohort study; CC, case-control study; CS, cross-sectional study; F, female; GP, general population; M, male; NA, not applicable; NR, not reported; R, registry-based study.
Of the selected studies, 11 were cohort studies, # 2,5,8,9,14,19,31,34,35,64,69 and 15 were cross-sectional studies. ** One study was a case-control study, 59 and 1 was a registry-based study. 67 The majority of the studies (n = 24) focused on athletes, while only 2 studies were conducted in the general population. 1,67 See Figure 2 for the geographical distribution of the retrieved studies.
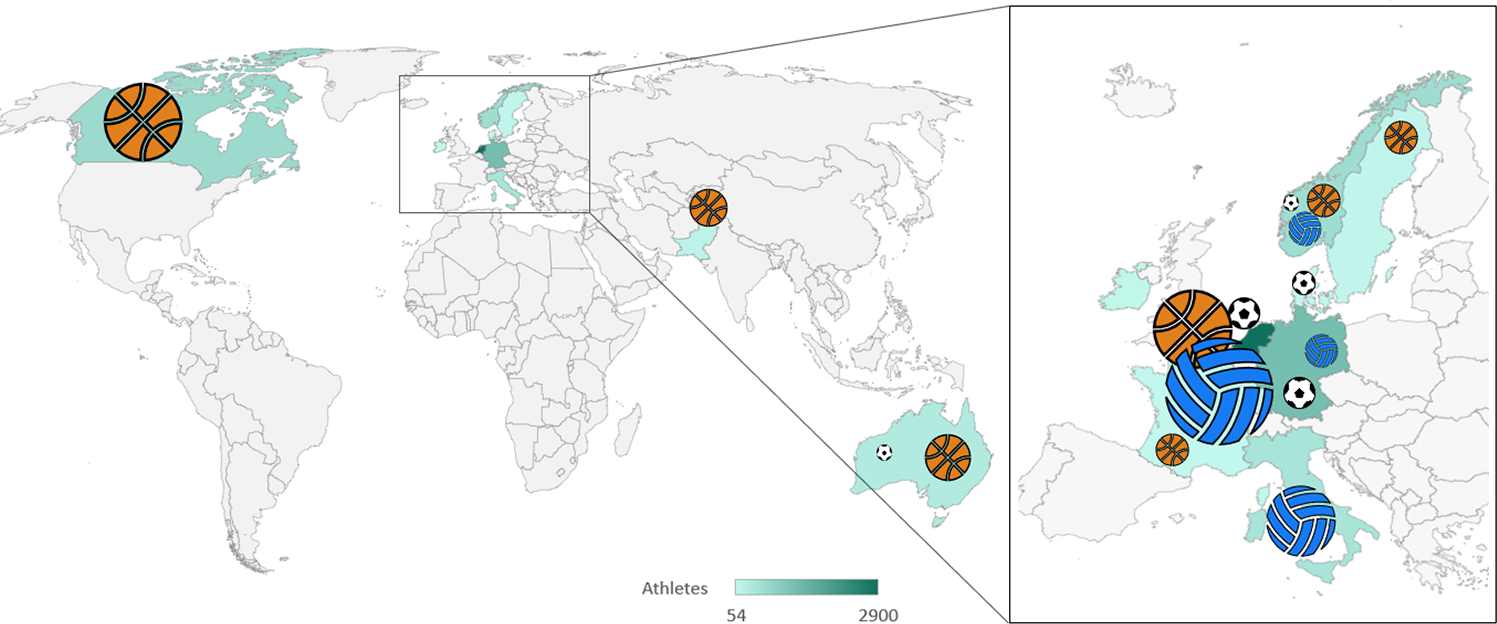
Geographical distribution of the participants in the included studies, with an indication of the type of sport played.
Population Characteristics
A total of 28,171 participants were enrolled in the 28 studies, of whom 8684 were athletes and 19,487 were nonathletes. There were 4810 men and 3051 women, with an age range of 10 to 82 years, in the studies that specified the participants’ sex. Among the sport-active patients, 1840 basketball players, 1915 volleyball players, and 267 soccer players were included.
Athletes
A PT prevalence of 18.3% (95% CI, 14.6-22.1) was reported in 20 studies, †† whereas 7 studies 8,9,14,16,31,35,69 revealed a PT incidence of 7% (95% CI, 3.9-10) in the athlete population.
Subgroup Analysis in Athletes
Sex
The PT prevalence was 11.2% (95% CI, 7-15.4 [10 studies ‡‡ ]) in women, whereas it was 17% (95% CI, 13-20.9 [14 studies §§ ]) (P = .070) in men.
Two studies 14,31 showed a 7.5% PT incidence in men (95% CI, 2.2-12.9). The incidence in women could not be calculated because of insufficient data.
Age
Five studies 7,8,15,34,64 revealed that the PT prevalence was 10.1% (95% CI, 5.7-14.5) in those <18 years, whereas it was 21.3% (95% CI, 15.9-26.7 [11 studies ∥∥ ]) (P = .004) in those ≥18 years. Three studies 8,9,16 showed an 8.4% PT incidence in participants <18 years (95% CI, 2.4-14.3), and a meta-analysis of 2 studies 31,69 found a 6.8% incidence in participants ≥18 years (95% CI, 2-11.7) (P = .370).
Type of Sports Played
The PT prevalence differed across sports. The PT prevalence was 6.1% (95% CI, 0.7-11.6 [3 studies 17,59,75 ]) in soccer players, 20.8% (95% CI, 15.0-26.5 [11 studies ¶¶ ]) in basketball players, and 24.8% (95% CI, 17.8-31.8; [5 studies 28,48,59,72,75 ]) in volleyball players. There was a difference in prevalence between basketball and soccer (P = .006) as well as between volleyball and soccer (P = .0002). No statistically significant difference in PT prevalence was evident in basketball and volleyball (P = .796). Additionally, a meta-analysis of 2 studies showed a 6% PT incidence in soccer players (95% CI, 0.7-11.2).
Level of Sport
The PT prevalence in elite athletes was 16.7% (95% CI, 11.2-22.1 [10 studies ## ]) and 19.9% (95% CI, 14.8-24.9 [10 studies a ]) in nonelite athletes (P = .341). The PT incidence was 5.5% (95% CI, 2.8-8.2 [5 studies 14,16,31,35,69 ]) in elite athletes and 7.5% (95% CI, 0.2-14.8 [2 studies 8,9 ]) (P = .349) in nonelite athletes. A pooled estimate for PT prevalence in elite basketball players was 18.9% (95% CI, 14.5-23.3 [5 studies 2,15,19,38,48 ]) and 19.7% (95% CI, 11.7-27.7 [6 studies 34,59,64,66,72,75 ]) (P = .361) in nonelite basketball players. Last, a meta-analysis of 4 studies 29,59,72,75 showed a 22.5% prevalence in nonelite volleyball players (95% CI, 15.9-25.1) (Figure 3). Further meta-analyses were not possible with the available data.

Prevalence of PT per level (elite/nonelite athletes) of sport participation for basketball, volleyball, soccer, and other sports. The magnified PT prevalence for each group is in gray. PT, patellar tendinopathy.
General Population
The PT prevalence was 0.1% (95% CI, 0.1-0.2 [2 studies 1,67 ]) and the incidence was 0.1% (95% CI, 0.0-0.2 [2 studies 1,67 ]) in the general population. The athletes had a higher PT prevalence and incidence (P < .0005).
Sensitivity Analysis by PT Diagnostic Method
Prevalence
There was an overall PT prevalence of 18.3% in the athlete population. The studies used variable combinations of clinical examination, PROs, diagnostic imaging (ultrasound, magnetic resonance imaging [MRI], radiographs, or Doppler ultrasound), self-administered pain map, online questionnaires or interviews, and the single-leg decline squat (SLDS) functional test. When the PT diagnosis was based on a clinical evaluation by either a qualified physician or a physical therapist, the prevalence was 12.1% (95% CI, 7.6-16.7 [7 studies 2,5,7,8,15,21,28 ]). A PT diagnosis made via PROs resulted in a prevalence of 25.4% (95% CI, 15.3-35.4 [6 studies 19,34,38,64,66,75 ]). A PT diagnosis based on the combination of a clinical examination and PROs showed a prevalence of 20.4% (95% CI, 14.7-26.0 [7 studies 27,42,48 –50,59,72 ]).
There was a statistically significant difference between PT diagnoses made using PROs versus clinical evaluations (P = .004), with the latter having lower values. No statistically significant between-group differences emerged for PT diagnoses formulated via a clinical evaluation only versus a combination of a clinical examination and PROs (P = .205), as well as for PROs versus a combination of a clinical examination and PROs (P = .631). The classification of the PT diagnostic methods in the included studies is reported in Table 2.
Summary of Diagnostic Methods for Patellar Tendinopathy in the Included Studies a

a Dashes indicate areas not applicable. X, indicates that specific diagnostic method was used in the studies. CSAS, Cincinnati Sports Ability Scale; DUS, Doppler ultrasound; Fct test, functional test; MRI, magnetic resonance imaging; Online Q/I, online questionnaire/interview; OSTRC, Oslo Sports Trauma Research Centre overuse injury questionnaire; OSTRC-P, Oslo Sports Trauma Research Centre-patellar tendinopathy questionnaire; PRO, patient-reported outcome; SLDS, single-leg decline squat; US, ultrasound; VISA-P, Victorian Institute of Sport Assessment–Patella.
Incidence
The 7% PT incidence previously reported in athletes was found with the PT diagnosis formulated through a heterogeneous combination of clinical examination, PROs, diagnostic imaging (ultrasound, MRI, or Doppler ultrasound), and SLDS. A meta-analysis of 5 studies 8,9,14,31,35 reporting a PT diagnosis made based on a clinical evaluation by a qualified clinician showed an incidence of 6.3% (95% CI, 2.8-9.9). Further meta-analyses were not possible.
Risk of Bias, Level of Evidence, and Heterogeneity
The overall interrater reliability was κ = 0.962 for both the NOS and the AXIS, indicating excellent agreement. Regarding the 11 cohort studies and 1 nonrandomized (case-control) study, the RoB assessed with the NOS indicated medium quality for 10 studies, b high quality for 1 study, 9 and low quality for 1 study 59 (Table 3). Regarding the 16 cross-sectional studies, c the RoB assessed with the AXIS resulted in a minimum score of 70% (14 out of 20 [range, 14-20]) in 9 studies, d indicating high quality, whereas the remaining studies were of low quality (Table 4).
NOS Risk-of-Bias Assessment for Cohort, Registry-Based, and Nonrandomized Studies a
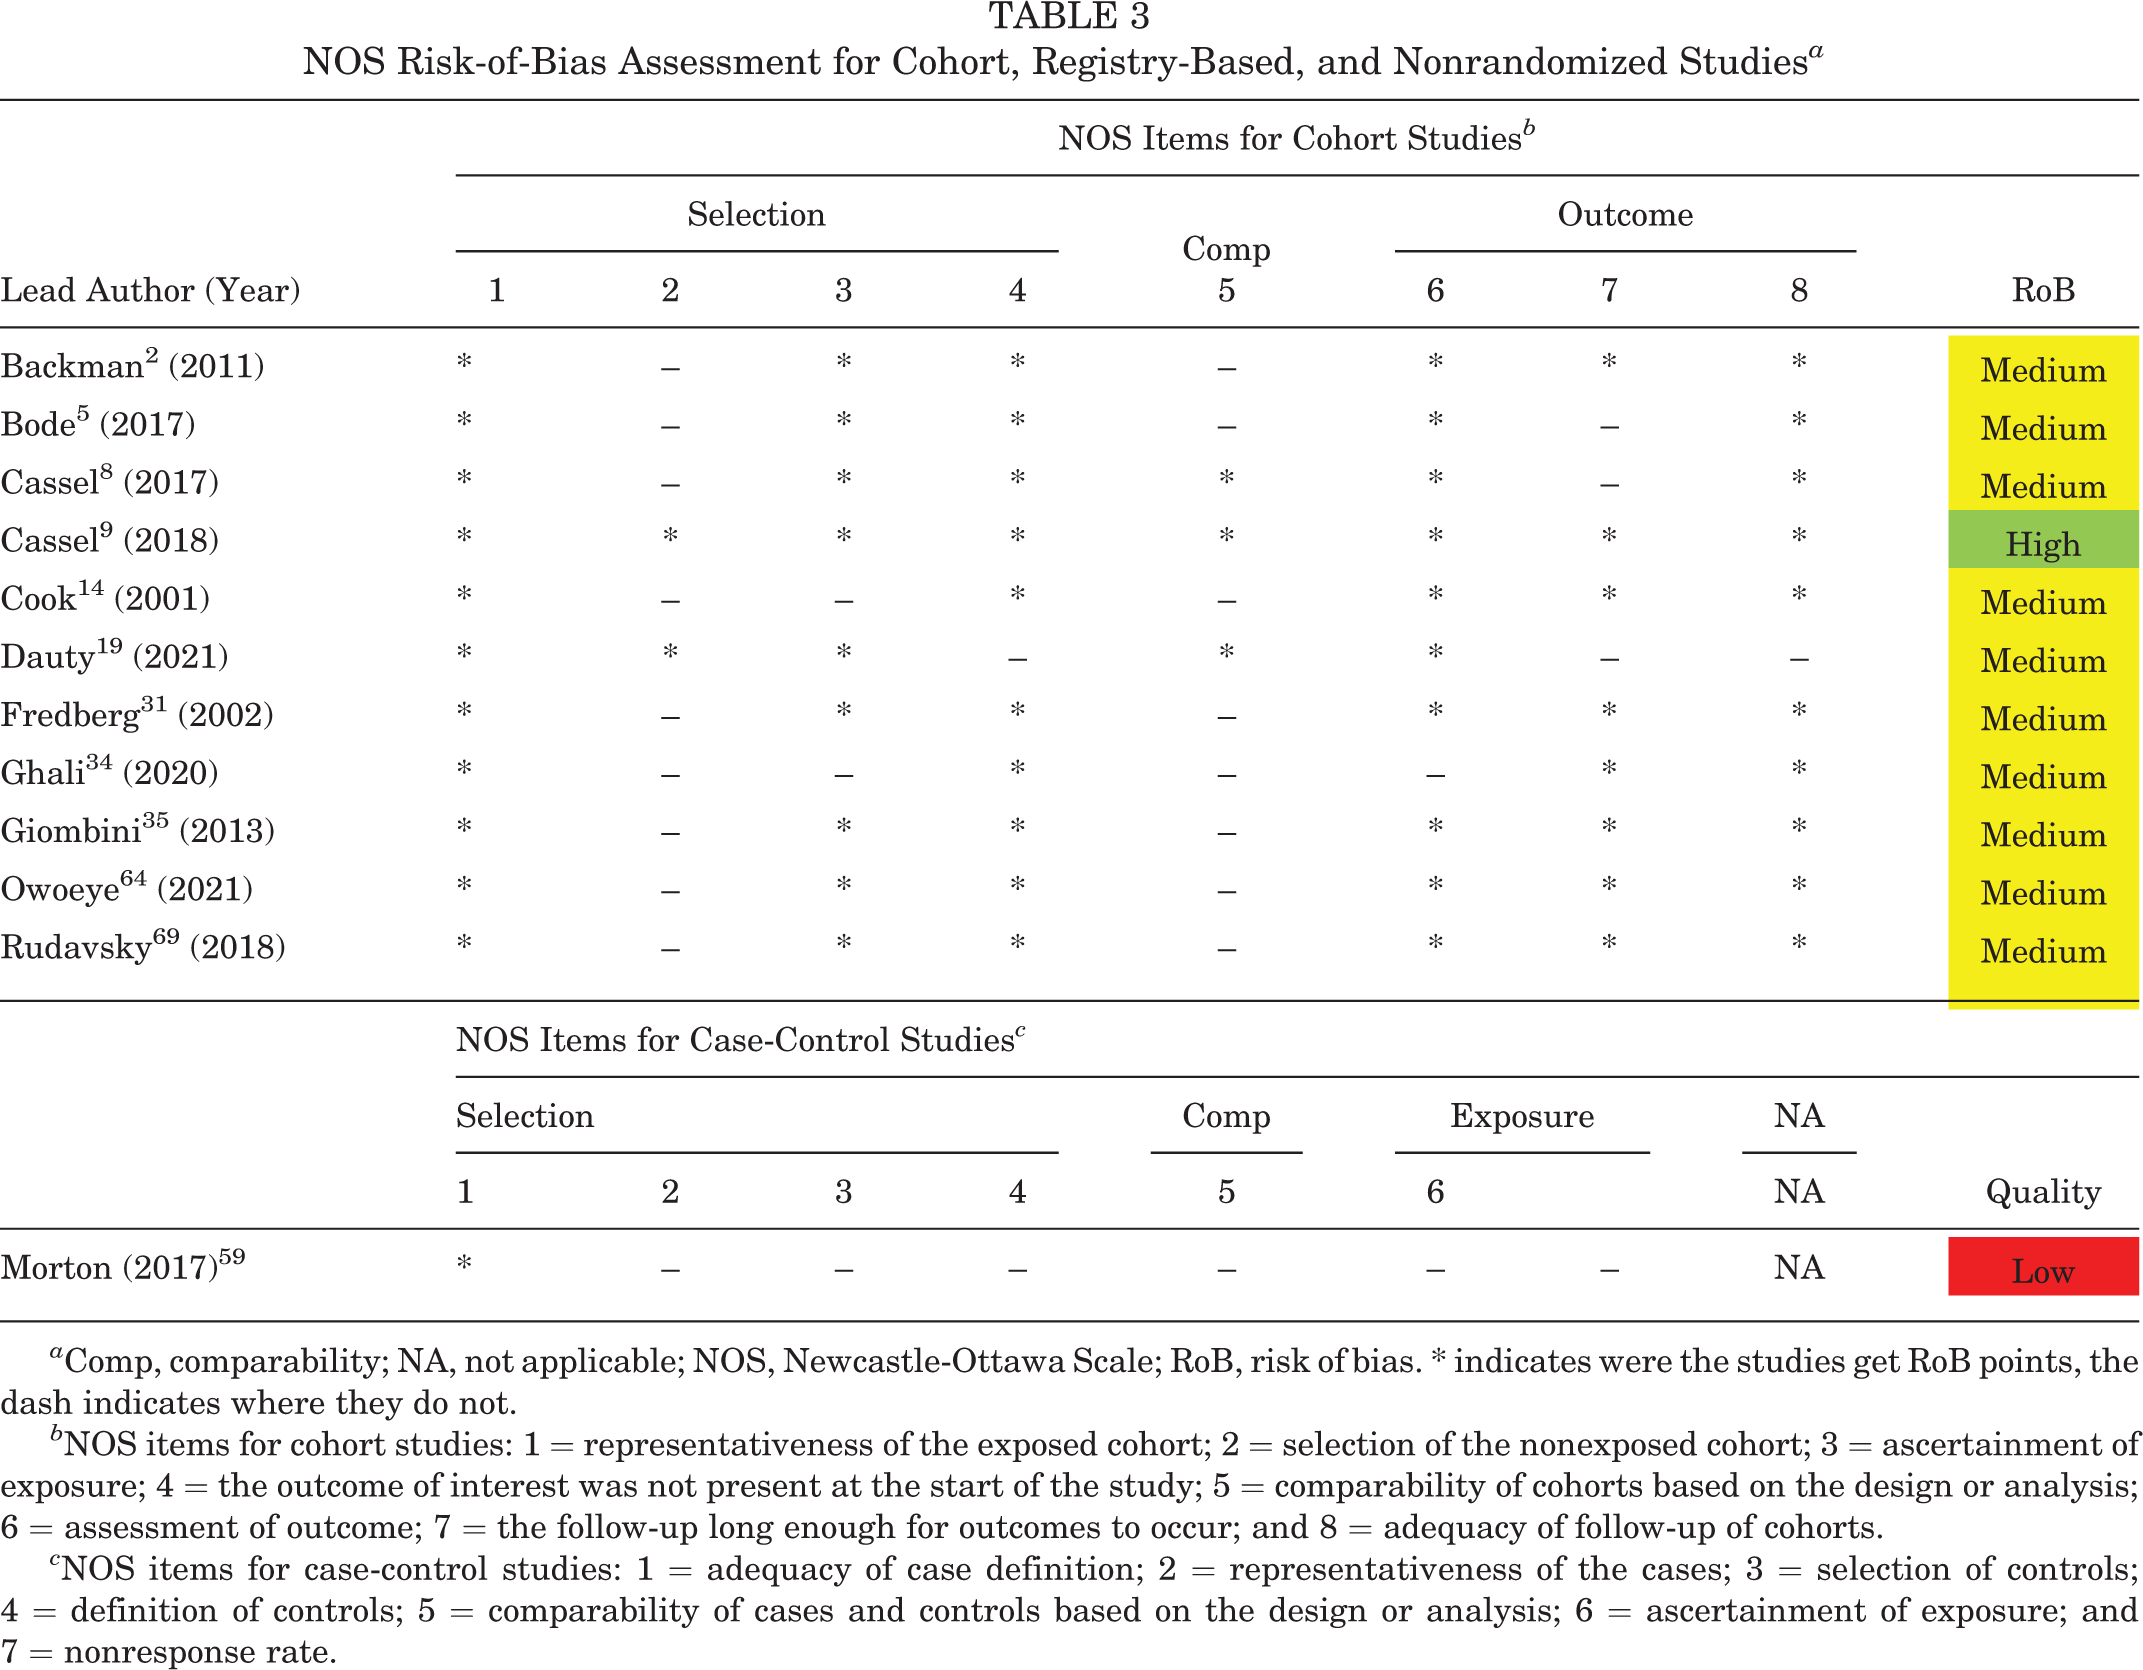
a Comp, comparability; NA, not applicable; NOS, Newcastle-Ottawa Scale; RoB, risk of bias. * indicates were the studies get RoB points, the dash indicates where they do not.
b NOS items for cohort studies: 1 = representativeness of the exposed cohort; 2 = selection of the nonexposed cohort; 3 = ascertainment of exposure; 4 = the outcome of interest was not present at the start of the study; 5 = comparability of cohorts based on the design or analysis; 6 = assessment of outcome; 7 = the follow-up long enough for outcomes to occur; and 8 = adequacy of follow-up of cohorts.
c NOS items for case-control studies: 1 = adequacy of case definition; 2 = representativeness of the cases; 3 = selection of controls; 4 = definition of controls; 5 = comparability of cases and controls based on the design or analysis; 6 = ascertainment of exposure; and 7 = nonresponse rate.
AXIS Risk-of-Bias Assessment for Cross-sectional Studies a
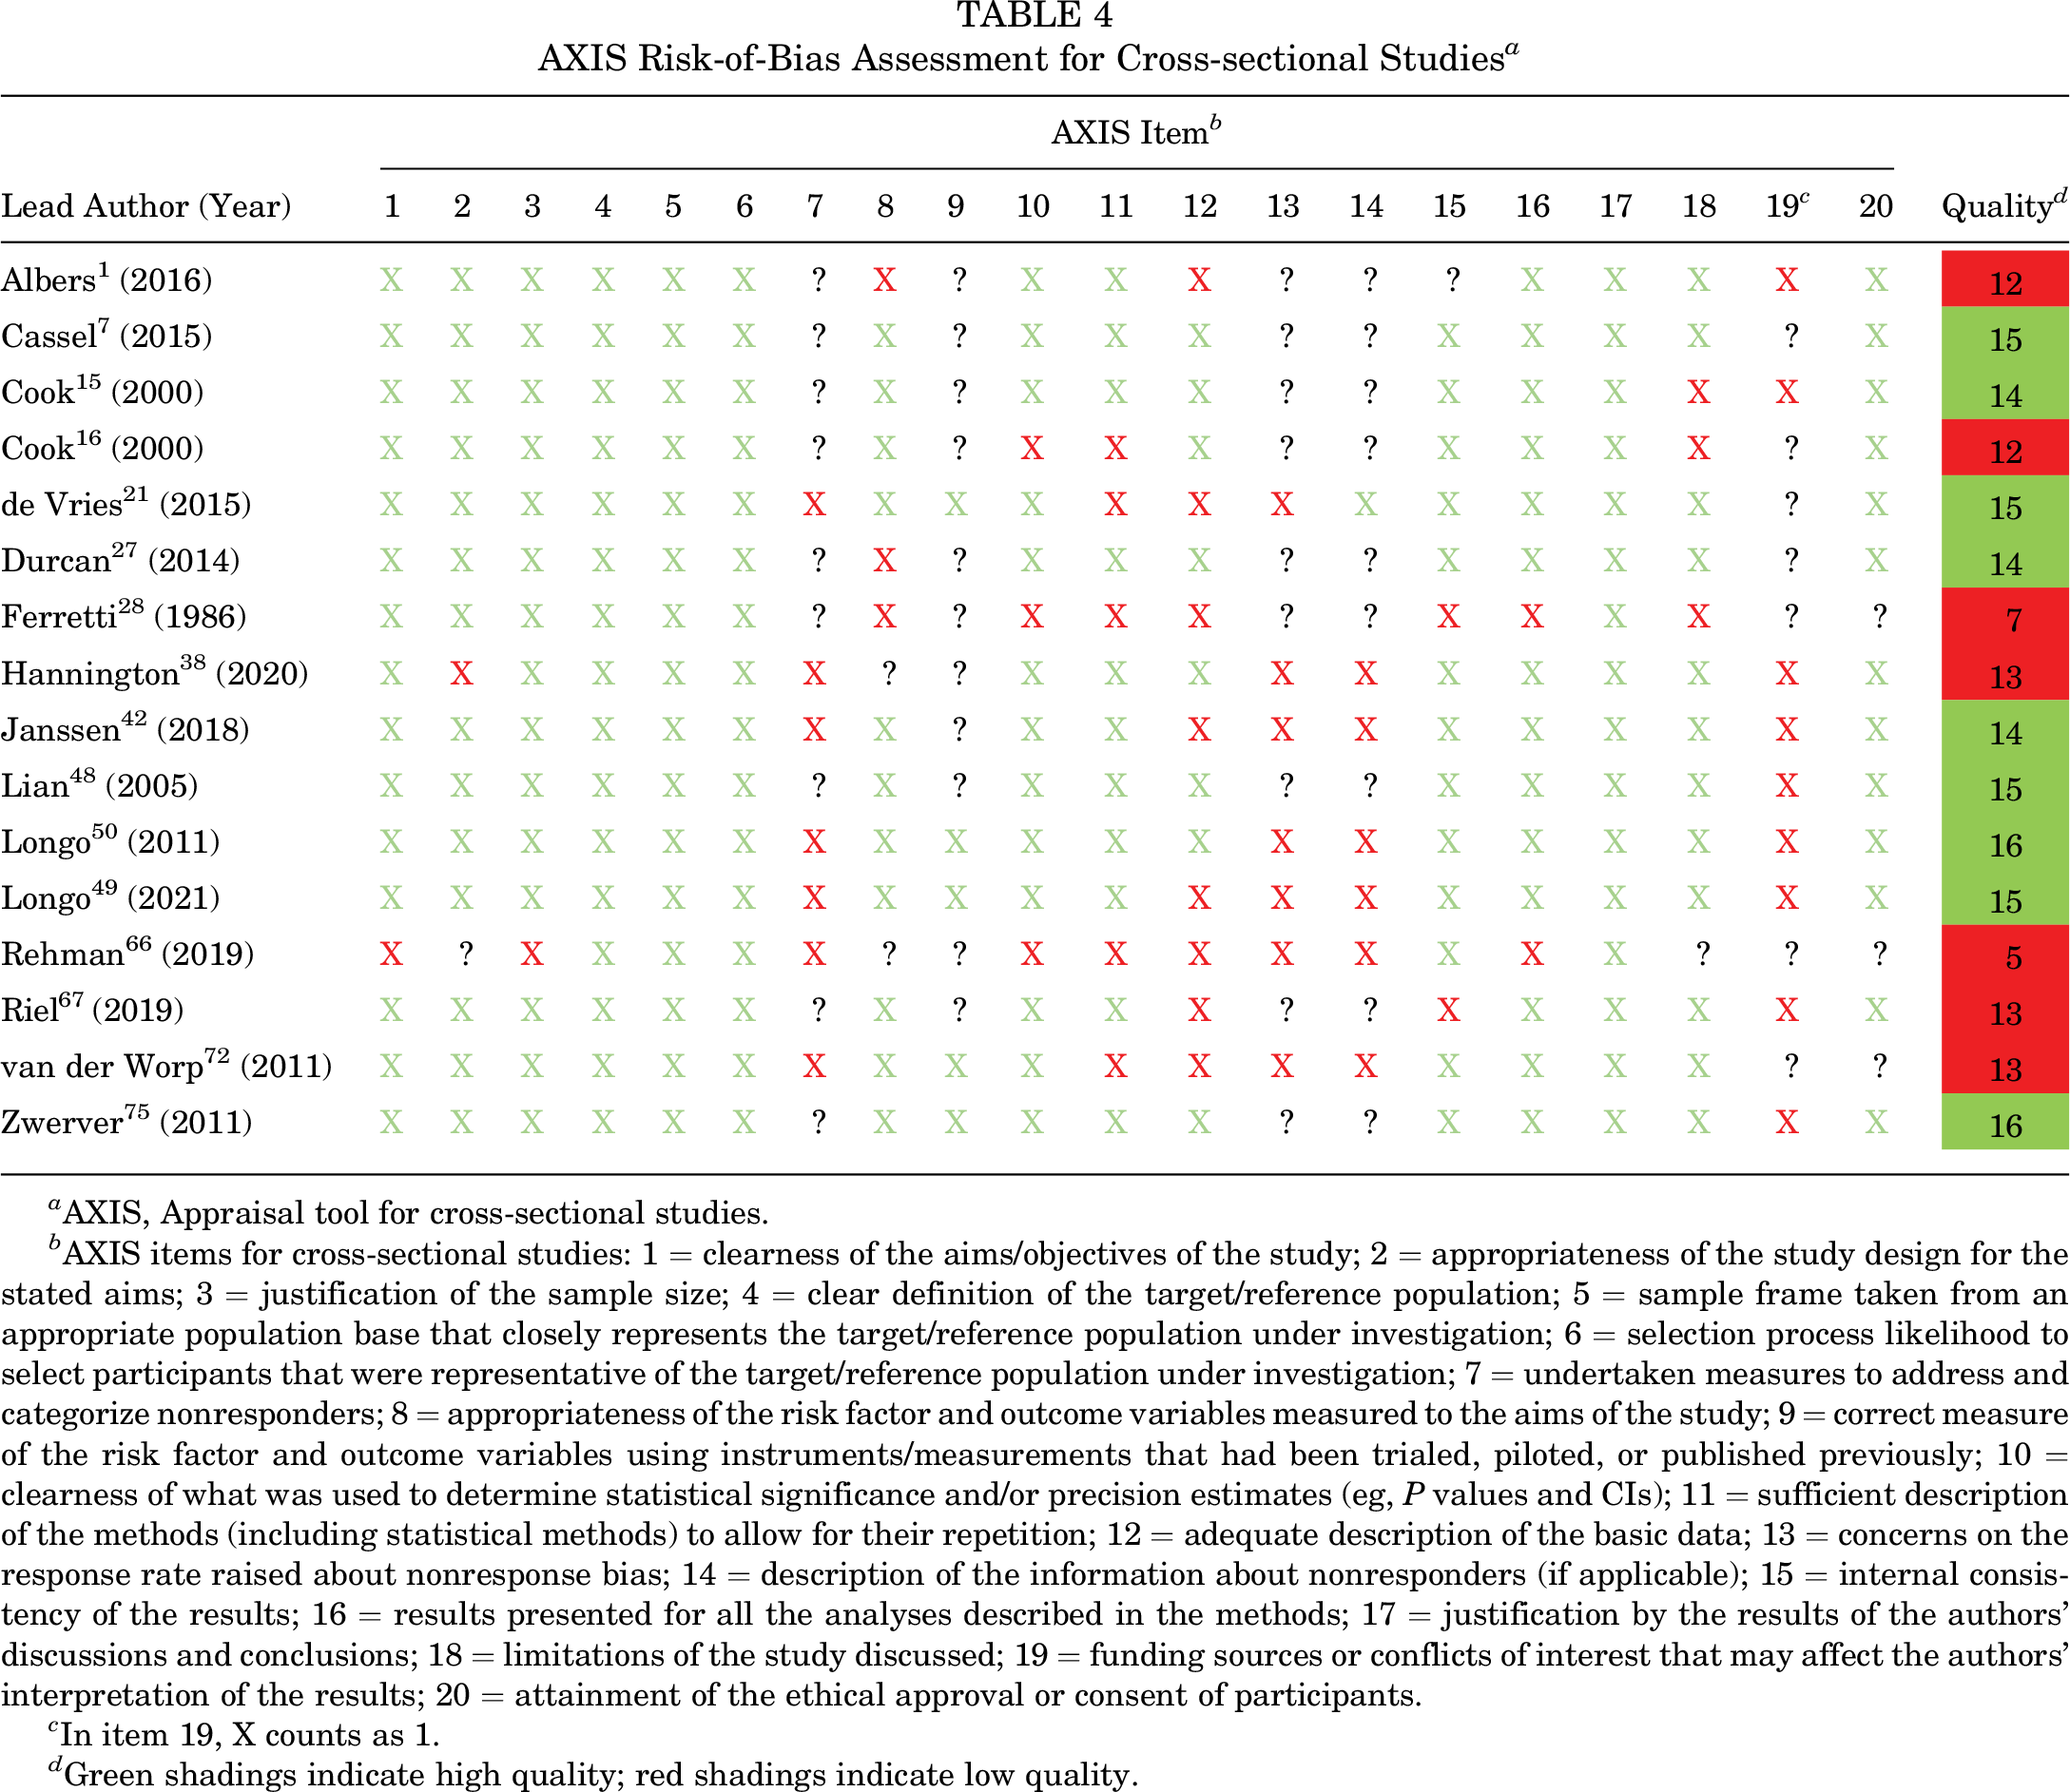
a AXIS, Appraisal tool for cross-sectional studies.
b AXIS items for cross-sectional studies: 1 = clearness of the aims/objectives of the study; 2 = appropriateness of the study design for the stated aims; 3 = justification of the sample size; 4 = clear definition of the target/reference population; 5 = sample frame taken from an appropriate population base that closely represents the target/reference population under investigation; 6 = selection process likelihood to select participants that were representative of the target/reference population under investigation; 7 = undertaken measures to address and categorize nonresponders; 8 = appropriateness of the risk factor and outcome variables measured to the aims of the study; 9 = correct measure of the risk factor and outcome variables using instruments/measurements that had been trialed, piloted, or published previously; 10 = clearness of what was used to determine statistical significance and/or precision estimates (eg, P values and CIs); 11 = sufficient description of the methods (including statistical methods) to allow for their repetition; 12 = adequate description of the basic data; 13 = concerns on the response rate raised about nonresponse bias; 14 = description of the information about nonresponders (if applicable); 15 = internal consistency of the results; 16 = results presented for all the analyses described in the methods; 17 = justification by the results of the authors’ discussions and conclusions; 18 = limitations of the study discussed; 19 = funding sources or conflicts of interest that may affect the authors’ interpretation of the results; 20 = attainment of the ethical approval or consent of participants.
c In item 19, X counts as 1.
d Green shadings indicate high quality; red shadings indicate low quality.
Out of 26 outcomes obtained from the pooled data in this meta-analysis, 23 had an I 2 of >25%; therefore, the random-effects analysis of variance was used.
Discussion
The most important finding of this review was the quantification of an overall PT prevalence of 18.3% in the sport-active population, with volleyball and basketball players being the most affected by PT. Also, PT epidemiology varied by age, with a prevalence of 10.1% in younger athletes and doubling to 21.3% in older athletes. 57 A different scenario was found in the general population, with a PT prevalence and incidence of only 0.1%.
The PT epidemiology literature is heterogeneous depending on participant factors such as sex, age, type of sport, and level of sport. Studies were also focused on 1 aspect of PT, whether in a single sport (eg, volleyball players) 29 or on specific aspects, including associated tendon structural changes, 25,55,56,62 jump-landing kinematics, 20 and sensory and motor deficits. 40 In this meta-analysis, differences in age, sex, and sport activity level were investigated, and the impacts of PT in both the general population and sport-active patients were comprehensively analyzed and quantified.
A sex-based difference in PT prevalence was not evident, with 11.2% and 17% in female and male athletes, respectively. Only 10 of the included studies reported PT epidemiological data for women. This highlights the limited available literature, indicating that more research is required. Several studies reported that men active in sports were more likely to have PT, with findings from nonelite level, 75 elite level, 48 and jumping sports athletes. 221 In contrast, other studies 59 reported that nonelite physically active women were more prone to PT. These sex-based discrepancies may depend on the different sports and physical stress/loading on the patellar tendon but possibly also on the interaction of these factors with sex-specific physiological and etiopathological differences. A complex interaction between tendon load and the ability of the tendon to respond to the applied load and the development of symptoms may be complicated by the role of endogenous and nonendogenous sex hormones. These could affect the biomechanical properties, 10,39,46,63 leading to a suboptimal load response and ultimately the development of symptoms.
With respect to the level of sports participation, nonelite athletes showed a 19.9% prevalence and a 7.5% incidence, while elite athletes showed a 16.7% prevalence and a 5.5% incidence. Elite athletes have been reported to have more PT compared with nonelite athletes. Previous studies showed a 46.5% prevalence in master track and field athletes 50 and a 21.7% prevalence in basketball players. 38 However, regarding the prevalence in nonelite athletes, studies reported a 62% prevalence in basketball players, 66 a 27.43% prevalence in runners participating in a city marathon, 49 a 23.39% prevalence in active athletes practicing different sports, 59 and a 22.85% prevalence in volleyball players. 29 Elite athletes are exposed to an overall higher load volume and are at risk for developing PT. 71 At the same time, they train most days, building a higher tendon load capacity. 12 Continuous training sessions and competitions that are adequately planned in a progressive fashion 6 build the tendon’s sport-specific capacity to withstand the demands of training and competition. 32 In nonelite settings with a less planned training progression, amateur and semiprofessional athletes may be more exposed to load spikes, leading to a higher rate of PT. 33
The type of load influences the onset of this condition. There was a 6.1% PT prevalence in soccer players, a 20.8% prevalence in basketball players, and a 24.8% prevalence in volleyball players. This high rate of PT in jumping sports is because of the repetitive takeoffs and landings characterized by a high number of stretch-shortening cycles in the patellar tendon. 3,16,29,48 The low levels in the general population can be explained by the low levels of tendon load.
There was heterogeneity in how the PT diagnosis was made. Studies diagnosed PT through either a single or a variable combination of the following parameters: clinical examination by qualified clinicians; PROs; diagnostic imaging; self-administered pain maps; online questionnaires or interviews, SLDS; or patients diagnosed with PT based on registries. PT is reported to be diagnosed clinically by painful palpation at the patellar inferior pole with an extended knee that reduces flexion. 30,53 Pain is load-dependent, especially exacerbated by jumps and changes of directions; hence, activities involve the store and release of elastic energy in tendons. 30 Frequently, the clinical diagnosis is made in association with imaging (ultrasound, Doppler ultrasound, or MRI) that identifies tendon structural degeneration and/or increased microvascularisation. 68,74 However, asymptomatic tendons can either show structural abnormalities on imaging or not. 13,47,52 Diagnostic imaging is not able to identify pain; therefore, imaging alone cannot be considered the gold standard to diagnose PT. 23 In some studies, PT diagnoses were made using validated PROs and/or SLDS functional tests that elicited symptoms commonly associated with PT. 53 Since such variability of methods to diagnose PT could have introduced false positive and/or negative diagnoses, a sensitivity analysis was performed considering the PT diagnostic methods. The PT prevalence was 12.1% in studies in which the diagnosis was based on a clinical evaluation, whereas the PT prevalence was 25.4% (P = .004) in studies with the diagnosis based on PROs only. Therefore, PROs alone carry a risk of overdiagnosis. Additionally, recent studies showed limited evidence for the clinimetric properties of the frequently utilized Victorian Institute of Sport Assessment–Patella questionnaire, affecting its validity in diagnosing PT. 45
The phases of a sports season could change the PT prevalence. Studies that reported a higher mean monthly prevalence of PT during the preseason compared with the competitive season, 24 highlighted methodological issues in capturing these injuries. The literature demonstrates the consequences of training and competition interruptions in terms of an unprecedented number of tendon ruptures in training camps and at the beginning of the preseason phase. 60 Large registry-based prospective studies should be completed through the athletic season with periodical measurements using valid and sensitive scoring instruments of the PT-related symptoms, with severity measured based on a functional level and not time loss from sports, and preferring prevalence rather than incidence to report such injury risk. In this light, the PT prevalence data documented in this meta-analysis should be given more weight than the incidence data, as this epidemiological measure appears to better capture overuse injuries over time.
Limitations
The included studies were characterized by an overall heterogeneity, leading us to often implement the random-effects model whenever the I 2 >25%. The number of included studies for the general population was low, and no subgrouping was possible. Multiple epidemiological studies had to be discarded in the study-selection process, which potentially led to data exclusion. A noticeable heterogeneity was detected regarding how the PT diagnosis was formulated in the included studies that could influence the conclusions of this meta-analysis by potentially introducing an intrinsic bias in the inclusion criteria. To limit this bias, priority was given to studies reporting a PT diagnosis by a health professional. Furthermore, a limitation of this study is that in the included studies that used PROs for PT diagnosis, patients with the injury of interest were more likely to respond to the surveys than those without, which may have resulted in a selection bias that led to a higher PT prevalence. Also, patients were likely heterogeneous in terms of acute or chronic onset, although the literature did not allow for further investigation of this aspect because of the lack of detailed specifications in most of the studies. There may also be a different access to care between athletes and the general population, which could skew the data in the general population. Finally, the included literature presents another limitation in terms of RoB, which resulted in 80% of the assessed studies with the NOS at medium quality and 7 out of 16 assessed studies with the AXIS, which did not meet the minimum overall score of 70%.
Conclusion
In this review and meta-analysis, a PT prevalence of 18.3% was found in the active-sport population, whereas the prevalence of PT was limited for the overall population. The prevalence was high in sport-active men; however, female athletes were also significantly affected. Age also showed an influence, with athletes ≥18 years presenting more than double values compared with athletes <18 years, as well as the type of sport, with basketball players and 7 more volleyball players being the most affected by PT.
Footnotes
Acknowledgment
The authors thank Elettra Pignotti for her assistance with the statistical analysis.
¶
Final revision submitted January 2, 2023; accepted February 9, 2023.