
Abstract
Background:
There are some professional baseball players who begin their career as a position player and later convert to a pitcher; injury rates in these players are unknown.
Purpose:
To compare injury rates of professional baseball players who started their career as position players and converted to pitchers with a control group of pitchers who have been only pitchers throughout their professional career.
Hypothesis:
Injury rates would be lower in the conversion players.
Study Design:
Cohort study; Level of evidence, 3.
Methods:
All players who began their professional baseball career as position players and converted to pitchers between 2011 and 2018 were included. All injuries that occurred after they converted to pitchers were included. The conversion players were matched 1 to 1 with a control group of pitchers who entered professional baseball as pitchers and never changed position. Injury rates were compared between groups. The performance between groups was also compared.
Results:
Overall, 221 players were identified who converted from position players to pitchers. There were significantly more injuries per year in the control pitcher group (0.8 ± 0.9) than in the conversion pitcher group (0.7 ± 0.9; P = .015). Injuries in the control group resulted in 61 ± 112 days missed per injury, while injuries in the conversion player group resulted in 54 ± 102 days missed per injury (P = .894). Injury characteristics differed between groups. However, in both groups, most of the injuries were related to pitching or throwing, were noncontact or gradual overuse injuries, and involved the upper extremity. Converted pitchers had lower pitcher usage, with fewer games and innings pitched (P < .001), with significantly worse statistics for walks plus hits per inning pitched (P = .018).
Conclusion:
Professional baseball players who convert from position players to pitchers are injured at lower rates than control pitchers. Conversion pitchers have lower pitcher usage, which may contribute to their reduced injury rates.
Injury rates in professional baseball players have been increasing in recent years. 2,5,9 While injuries occur in all players, pitchers are injured between 3.6 and 5.8 times more frequently than position players. 2 Recent studies have found that the most common injuries in pitchers often involve the shoulder and elbow, likely secondary to the tremendous amount of stress placed on the shoulder and elbow with each pitch, as well as the cumulative workload placed on the shoulder and elbow of these pitchers over time. 3,16,18 –20
Although most pitchers in professional baseball entered either Major or Minor League Baseball as a pitcher, there is a subset of pitchers who began their professional baseball career as a position player and converted to a pitcher while playing professional baseball. It is possible that these conversion players have less wear and tear on their upper extremity before converting to a pitcher compared with pitchers who entered the league as a pitcher and remained a pitcher because they have not had to constantly stress their upper extremity with pitching. 15 Conversely, these conversion players may have more wear and tear on their lower extremity from fielding, batting, and base running throughout the course of their career compared with career lifelong pitchers who had to field and hit on a less frequent basis. Not much is known about the risk of injury in professional baseball conversion pitchers compared with lifelong pitchers.
The purpose of this study was to report injury rates of professional baseball players who started their career as a position player and converted to a pitcher. A secondary purpose was to compare the injury rates of these conversion players to a control group of pitchers who have only been pitchers throughout their entire professional career. A third purpose was to compare pitching performance between these groups. We hypothesized that injury rates per player would be lower in the conversion players as their arms would have seen less overall wear than players who have been pitchers their entire career.
Methods
This study was performed with the approval of the Major League Baseball (MLB) Research Committee. All professional baseball position players who converted from a position player to a pitcher between 2011 and 2018 were eligible for inclusion. Players had to play at least 1 season in professional baseball (either Major or Minor League Baseball) as a position player (infielder, outfielder, and catcher) before converting to a pitcher in order to be included. Those who were position players in college or before and converted to pitchers before entering professional baseball were not included, as this information was not available. Those players who converted from position players to pitchers while playing professional baseball made up the study group and are referred to as converted pitchers. A control group of pitchers who entered professional baseball as pitchers and remained pitchers for the length of their career (control pitchers) was matched 1 to 1 with the conversion players. These control pitchers were matched based on draft round, age, level of play, and dominant arm.
Injury data were analyzed from the MLB Health and Injury Tracking System (HITS) database. The HITS—developed as a league-wide injury surveillance system in 2010 to record player injuries and injury time—is a centralized database that contains deidentified player information. 17 The HITS has been used in several prior studies and found to be a reliable source of information. 1,2,4,7,8
To compare injury rates, we calculated the number of injuries per year. For study players, only injuries that occurred after the conversion of players to pitchers were included. To do so, the year of signing was considered the start year for control players; the year of conversion was considered the start year for study players. The end year was the final year for which there was performance data available for that player. The difference between the start and end year was calculated as the number of years over which the player was at risk for injury. The number of injuries per year, as well as the percentage of pitchers injured, was then calculated. Pitching performance was also compared between groups, with data provided by MLB. Pitching performance metrics included games per year, games started per year, games relieved per year, innings pitched per year, wins per year, losses per year, strikeouts per year, balls batted per year, earned runs per year, home runs per year, earned run average, walks plus hits per innings pitched (WHIP), and strikeouts per 9 innings.
Statistical Analysis
Continuous data were compared between groups using the Student t test and the Mann-Whitney U test as appropriate, depending on data normality, as determined using the Kolmogorov-Smirnov test. Discrete data were compared between groups using the chi-square test and the Fisher exact test as appropriate, depending on cell populations. All analyses were conducted in Excel Version 16 (Microsoft) and SPSS Version 26 (IBM).
Results
There were 221 professional baseball players who were identified to convert from position players to pitchers, of whom 23 (10.4%) were in the major leagues and identified as players who switched from a position player to a pitcher between 2011 and 2018. Each of these players was matched with a control pitcher. Control pitchers were 23.3 ± 2.7 years old and 86% right-handed, whereas converted pitchers were 23.9 ± 3 years old and 86% right-handed (P > .05). There were significantly more injuries in the control pitcher group (P = .002). The control group had also been pitching for more years (P < .001); however, in combination, these resulted in significantly more injuries per year in the control group than in the conversion group (P = .015) (Table 1). In addition, the percentage of players who sustained an injury was significantly higher in the control group than in the conversion group (78% vs 54%; P < .001). Injuries in the control pitcher group resulted in 61 ± 112 days missed per injury, while injuries in the converted pitcher group resulted in 54 ± 102 days missed per injury (P = .894).
Injury Rates for the Control and Converted Pitchers a
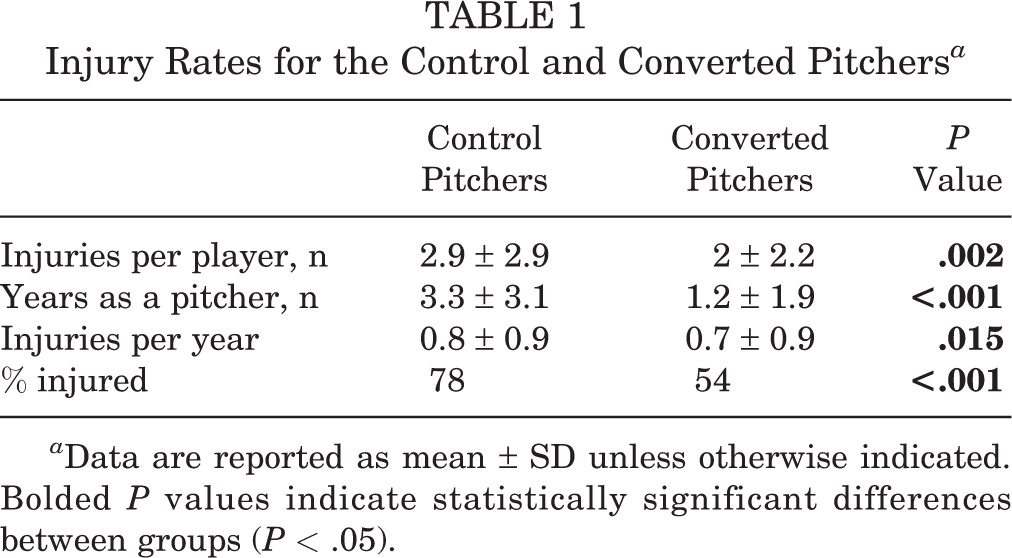
a Data are reported as mean ± SD unless otherwise indicated. Bolded P values indicate statistically significant differences between groups (P < .05).
Injury characteristics differed between groups (Table 2). The database encompasses many specific injuries; however, those that were not specifically classified were placed into the “other” category. Among control pitchers, 62% of injuries were related to pitching or throwing, 65% were noncontact or gradual overuse injuries, and 54% involved the upper extremity. Among converted pitchers, 68.4% of injuries were related to pitching and throwing, while 7.4% of injuries were related to batting or fielding, 73.8% were noncontact or gradual overuse injuries, and 58.6% involved the upper extremity. No difference existed between groups for the mechanism of injury. The most common injuries differed in each group (Table 2).
The Most Common Injuries for the Control and Converted Pitchers a

a The denominator in each category is the number of pitcher years for the control and converted players.
Regarding performance data, converted pitchers started in fewer games (P < .001), pitched fewer innings (P < .001), and had significantly worse statistics for WHIP (P = .018) (Table 3). WHIP, walks plus hits per innings pitched.
Comparison of Performance Data Between the Control and Converted Pitchers a

a Data are reported as mean ± SD. Bolded P values indicate statistically significant differences between groups (P < .05). WHIP, walks plus hits per innings pitched.
Discussion
Professional baseball pitchers are at a significantly higher risk of injury compared with position players. 2 Injury rates in these pitchers have been increasing in recent years. 5 Our study hypothesis was correct, as injury rates in professional players who converted to pitchers were lower than injury rates in players who had been pitchers throughout their entire professional careers.
Although the number of pitchers on the 26-man roster is capped at 13 for the beginning of the season and increases to 14 later in the season, the number of pitchers in an organization can be greater than the sum of all position players In the 2018 draft, 54% of all players drafted were pitchers. 6 The next most common position drafted was outfielders at 17.5%. As such, it is clear that a significant amount of emphasis has been placed on the pitching position in recent years. Interestingly, there are players who begin their career as a position player and, for 1 or more reasons, convert to a pitcher while participating in professional baseball. These players are easily identified, as MLB requires that clubs “designate each player as either a pitcher or a position player before each player’s first day on the active roster for a given season.” 16
There are very different position-specific stresses placed on players’ bodies. Pitchers impart a tremendous amount of stress on their shoulder and elbow during the course of the pitch cycle. 10 –12,20 As such, the most common injuries seen in pitchers involve the shoulder and elbow. 2 Furthermore, these injuries are often chronic in nature, secondary to repetitive stress. Conversely, position players often place more stress on their lower extremity, as they must quickly accelerate from a stance to field ground balls and track fly balls. Hence, position players often sustain acute injuries, specifically hamstring strains, and other lower extremity injuries, much more frequently than pitchers. 2 Furthermore, one of the most common causes of a hamstring injury is a prior hamstring injury; thus, position players who have sustained a hamstring injury may be more likely to continue to experience this issue throughout their career.
These issues are reflected in a study by Camp et al 2 in which the authors found that approximately 80% of hamstring strains occur in position players, while approximately 70% of rotator cuff strains occur in pitchers. Although this difference was not statistically significant, there were slightly more hamstring strains in control pitchers (3.1% of injuries in this group) compared with converted pitchers (2.5% of injuries in this group). This may be because the converted players are more agile than control pitchers, decreasing their risk of hamstring injuries. Furthermore, those authors 2 found that control pitchers, overall, were more likely to become injured than converted pitchers. This may be because control pitchers, who have been pitching their entire career, have sustained more wear and tear on their shoulder and elbow over time and therefore are more likely to sustain an injury during pitching than converted pitchers who have not stressed their shoulder and elbow as much over the course of their career. The control pitchers may also have sustained a prior shoulder or elbow injury from pitching, making it more likely for them to sustain a future shoulder and elbow injury. This may speak to the risk of cumulative workload on the shoulder and the elbow in pitchers. 14,19 A second possibility is that some of the adaptive changes seen in the shoulder by players who are pitchers in their youth and continue to pitch in their careers, such as increased humeral and scapular retroversion, may not be protective against injury in the long term or may increase the risk of injury. 13
A second interesting finding was that the number of injuries per player per year was higher in the control pitcher group compared with the conversion player group. This is likely secondary to a decrease in usage (number of innings pitched per year) of conversion pitchers compared with control pitchers. Finally, there was no difference in the number of days missed as a result of injury between the conversion and control groups. This is likely a reflection of the similarities in injury types experienced by both groups. Further work is needed to understand this unique group made up of converted pitchers. Also, further analysis of injury rates in this group may help elucidate the effects of cumulative workload over a career as compared with recent workload over a season upon injury risk.
Limitations
Players who were position players in college and converted to pitchers before entering and playing a game in professional baseball were not included as conversion players in this study, as this information was not available. There may be some players who converted to pitchers who were not identified. Injuries before the study period were not evaluated. Players who began as pitchers and converted to position players were not included. Not all injuries were accurately categorized and some fell into the “other” category. This study did not control for the type of pitch thrown by control and converted pitchers. Converted pitchers may have been chosen because they were position players who could throw hard, and as such, they may have been more likely to throw more fastballs and fewer breaking balls than control pitchers. The pitch velocity was not examined, which could have contributed to a difference in injury rates.
Conclusion
Professional baseball players who convert from position players to pitchers are injured at lower rates than control pitchers. Conversion pitchers have lower pitcher usage, which may contribute to their reduced injury rates.
Footnotes
Acknowledgment
The authors acknowledge the members of the Professional Baseball Athletic Trainers Society for their continued efforts in updating the MLB injury database and for their care of these athletes.
Final revision submitted July 25, 2021; accepted August 2, 2021.
One or more of the authors has declared the following potential conflict of interest or source of funding: B.J.E. has received education payments from Arthrex, DePuy, and Smith & Nephew and consulting fees from Arthrex. P.N.C. has received education payments from Active Medical; consulting fees from DePuy/Medical Device Business Services; and nonconsulting fees from Arthrex. C.S.A. has received consulting fees and royalties from Arthrex. AOSSM checks author disclosures against the Open Payments Database (OPD). AOSSM has not conducted an independent investigation on the OPD and disclaims any liability or responsibility relating thereto.
Ethical approval for this study was waived by the University of Utah (study No. 00114699).