
Abstract
Background:
A Lisfranc injury can occur to either the ligament or bone, which causes instability when attempting to perform strength and balance maneuvers.
Purpose/Hypothesis:
The study's aims were to (1) analyze the return-to-play (RTP) rate and performance level of players in the National Football League (NFL) after Lisfranc injury and (2) determine the economic and financial impact of Lisfranc injuries to the NFL. We hypothesized that there would be a low RTP rate following Lisfranc injury in the NFL.
Study Design:
Case series; Level of evidence, 4.
Methods:
Multiple online public records were used to identify NFL players with Lisfranc injuries between the 2009 and 2020 seasons. Players were assessed according to their RTP statistics: snap count, approximate value (AV), games played, and games started. Nonparametric methods were used to compare player statistics before and after injury. Also, player salaries while injured were calculated (in 2022 US dollars after adjusting for inflation) to approximate economic loss for those players who returned to play.
Results:
A total of 33 NFL athletes sustained a Lisfranc injury during the study period. Most Lisfranc injuries were experienced by offensive linemen (n = 8; 24.2%), followed by running backs (n = 7; 21.2%). Overall 27 players (81.8%) returned to play after injury at a median of 11.0 months (IQR, 10.2-11.8 months). There were no significant differences between pre- and postinjury snap counts or number of games played and started. In terms of player performance, there was a statistically significant decrease in AV at 1 year postinjury (median [IQR], 6.0 [4.0-10.0] preinjury vs 5.0 [2.5-7.5] postinjury; P = .022). The overall cost of recovery amounted to $104.7 million, with quarterbacks (n = 4) accounting for the greatest cost at $32.6 million. The next 2 most expensive positions were offensive and defensive linemen (n = 5 each) at $19.4 million each.
Conclusion:
Our results did not support the hypothesis, as the RTP rate for NFL athletes sustaining Lisfranc injuries was 81.8%. This injury was associated with a significant decrease in AV 1 year postinjury. In terms of economic impact, quarterbacks accounted for almost one-third of expenses while constituting only 14.8% of injuries.
Given the physical nature of American football, athletes in the National Football League (NFL) are subject to a great deal of strain to their bodies, placing them at an increased risk for injury. 3 Foot injuries account for >15% of all athletic injuries, 12 and an injury to the Lisfranc complex is one of the multiple foot injuries possible. As a result of this injury, instability can arise when attempting to perform strength and balance maneuvers. 12 With decreased mobility, NFL athletes would not be able to perform at the high level to which they are accustomed, adversely affecting their team’s chances of winning football games.
For NFL players, recovery from Lisfranc injury can lead to multiple games missed, not only in the season of the injury but also in following seasons. Although previous studies have reported on the return-to-play (RTP) rate of athletes after Lisfranc injury, 11,17 there is limited literature of the cost associated with recovery. One major component of an NFL player’s contract is that the player’s salary is generally guaranteed in the event of an injury. 1 As a result, players who sustain an injury will get paid regardless of participation in games, leading to potentially significant economic losses for NFL teams. Understanding the economics of Lisfranc injuries can be helpful for supporting efforts to reduce injury risk.
The purpose of this study was to (1) analyze the RTP rate and performance level of players after Lisfranc injury in the NFL and (2) determine the economic and financial impact of Lisfranc injuries in the NFL. We hypothesized that there would be a low RTP rate after Lisfranc injury in the NFL.
Methods
NFL players with Lisfranc injury were identified by cross-referencing multiple online resources and articles, including official injury reports, press releases, game summaries, and websites (BleacherReport.com, CBSSports.com, ESPN.com, NBCSports.com, and NFL.com). This method has been utilized in several prior studies. 4,6,7,9 Each documented case of a Lisfranc injury and need for surgery was verified by a minimum of 2 separate sources. The criterion for inclusion was those who experienced their injury between 2009 and 2020. RTP was defined as any player who played at least 1 snap in at least 1 regular season NFL game after injury.
Information on a player’s draft year, round selection, and height and weight were found using Pro Football Reference (pro-football-reference.com), and the height and weight were used to calculate body mass index (BMI). Players were classified into the following positions: quarterback, running back, wide receiver, tight end, offensive guard, center, offensive tackle, defensive end, defensive tackle, linebacker, and cornerback. These positions were grouped accordingly for analysis: quarterback, running back, receiver (wide receiver, tight end), offensive lineman (offensive guard, center, offensive tackle), defensive lineman (defensive end, defensive tackle), linebacker, and cornerback.
Time Missed and Return to Competition
Time missed was defined as the number of NFL regular season games missed from the date of a player’s Lisfranc injury to when the player returned to a game and played in at least 1 snap. Preseason and playoff games missed were not calculated, as player participation is highly variable.
Per the methodology by Mody et al, 15 the Pro Football Reference database was used to collect the following data points: BMI, draft position, snap counts, games played, games started, and approximate value (AV). AV has been utilized in the NFL to create a standard metric to compare the performance of players of different positions. 15 It is provided by Pro Football Reference and is a numeric calculation of the contribution that an athlete makes toward the success of their team. Each position has its own unique formula, which weighs the relative contribution of the more commonly measured statistics. The AV metric has been utilized multiple times in previous studies on NFL players who have sustained injuries. 8,15,19
Performance data were collected from 3 years before and after a player’s return from Lisfranc injury. Players who were injured in their rookie year were excluded from performance analysis as they did not have preinjury data, and 3-year statistics were analyzed only for players with 3 years of pre- and postinjury data. Players served as their own internal control in this study. RTP time was collected by calculating the number of days between the injury date and the date that the player returned to the field. This was determined by cross-referencing Pro Football Reference match logs with the online resources previously described. All statistics were collected until the end of the 2021 season.
Economic Analysis
Economic loss was calculated using a player’s earnings during the NFL season from Spotrac (www.spotrac.com). A player’s total earnings for the year was divided by the number of regular season NFL weeks (17 weeks) to obtain their weekly salary. There are 16 weeks in a regular season and 1 bye week for each team, totaling 17. After calculation of the number of games that a player missed, cost of recovery (COR) was calculated. Adjustments for inflation were then made using the government-supported Consumer Price Index inflation calculator 20 set to the 2022 US dollar value. Only players who returned to play were included in the economic analysis.
Statistical Analysis
Descriptive statistics were tabulated for all measured outcomes for those returning and not returning to play. Categorical variables were summarized using frequency and percentage. All continuous outcome variables were analyzed for normality using histograms, box plots, and the Shapiro-Wilk test. Homogeneity of variance was examined using box plots and the Levene test. Since a majority of these outcomes significantly violated the assumption of normality (with the desired retainment of outliers), continuous variables were reported using medians and interquartile ranges.
The primary outcome measures for player performance after RTP were snap count and AV. The secondary outcome measure was the number of games played and started for each season. For each of these variables, 2 sets of Wilcoxon signed rank tests were performed: comparing the 3 seasons before and after injury and comparing 1 season before and after injury. In addition, a Wilcoxon rank sum test was used to compare younger players (≤25 years) with older players (>25 years). Because of small sample size, particularly in the group not returning to play, Fisher exact tests were used for comparisons of categorical variables. Across all analyses, P < .05 was considered significant. All analyses were completed in SAS 9.4 (SAS Institute Inc).
Results
A total of 33 NFL athletes sustained a Lisfranc injury during the 2009-2020 seasons, with 26 undergoing surgery. Of these 33 players, 27 returned to the NFL postinjury and were included in RTP analysis (Figure 1). Most Lisfranc injuries were experienced by offensive linemen (n = 8; 24.2%), followed by running backs (n = 7; 21.2%), defensive linemen (n = 5; 15.2%), and quarterbacks (n = 4; 12.1%). In players who returned to play, 24 experienced their injury during an in-season game, while 3 experienced theirs during the off-season/preseason. Athletes who did not return were significantly older (median [IQR], 31.0 years [29.0-33.0] vs 26.0 [23.5-28.5]; P = .007) and had played in the NFL for a longer period (8.5 years [5.5-12.2] vs 3.0 [2.0-6.0]; P = .008) (Table 1). An overall 81.8% (27 of 33) of players returned to play after their injury, with 88.5% (23 of 26) remaining in the NFL for ≥2 seasons after their injury and 76.2% (16 of 21) remaining ≥3 years. These values were adjusted to include only players injured through 2019 for 2-year RTP and 2018 for 3-year RTP, as postinjury data were available only through the most recent season (2021). Of the 27 players who returned to play and met inclusion criteria for analysis, the median time to return was 11.0 months (IQR, 10.2-11.8 months).

Final cohort selection. NFL, National Football League.
Player Characteristics According to RTP After Lisfranc Injury a
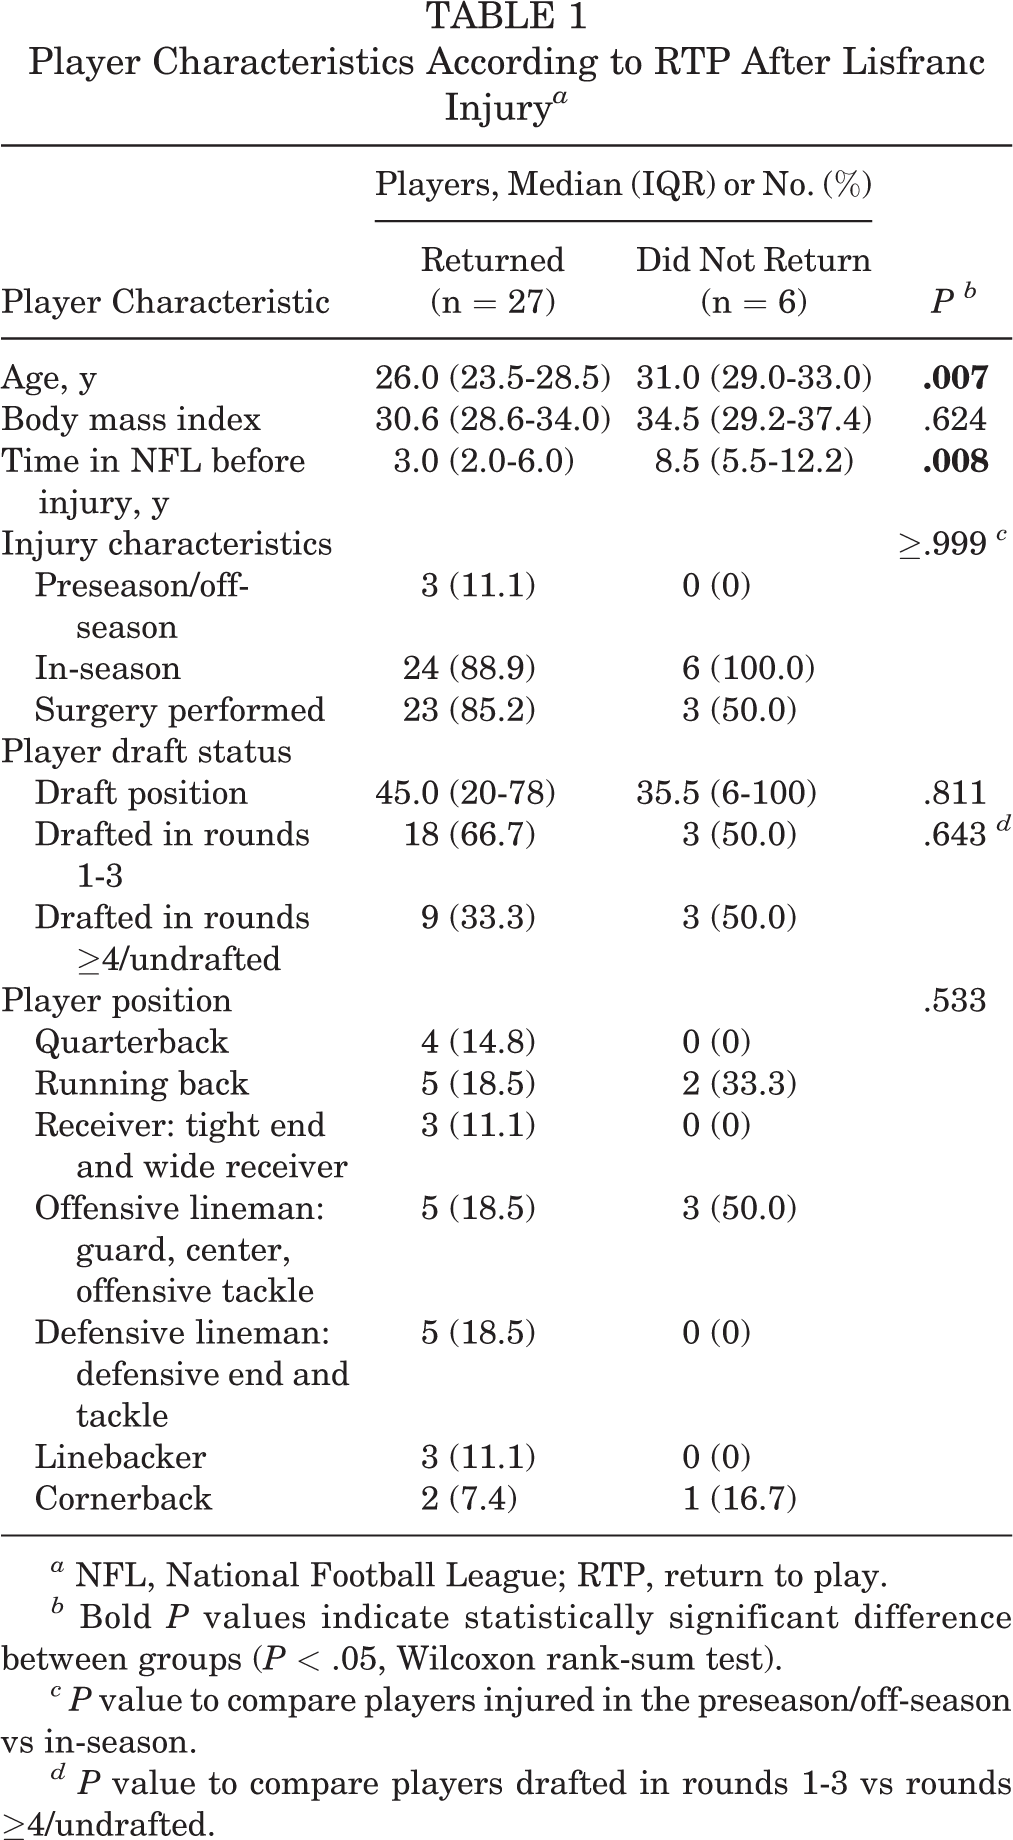
a NFL, National Football League; RTP, return to play.
b Bold P values indicate statistically significant difference between groups (P < .05, Wilcoxon rank-sum test).
c P value to compare players injured in the preseason/off-season vs in-season.
d P value to compare players drafted in rounds 1-3 vs rounds ≥4/undrafted.
Snap Count and AV
In terms of snap count, athletes played a median 687 snaps per year (IQR, 446-857) preinjury and 517 (IQR, 312-726) postinjury averaged across 3 seasons (P = .145). Between the number of snaps played in the season 1 year before and after injury, players participated in a median 643 (IQR, 502-885) and 589 (IQR, 387-876) snaps per year, respectively (P = .244).
In terms of player performance, there was a statistically significant decrease in 1-year AV after injury (median [IQR], 6.0 [4.0-10.0] preinjury vs 5.0 [2.5-7.5] postinjury; P = .022]. However, over the course of 3 years postinjury, differences were not significant (5.0 [3.3-7.8] preinjury vs 4.0 [2.5-5.7] postinjury; P = .080).
Games Played and Games Started
Athletes played in a median 13.0 games per season (IQR, 11.5-15.5) preinjury and 12.3 (IQR, 10.0-14.7) postinjury averaged across 3 seasons (P = .198). Between the number of games played in the season 1 year before and after injury, players played a median 15 (IQR, 13-16) and 15 (IQR, 11-16) games, respectively (P = .195). Injured athletes started in a median 9.5 games per season (IQR, 4.5-14.2) preinjury and 8.0 (IQR, 5.0-11.5) postinjury averaged across 3 seasons (P = .429).
RTP Comparison Between Younger and Older Players
Regarding the 1-year postinjury RTP statistics between younger and older players, there were no statistically significant differences (Table 2). Similarly, there were no significant differences in the 3-year postinjury statistics.
Return-to-Play Statistics Between Younger and Older Players

RTP and Performance by Position
Table 3 shows the RTP rates and Table 4 shows the pre- to postinjury percentage change in snap counts and AV by player position. Defensive linemen experienced a rise in snap counts and AV after a Lisfranc injury. Receivers also saw a slight uptick in snap counts at 3.6%, yet their AV dropped by 41.1%. Offensive linemen were the next least likely to experience a drop in production, having only 8.6% and 16.9% decreases in the snap counts and AV, respectively. On the contrary, linebackers and quarterbacks were the most likely to experience a drop, decreasing their respective snap counts by 54.2% and 25.3% and their respective AV by 73.2% and 74.9% postinjury. On average, there were 8.8% and 22.6% decreases in snap counts and AV, respectively, when the cohort was analyzed (n = 22; 1 lineman was excluded from the analysis because of low snap counts and an AV of 0). These findings were not significant; however, trends were seen within our sample size.
RTP Rates at 1, 2, and 3 Years Postinjury According to Player Position a

a RTP, return to play.
b Two-year rate includes players injured between the 2009 and 2019 seasons.
c Three-year rate includes players injured between the 2009 and 2018 seasons.
Change in Snap Counts and AV After Return to Play According to Player Position (22 Players) a

a Negative values indicate a decrease vs preinjury values; positive values, an increase. AV, approximate value.
b One player was excluded for an AV of 0 and low snap counts before surgery.
Economic Analysis
The number of players who returned to play per season is shown in Table 5, with the highest amounts being in 2013 and 2019. Tables 6 and 7 describe the economic loss by NFL teams, broken down by position and year for players who returned to play at 1 year postinjury (n = 27). Based on these findings, anywhere between $0 and $28.482 million dollars were lost in the NFL per year based on the number of injuries sustained and the position of the players who were injured. On average, quarterbacks who sustained a Lisfranc injury caused the greatest economic loss for an NFL team at $8.159 million per player, while cornerbacks cost the least at $0.672 million per player. In total, between 2009 and 2020, the COR was $104.716 million.
Lisfranc Injury by Player Position and Year a
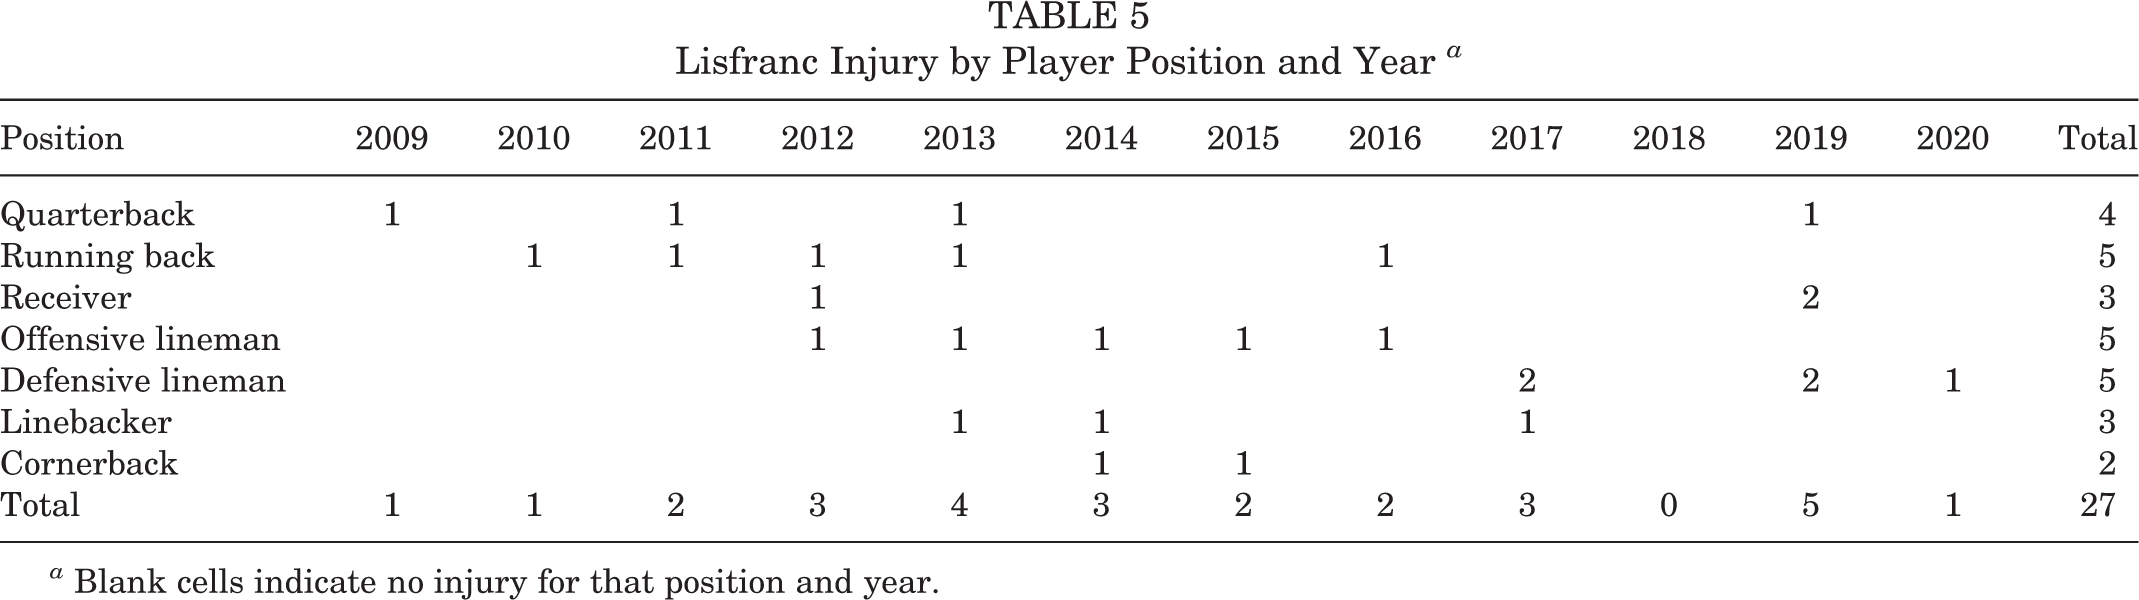
a Blank cells indicate no injury for that position and year.
Economic Loss by Position of NFL Player and Year a

a Data are reported in millions of 2022 US dollars after adjusting for inflation. Blank cells indicate no economic loss for that position and year. NFL, National Football League.
b Includes a player from a previous-season injury who missed games the recorded year.
Economic Loss and Return to NFL by Player Position a

a NFL, National Football League; RTP, return to play.
b In millions of 2022 US dollars after adjusting for inflation.
Discussion
The study results indicated that 81.8% of players (27 of 33) returned to play after their Lisfranc injury between 2009 and 2020. This finding is surprising, given the general belief that Lisfranc injuries have the potential to end athletic careers and result in chronic pain and loss of function. 21 Previous studies reporting on RTP after a Lisfranc injury in athletes have had similar or lower sample sizes. 2,11,16,18,21 Most Lisfranc injuries were experienced by offensive linemen (n = 8; 24.2%), followed by running backs (n = 7; 21.2%). The median RTP time was 11.0 months (IQR, 10.2-11.8). There was no significant difference in the postinjury number of games played, games started, or snap counts. Defensive linemen had increased snap counts and AV after RTP, by 23.2% and 84.2%, respectively, although these increases were not significant as compared with preinjury values. This was likely due to the small sample size and the consequently large effect that a single player can make. In terms of player performance, there was a statistically significant decrease in AV during the return year after injury (median [IQR], 6.0 [4.0-10.0] preinjury vs 5.0 [2.5-7.5] postinjury; P = .022]. These findings are mostly similar to those noted by McHale et al 11 in which they found no statistically significant change in pre- and postinjury athletic performances (offensive power ratings and defensive power ratings) by NFL offensive and defensive players who sustained a Lisfranc injury between 2000 and 2010. A unique portion of this study was comparing RTP statistics based on a player’s age. Younger players did not have statistically better postinjury performance than older players. This may indicate that even though older players were more likely to not RTP, the ones who did had similar outcomes to younger players. Offensive and defensive linemen accounted for 39.4% of injuries, which may be due to their having higher BMIs than other positions on the football field 14 and performing a lot of planting maneuvers that can cause excess load on their feet. Also, there are more players actively playing this position on the field as compared with other positions, such as quarterback, and given the inherit condition of their position, they are at an increased risk of opposing players falling or stepping on their feet.
During these 12 seasons, the NFL paid $104.8 million toward the COR for players. The greatest financial burden was attributed to quarterbacks ($32.6 million), followed by offensive linemen ($19.4 million), defensive linemen ($19.4 million), and receivers ($16.5 million). Quarterbacks who sustained Lisfranc injuries had the highest cost burden of any position, which can be expected since on average they command the highest salaries on their teams. 5 A similar cost analysis study was performed on Tommy John surgery in Major League Baseball, which found the COR to be $395 million between 2004 and 2014. 13
A review of the literature regarding Lisfranc injuries in the NFL reveals studies that have shown a lengthy mean RTP time, as well as the treatment modalities available for players who have sustained this injury. McHale et al 11 found that >92.9% of the 28 NFL athletes sustaining a Lisfranc injury between 2000 and 2010 returned to competition at a median 11.1 months. Another study found that among the 29 NFL players with Lisfranc injuries who returned to competition, a mean ± SD 10 ± 2.9 months were required. 17 Our study is in line with these, as the variation in return times can be due to the relatively low sample sizes analyzed in each study.
In addition to studies conducted on the general public, researchers have studied NFL athletes with Lisfranc injuries. McHale et al 12 conducted a cohort study that analyzed 41 NFL Combine participants with Lisfranc injuries. When compared with controls, players with Lisfranc injuries tended to have worse NFL draft positions (142 rounds vs 111.3 rounds in the control group), shorter NFL careers, and fewer mean games played (16.9 vs 23.3 in the control group). The authors also analyzed the severity of injury and treatment on NFL players, finding that players with a history of operative treatment went undrafted more frequently than players who were treated nonoperatively (38.5% vs 13.3%, respectively). In addition, players who received operative treatment were drafted later than those who had nonoperative treatment (155.6 rounds vs 109 rounds, respectively). 12 Our study builds on their findings, as the majority of our players played at least 1 year in the NFL before injury (29 of 33; 87.9%). Since the players included in our study were already in the NFL before injury, it can be interpreted that their teams have invested more into them and their development. With the advancements of medical and surgical management made throughout the years, as well as better anatomic understanding, management of Lisfranc injuries have evolved 10 to where players are able to RTP without devastating consequences. However, our study did not assess the role of surgical versus nonsurgical management for these injuries.
While this study analyzes the effect of Lisfranc injury on the future playing ability of players, further research could be directed toward a comparison of operative therapies (benefits and costs) for those players who have severe Lisfranc injuries not amenable to nonoperative therapy. With such a cost to the NFL, it can be of benefit to consider the effect of current technologies, such as the playing surface or shoe technology, and how they affect the development and outcomes of this injury.
Limitations
This study was not without limitations. Players with Lisfranc injuries were identified through public resources, and as a result, anyone who was not reported in public databases would not be included in this study. The AV algorithm used for performance examination has not been validated. RTP dates may be inexact for players who recovered during the off-season, as no games were played. The timing of injury within the season can affect the number of games missed. In addition, 3-year performance statistics were able to be analyzed only for players with 3 years of pre- and postinjury data. With the small sample size for each position, definitive statistical analysis is difficult to achieve owing to the study being underpowered. Not every player had a complete data set of values for each statistic measured. Injury details (soft tissue vs bony) and rehabilitation participation were not assessed, which can influence RTP outcomes. These limitations were also present in a prior analysis on RTP in the NFL. 15
Our study did not analyze cofactors in a player’s recovery that can increase costs, such as, travel or rehabilitation costs. We did not account for preseason and playoff participation in our economic analysis. We chose not to include these because of their variable nature, which would result in an overgeneralization of results. Off-season activities were excluded as well, as a player’s salary is determined primarily on his in-season availability. Finally, since every player’s contract verbiage is variable and private, we did not have access to exactly how one’s salary structure was set. These exclusions and limitations were also present in a prior economic analysis study. 13
Conclusion
Our results did not support the hypothesis, as the RTP rate for NFL athletes sustaining Lisfranc injuries was 81.8%. This injury was associated with a significant decrease in AV 1 year postinjury. In terms of economic impact, quarterbacks accounted for almost one-third of expenses while constituting only 14.8% of injuries.
Footnotes
Final revision submitted December 20, 2022; accepted January 19, 2023.
One or more of the authors has declared the following potential conflict of interest or source of funding: A.V.S. has received grant support from Arthrex; education payments from Arthrex, Legacy Ortho, Smith & Nephew, and Stryker; nonconsulting fees from Smith & Nephew; and hospitality payments from Wright Medical. AOSSM checks author disclosures against the Open Payments Database (OPD). AOSSM has not conducted an independent investigation on the OPD and disclaims any liability or responsibility relating thereto.
Ethical approval was not sought for the present study.